

Abstract
Opioid receptors may play critical roles in alcoholism and other addictions, addiction withdrawal, and depression and are considered pharmacological targets for treatment of these conditions. Sex differences have been demonstrated in mu (MOR) and delta (DOR) opioid receptors in humans, in vivo. In addition, sex differences have been observed in efficacy of treatment targeting kappa opioid receptors (KOR). Our goal in the present study was to compare the availability of KOR (1) between healthy control (HC) men and women. Twenty-seven subjects-18 males (M) and 9 females (F)-underwent PET scans with [11C] LY2795050, a selective kappa antagonist tracer. Partial volume correction was applied to all PET data. Volume of distribution (V T) of the tracer was estimated regionally as well as at the voxel level. V T values of males versus females were compared for 19 defined ROIs. Results at the regional and voxel levels were consistent. Males had significantly higher V T and thus a higher KOR availability than women in multiple brain regions. To our knowledge, this is the first report of sex differences in the KOR system in humans, in vivo. These findings could have implications for the treatment of pain with kappa opioid analgesics. The results may also have an impact on the diagnosis and treatment of addictive and other disorders.
Keywords: Sex differences, kappa opioid receptor system, volume of distribution, PET imaging
Introduction
Dynorphin (DYN) binds to kappa-opioid receptors (KOR) and is important in modulating the reward system in behavior [1]. Thus, the KOR system is a potential therapeutic target for addiction, pain and mood disorders. Binding of dynorphin to KOR is believed to induce a negative mood state and negative symptoms [2]. It has been proposed that in both pre-clinical and clinical models, KOR and MOR work in opposition to each other [3,4]. Furthermore, in alcohol dependence, over-activation of the KOR system relative to the mu opioid receptor (MOR) system amplifies negative symptoms, leading to self-medication via alcohol drinking [4]. A growing body of research suggests that sex is a major factor involved in modulating the pharmacological effects of opiate medications as well as endogenous opioids [5]. A better understanding of the sex differences in the endogenous KOR system could contribute to the development and understanding of opioid analgesia as well as novel treatments for drug dependence and other disorders that stem from an imbalance in the brain’s reward system.
While the majority of sex difference findings related to KOR are from studies of the analgesic effects of kappa agonists, there is also emerging evidence of KOR-related sex differences in addictive and affective states [6]. In clinical studies, kappa agonists produce greater analgesia in women compared with men [5] but opposite effects have been observed in preclinical studies [7,8].
In the area of addiction, there is evidence of sex-specific, kappa-related effects in pre-clinical models of drug-induced behavior. Administration of the kappa agonist U62066 inhibited NMDA-evoked dopamine release more in male mice than females [9]. Female rhesus monkeys appeared to be more sensitive to kappa-antagonist induced changes in PCP self-administration [10].
Sex differences were observed in clinical responses to addiction medications, such as the opioid antagonist naltrexone (NTX), which non-selectively targets KOR. In a co-morbid cohort, both drinking and cocaine usage decreased in men but increased in women after 12 weeks on 150 mg of NTX [11]. A recent study found that 100 mg NTX reduced total number of drinks consumed after treatment in males with family history of alcoholism, but not women [12]. Treatment with a 380 mg injection of long-acting NTX decreased heavy drinking days in alcohol-dependent (AD) males only [13]. Hernandez-Avila found that 8-week treatment with 50 mg NTX reduced the number of drinks/day only in the AD males [14]. Conversely, the outcome of the COMBINE trial showed no sex differences in response to NTX based on a wide range of outcome measures [15]. At this point, the existence of sex differences in clinical response to NTX treatment remains unresolved.
PET imaging is a uniquely valuable tool for understanding differences in the KOR system because it can measure the spatial distribution and density of KOR in human subjects, in vivo. Understanding KOR at a receptor level could contribute to identifying biological targets for addiction medication. Measuring KOR in vivo with PET requires a tracer that is selective for the desired target. Thanks to the recent development of a selective kappa antagonist [16] and its PET tracer analog [11C] LY2795050, which is a selective tracer for KOR [17,18], it is now possible to safely and reproducibly probe the KOR in human subjects, in vivo [19].
Existing PET studies on opioid receptor availability have focused on MOR [20-22]. Some sex differences have been found. Using the MOR-selective agonist tracer [11C] carfentanil, MOR availability was found to be higher in female healthy controls (HC) compared to male HC in multiple brain regions [23].
Sex differences in KOR availability in humans have not been investigated thus far. A recent review by Chartoff and colleagues synthesized what is known about sex differences in the KOR system. The review concluded that at this point, very little is known that directly connects sex differences in DYN and KOR function with sex differences in drug addiction. It specifically identified lack of examinations of sex differences in KOR expression levels and patterns as a major gap in understanding the role of the opioid receptor systems in analgesia and addiction [6]. The objective of the present study is to examine sex differences in endogenous KOR availability in humans, in vivo, and connect these findings to sex differences in clinical response to therapies that target the opioid receptor system.
Methods and materials
Subjects
18 male and 9 female subjects between 18 and 70 years of age were recruited via posted and online advertisement. Male (mean 34.2 ± 12.6 yrs.) and female (33.1 ± 10.3 yrs.) subjects were well matched for age (p=0.82). This and other demographic characteristics are shown in Table 1.
Table 1.
Subject Demographics and Injection Parameters
| Entire Sample (N=27) | |||
|---|---|---|---|
|
|
|||
| Male vs. Female | Male | Female | P |
| Total | 18 (66.7%) | 9 (33.3%) | |
| Age, mean ± SD | 34.2 ± 12.6 | 33.1 ± 10.3 | 0.82 |
| Bodyweight1 | 84.4 ± 15.4 | 76.3 ± 12.9 | 0.07 |
| Specific Activity2 | 0.53 ± 0.32 | 0.57 ± 0.25 | 0.65 |
| Injected dose/bodyweight3 | 0.12 ± 0.05 | 0.13 ± 0.07 | 0.63 |
| Mass dose/bodyweight4 | 0.09 ± 0.05 | 0.11 ± 0.07 | 0.12 |
In kg;
In mCi/nmol at time of injection;
In mCi/kg;
In µg/kg.
Data shown are number of subjects with percentage indicated in parentheses.
Inclusion and exclusion criteria
Subjects were obtained from a study to develop and validate kappa-specific ligands [24]. The Yale IRB approved all procedures for these studies and written informed consent was obtained from all subjects.
For inclusion in the study, participants satisfied all of the following: i) no current uncontrolled medical conditions, ii) no personal history of any axis-I diagnosis based on DSM-IV criteria, iii) no history of substance dependence in the last two years, including opiate, marijuana, alcohol, and nicotine, iv) No usage of opiate medications at time of study, v) no claustrophobia and vi) no contradictions for MRI such as metal implants.
Participants were excluded for any of the following: i) Current or past major DSM IV Axis I disorders, ii) Smoking at any point in their life a iii) Evidence/report of any heart abnormality, major neurological illness or injuries, renal and liver function impairment, eating disorders, and diabetes, iii) Presence of any legal or illegal psychoactive substances determined with urine toxicology and breathalyzer tests, iv) Pregnancy, lactation, or lack of effective birth control during the 15 days before the scans, v) Lifetime exposure to radiation in the workplace, or past exposure such that participation in this study would cause the subject to exceed the FDA dose limits for annual radiation exposure, vi) Blood donation within 8 weeks of the study.
Prior to scanning, all subjects received a urine drug screen and a breathalyzer test. All female subjects of child-bearing potential were administered a urine pregnancy test. For menstruating female participants, the timing of PET scanning within the menstrual cycle was fixed so that females were studied (whenever possible) during the follicular phase of their menstrual cycle.
Naltrexone administration
About half of the cohort (13/27) underwent a second, same-day PET scan after receiving a single, acute oral dose of NTX (150 mg) 75 minutes before the second scan.
Imaging
[11C] LY2795050, a selective kappa antagonist tracer [18], was synthesized as reported previously [17]. All 27 HC subjects completed one [11C] LY2795050 PET scan (0.13 ± 0.06 mCi/kg). Thirteen out of 27 HC subjects completed a same-day post-NTX scan in the afternoon. Of the 13 subjects that completed a post-NTX scan, males and females were matched for age (p=0.71).
PET scans were acquired on a HRRT scanner (Siemens/CTI, Knoxville, TN, USA). [11C] LY2795050 was injected as a bolus over 1 minute. Dynamic scan data were acquired in list-mode and reconstructed (FWHM ≈ 3 mm) in 27 frames (6 × 0.5 mins, 3 × 1 min, 2 × 2 mins, 16 × 5 mins) with corrections for attenuation, normalization, scatter, randoms and dead time using the iterative algorithm, MOLAR. Motion correction at the event-level [25] (Polaris Vicra Tracking System, Northern Digital, Waterloo, Canada) was applied. The free fraction of [11C] LY2795050 in plasma (fp) was measured as previously described [17] and was ~1%. Other injection parameters are given in Table 1.
Prior to their PET scan, subjects underwent magnetic resonance imaging (MRI) on a 3T whole-body scanner (Trio, Siemens Medical Systems, Erlangen Germany). The structural T1 MRI was acquired for anatomical localization of the PET brain regions of interest.
Image pre-processing
Partial volume correction (PVC) was performed in native PET space and applied to all PET data [26] from all subjects. Estimation of white matter (WM) signal was performed according to the method of Giovacchini et al. [27] which attempts to more accurately estimate WM activity compared to the original Muller-Gartner method.
PVC data were transformed into the template space (Montreal Neurological Institute, MNI) [28]. To determine the correct transformation for each subject from PET to MNI, the summed (0 to 10 minutes after injection) PET image was first co-registered to the subject’s own high-resolution T1-weighted MR image which was subsequently co-registered to the template [29].
The 19 regions of interest (ROIs) included in this study were taken from the Automated Anatomical Labeling (AAL) template for SPM2 [30] in MNI space. The ROIs were the whole brain gray matter (GM), amygdala, centrum semiovale, caudate, cerebellum, anterior and posterior cingulate cortex, frontal cortex, hippocampus, insula, occipital cortex, ventral pallidum, parietal cortex, putamen, temporal cortex, thalamus, precentral gyrus, fusiform gyrus and Rolandic operator. A GM mask was applied to the whole brain ROI to exclude signal in the WM and cerebral spinal fluid (CSF).
Time activity curves (TACs) were extracted from the 19 ROIs using the mean radioactivity in the ROI for each time frame. TACs were fitted with the multilinear analysis-1 (MA1) model [31] using the metabolite-corrected arterial input function to estimate volume of distribution (V T) by region.
Volume of distribution (VT)
The primary output measure in this study was baseline (pre-NTX) volume of distribution (V T), a normalized measure of tracer uptake in the target tissue.
VT = ([Tissue]/[Plasma])|steady state [1]
[Tissue] is the concentration of tracer in the tissue and [Plasma] is the concentration of tracer in the plasma.
The components of the signal are the specific (V S) and the non-displaceable (V ND) volumes of distribution, respectively [32].
VT = Vs + VND [2]
Calculation of VND
In order to attribute observed differences in V T to differences in receptor availability with confidence, V ND must not differ between cohorts. V ND was calculated via modified Lassen plots [33] using the total V T in the GM at baseline and at blocking (post-NTX). For the subset of subjects that received an acute blocking dose of NTX (n=13), the baseline and blocking scans were used to calculate a mean V ND for the entire cohort.
A more direct measure of receptor availability is specific binding potential (BP ND), which would have been used as a primary endpoint if a well-defined reference region had been available.
Regional analysis
Regional V T values were compared for the 19 defined ROIs across different cohorts for males vs. females. Significant differences at the region level (p<0.05, uncorrected) were evaluated using unpaired t-tests (not corrected for multiple comparisons).
Creation of parametric VT maps
Voxel-by-voxel (parametric) maps of V T were created from PET data following PVC. Only baseline scans were used. The MA1 model (t*=30) was fitted at each voxel in order to calculate V T maps. Maps were spatially normalized to MNI space.
Because of noise in the dynamic PET data at the voxel level, the MA1 model occasionally produced poor fits and non-physiological V T values at individual voxels. To correct for this, parametric maps of the weighted sum of squared residuals (WSSR) from the MA1 fits were calculated for each subject. The WSSR maps were thresholded at 3 standard deviations above the mean WSSR to identify voxels containing outlier V T values. These V T values were excluded. To avoid images with undefined voxels, the excluded V T values were replaced with the median V T of the 26 nearest-neighbor voxels.
Voxel-based analyses
Whole-brain analyses were performed in SPM8 (Wellcome Trust Centre for Neuroimaging, London, UK, http://www.fil.ion.ucl.ac.uk/spm/). The processed V T maps were smoothed with a 7 mm FWHM Gaussian kernel and masked by a binary grey-matter mask. Parametric statistical models were assumed at each voxel using the general linear model. Voxel-wise two-sample t-tests were performed to examine the differences in V T between cohorts and voxel-wise t-score maps were produced. A primary threshold of voxel-wise p < 0.001 was applied to the t-score maps, which yielded a cluster-extent based (CEB) threshold to retain clusters that survived family-wise error (FWE) correction as recommended by Woo and colleagues [34]. The CEB threshold was calculated with the Gaussian random field (GRF) method implemented in SPM8 using an estimated intrinsic smoothness based on residual images. Subsequently, the CEB threshold was applied to the thresholded t-score maps.
Results
Average parametric images
Figure 1 shows (A) the mean V T image of male (n=18) and (B) female subjects (n=9) after PVC. All subjects in each cohort were used to create the mean images. All images were grey-matter-masked, as described above. Images are in MNI space and appear smoothed because they are averages. The mean images are both displayed on the same color scale. Higher V T in M vs F is apparent visually in the frontal cortex. Males had significantly (p=0.04) higher V T overall in the brain. A comparison of baseline V T in males vs females for the whole brain (GM only) region is shown in Figure 2.
Figure 1.
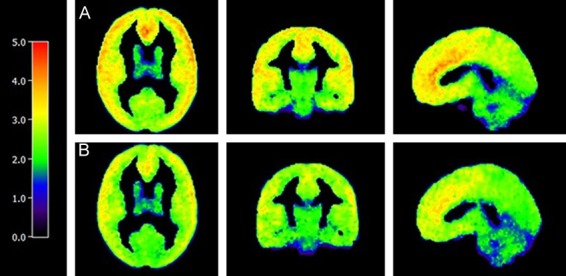
Average Parametric V T Images for Male and Female Cohorts. Average parametric V T image of males (A, n=18) and females (B, n=9). V T at each voxel is calculated using MA1 (t*=30). Values outside of 3 standard deviations of the mean were excluded. Colored legend depicts [11C] LY2795050 V T from 0 (black) to 5.00 (red).
Figure 2.

Analysis of VT of Grey Matter of the Whole Brain in Males vs. Females. [11C] LY2795050 VT in male (M) versus female (F) subjects for the total grey matter in the brain. Bars are the mean ± SD [11C] LY2795050 VT. The asterisk above the bars indicates a significant difference in VT between M and F subjects as determined by an unpaired t-test (p=0.04).
ROI analysis of sex differences in VT
Analyses showed that in 9 ROIs, significantly higher V T values were observed in the males versus females. Subsequent correlation analyses showed that there were no significant correlations of V T with age in any ROIs for the whole cohort or by sex.
Figure 3 gives a regional comparison of baseline V T in males vs. females for all 18 ROIs (excluding whole brain ROI). Higher V T values were observed in the male cohort across all regions. Nine regions were significantly (p<0.05) higher in males than females. These regions were: anterior cingulate cortex, frontal cortex, insula, ventral pallidum, parietal cortex, temporal cortex, precentral gyrus, fusiform gyrus and Rolandic operator. The cerebellum and occipital cortex showed the same trend (p<0.10). V T values from all regional analyses for comparisons of males vs. females are given in Table 2.
Figure 3.
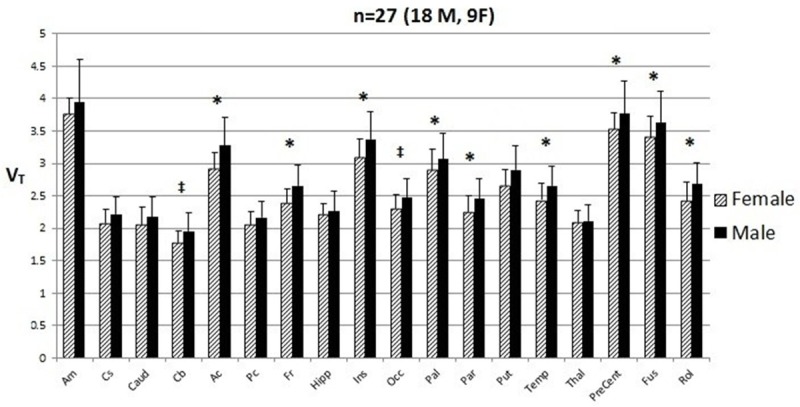
ROI Analysis of V T in Males versus Females. [11C] LY2795050 VT in male (M) versus female (F) subjects at the region of interest (ROI) level. Bars are the mean ± SD of [11C] LY2795050 VT for amygdala (Am), centrum semiovale (Cs), caudate (Caud), cerebellum (Cb), anterior cingulate cortex (Ac), posterior cingulate cortex (Pc), frontal cortex (Fr), hippocampus (Hipp), insula (Ins), occipital cortex (Occ), ventral pallidum (Pal), parietal cortex (Par), putamen (Put), temporal cortex (Temp), thalamus (Thal), precentral gyrus (PreCent), fusiform gyrus (Fus), and Rolandic operator (Rol). The model is not corrected for multiple comparisons. *p<0.05, ‡p<0.10 p-value corresponds to difference in V T between M and F subjects as determined by an unpaired t-test.
Table 2.
V T values in all ROIs for Males versus Females. [11C] LY2795050 VT values calculated using the MA1 model. Values are shown for 19 ROIs and VND, with p-values for comparisons between M and F and AD and HC. Significant regions and values are in bold
| ROI | P-value | ||
|---|---|---|---|
|
|
|||
| M vs. F | M | F | |
| Whole Brain | 3.14 ± 0.38 | 2.89 ± 0.25 | 0.04 |
| Amygdala | 4.22 ± 0.68 | 4.06 ± 0.26 | 0.25 |
| Centrum Semiovale | 2.68 ± 0.41 | 2.56 ± 0.35 | 0.22 |
| Caudate | 2.54 ± 0.33 | 2.38 ± 0.29 | 0.11 |
| Cerebellum | 2.12 ± 0.34 | 1.94 ± 0.20 | 0.08 |
| Anterior Cingulate Cortex | 3.96 ± 0.51 | 3.43 ± 0.38 | 0.005 |
| Posterior Cingulate Cortex | 2.56 ± 0.28 | 2.41 ± 0.21 | 0.08 |
| Frontal Cortex | 3.59 ± 0.44 | 3.24 ± 0.29 | 0.02 |
| Hippocampus | 2.44 ± 0.33 | 2.37 ± 0.18 | 0.28 |
| Insula | 3.99 ± 0.52 | 3.61 ± 0.36 | 0.03 |
| Occipital Cortex | 3.09 ± 0.34 | 2.86 ± 0.28 | 0.15 |
| Ventral Pallidum | 3.64 ± 0.51 | 3.28 ± 0.50 | 0.04 |
| Parietal Cortex | 3.36 ± 0.42 | 3.09 ± 0.34 | 0.04 |
| Putamen | 3.42 ± 0.51 | 3.13 ± 0.32 | 0.07 |
| Temporal Cortex | 3.30 ± 0.39 | 3.03 ± 0.32 | 0.04 |
| Thalamus | 2.28 ± 0.29 | 2.29 ± 0.17 | 0.45 |
| Precentral Gyrus | 3.80 ± 0.50 | 3.34 ± 0.25 | 0.008 |
| Fusiform Gyrus | 2.68 ± 0.33 | 2.41 ± 0.28 | 0.02 |
| Rolandic Operator | 3.79 ± 0.47 | 3.40 ± 0.33 | 0.02 |
| VND | 1.56 ± 0.29 | 1.50 ± 0.27 | 0.75 |
Note: Regional V T was also estimated prior to PVC. The male group showed higher V T than females in all ROIs. The same nine regions were significantly (p<0.05) higher in males. Males and females did not differ in fp (p=0.63).
Comparison of VND
The male and female cohorts did not have different V ND values (p=0.75) (Figure 4). Differences in V T can reasonably be attributed to differences in specific binding V S (Equation 2).
Figure 4.

Comparison of Non-Displaceable VT (VND) in Males versus Females. [11C] LY2795050 VND in male (M) versus female (F) subjects for the total grey matter in the brain. Calculation of VND was performed using linear-regression-fit Lassen plots. Bars are the mean ± SD [11C] LY2795050 VND. There was no significant difference in VND between M and F subjects as determined by an unpaired t-test (p=0.75).
Voxel-based analysis of sex differences
SPM analysis of [11C] LY2795050 V T in males and females confirmed that male subjects had higher V T in multiple brain areas. Voxel-wise results are shown in Figure 5. Group differences were seen in eight main regions: anterior cingulate cortex, frontal cortex, insula, temporal cortex, precentral gyrus, right Rolandic operator, left fusiform gyrus, and cerebellum. Seven of these regions-anterior cingulate cortex, frontal cortex, insula, temporal cortex, precentral gyrus, Rolandic operator and fusiform gyrus-were also found to be significantly different in the ROI analysis.
Figure 5.
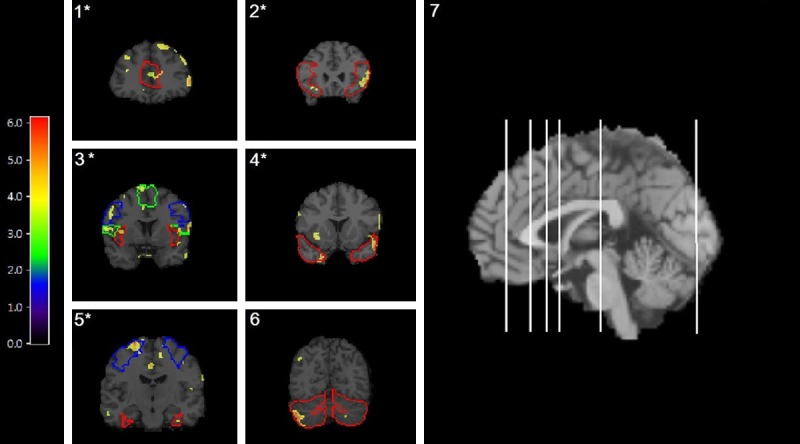
Voxel-by-Voxel Analysis of V T in Males versus Females. [11C] LY2795050 VT images from a two-sample t-test between M and F using statistical parametric mapping (SPM) overlayed with an atlas. Regions with a significant difference (p<0.001, family-wise error [FWE]) between M and F, where M>F, are outlined as follows: 1) anterior cingulate cortex, 2) frontal cortex, 3) insula (red), left precentral gyrus (blue) and left Rolandic operator (green), 4) temporal cortex 5) right fusiform gyrus (red) and left frontal cortex (blue) and 6) cerebellum. (7) Locations of each coronal slice are shown in the sagittal view of the brain-from L to R on sagittal view are coronal slices 1-6 respectively. *indicates a region also found to be significant (p<0.05) with the ROI analysis depicted in Figure 5. Colored legend depicts t-scores ranging from 0 to 6.18.
Discussion
We believe this is the first study of sex differences in the kappa opioid receptor (KOR) system in humans, in vivo. We found that males have more available KOR than women. ROI analysis showed a significant difference between males and females in multiple brain regions. Voxelwise analysis (with correction for multiple comparisons) confirmed our findings in seven of nine regions. One region not found to be significant at the ROI level was identified by voxel level analysis (cerebellum). This region is large and a localized effect could have been diluted by the large ROI.
Some limitations need to be considered. BP ND would be a more ideal primary endpoint as it is a more sensitive indicator of sex differences. However, without a reference region, a blocking study is needed in each subject to get a reliable estimate of individualized V ND. Unfortunately, only a fraction of the cohort was scanned in the blocking condition, thus reducing our cohort size appreciably.
These findings have possible clinical implications. The findings from Gear [35-38] consistently show that women have a more robust analgesic response upon administration of kappa agonist. It follows that the opposite-men have a more robust response than women-holds true after administration of a kappa antagonist. In fact, this has been shown clinically [11,15]. Our findings of higher KOR in males might explain higher response of males than females to kappa opioid antagonists such as naltrexone.
It is also interesting to consider our findings in the context of the likely interplay between the KOR and mu opioid receptor (MOR) system. While we report greater KOR availability in men compared to women, Zubieta et al. reported the opposite for MOR, that is, greater MOR receptor availability in women compared to men [23,39]. The fact that MOR is altered based on sex shows that examining all opioid receptor subtypes by sex is important, as presented in this paper.
Higher KOR availability in men is most likely not the only reason for potential sex differences in pharmacotherapeutic effectiveness. Factors such as hormonal differences, genetics, central nervous system differences and pharmacodynamic differences should also be explored. Nevertheless, this is the first study to examine sex differences in kappa receptor availability in humans-previous studies of kappa receptors have only been in small animals. As current evidence suggests differing mechanisms between human and non-human species [8], more examination of the human KOR system is necessary.
Our findings of sex-differences in KOR supports the growing body of work suggesting the need to recognize sex differences in the efficacy of drugs targeting opioid receptors. Our findings point toward a possible biological basis for these differences in clinical effectiveness and merit further investigation. Connecting the level of KOR availability to the differential effectiveness of drugs may help guide the development of new therapies targeting KOR.
Importantly, the availability of selective tracers for kappa, mu and delta now allow for parallel studies of different opioid receptor subtypes in the same individuals. Longitudinal, multi-tracer studies of alcoholics undergoing treatment could reveal changing levels of opioid receptor subtypes as presumed imbalances either progress or resolve.
Acknowledgements
This work was supported by research grants AA021818 (EDM & SK-S) and MH091537 (YH). The authors declare no conflict of interest. This work would not have been possible without the work of the Yale PET center chemistry team, imaging technologists and nurses.
Disclosure of conflict of interest
None.
References
- 1.Bruijnzeel AW. kappa-Opioid receptor signaling and brain reward function. Brain Res Rev. 2009;62:127–146. doi: 10.1016/j.brainresrev.2009.09.008. [DOI] [PMC free article] [PubMed] [Google Scholar]
- 2.Walker BM, Koob GF. Pharmacological evidence for a motivational role of κ-opioid systems in ethanol dependence. Neuropsychopharmacology. 2008;33:643–652. doi: 10.1038/sj.npp.1301438. [DOI] [PMC free article] [PubMed] [Google Scholar]
- 3.Pan ZZ. mu-Opposing actions of the kappa-opioid receptor. Trends Pharmacol Sci. 1998;19:94–98. doi: 10.1016/s0165-6147(98)01169-9. [DOI] [PubMed] [Google Scholar]
- 4.Walker BM, Valdez GR, McLaughlin JP, Bakalkin G. Targeting dynorphin/kappa opioid receptor systems to treat alcohol abuse and dependence. Alcohol. 2012;46:359–370. doi: 10.1016/j.alcohol.2011.10.006. [DOI] [PMC free article] [PubMed] [Google Scholar]
- 5.Rasakham K, Liu-Chen LY. Sex differences in kappa opioid pharmacology. Life Sci. 2011;88:2–16. doi: 10.1016/j.lfs.2010.10.007. [DOI] [PMC free article] [PubMed] [Google Scholar]
- 6.Chartoff EH, Mavrikaki M. Sex differences in kappa opioid receptor function and their potential impact on addiction. Front Neurosci. 2015;9:466. doi: 10.3389/fnins.2015.00466. [DOI] [PMC free article] [PubMed] [Google Scholar]
- 7.Craft RM. Sex differences in opioid analgesia: “from mouse to man”. Clin J Pain. 2003;19:175–186. doi: 10.1097/00002508-200305000-00005. [DOI] [PubMed] [Google Scholar]
- 8.Fillingim RB, Gear RW. Sex differences in opioid analgesia: clinical and experimental findings. European J Pain. 2004;8:413–425. doi: 10.1016/j.ejpain.2004.01.007. [DOI] [PubMed] [Google Scholar]
- 9.Sershen H, Hashim A, Lajtha A. Gender differences in kappa-opioid modulation of cocaine-induced behavior and NMDA-evoked dopamine release. Brain Res. 1998;801:67–71. doi: 10.1016/s0006-8993(98)00546-0. [DOI] [PubMed] [Google Scholar]
- 10.Cosgrove KP, Carroll ME. Differential effects of bremazocine on oral phencyclidine (PCP) self-administration in male and female rhesus monkeys. Exp Clin Psychopharmacol. 2004;12:111. doi: 10.1037/1064-1297.12.2.111. [DOI] [PubMed] [Google Scholar]
- 11.Pettinati HM, Kampman KM, Lynch KG, Suh JJ, Dackis CA, Oslin DW, O’Brien CP. Gender differences with high-dose naltrexone in patients with co-occurring cocaine and alcohol dependence. J Subst Abuse Treat. 2008;34:378–390. doi: 10.1016/j.jsat.2007.05.011. [DOI] [PMC free article] [PubMed] [Google Scholar]
- 12.Krishnan-Sarin S, Krystal JH, Shi J, Pittman B, O’Malley SS. Family history of alcoholism influences naltrexone-induced reduction in alcohol drinking. Biol Psychiatry. 2007;62:694–697. doi: 10.1016/j.biopsych.2006.11.018. [DOI] [PubMed] [Google Scholar]
- 13.Garbutt JC, Kranzler HR, O’Malley SS, Gastfriend DR, Pettinati HM, Silverman BL, Loewy JW, Ehrich EW, Group VS. Efficacy and tolerability of long-acting injectable naltrexone for alcohol dependence: a randomized controlled trial. JAMA. 2005;293:1617–1625. doi: 10.1001/jama.293.13.1617. [DOI] [PubMed] [Google Scholar]
- 14.Hernandez-Avila CA, Song C, Kuo L, Tennen H, Armeli S, Kranzler HR. Targeted versus daily naltrexone: secondary analysis of effects on average daily drinking. Alcohol Clin Exp Res. 2006;30:860–865. doi: 10.1111/j.1530-0277.2006.00101.x. [DOI] [PubMed] [Google Scholar]
- 15.Greenfield SF, Pettinati HM, O’Malley S, Randall PK, Randall CL. Gender differences in alcohol treatment: an analysis of outcome from the COMBINE study. Alcohol Clin Exp Res. 2010;34:1803–1812. doi: 10.1111/j.1530-0277.2010.01267.x. [DOI] [PMC free article] [PubMed] [Google Scholar]
- 16.Mitch CH, Quimby SJ, Diaz N, Pedregal C, de la Torre MG, Jimenez A, Shi Q, Canada EJ, Kahl SD, Statnick MA, McKinzie DL, Benesh DR, Rash KS, Barth VN. Discovery of aminobenzyloxyarylamides as κ opioid receptor selective antagonists: application to preclinical development of a κ opioid receptor antagonist receptor occupancy tracer. J Med Chem. 2011;54:8000–8012. doi: 10.1021/jm200789r. [DOI] [PubMed] [Google Scholar]
- 17.Zheng MQ, Nabulsi N, Kim SJ, Tomasi G, Lin SF, Mitch C, Quimby S, Barth V, Rash K, Masters J, Navarro A, Seest E, Morris ED, Carson RE, Huang Y. Synthesis and evaluation of 11C-LY2795050 as a κ-opioid receptor antagonist radiotracer for PET imaging. J Nucl Med. 2013;54:455–463. doi: 10.2967/jnumed.112.109512. [DOI] [PMC free article] [PubMed] [Google Scholar]
- 18.Kim SJ, Zheng MQ, Nabulsi N, Labaree D, Ropchan J, Najafzadeh S, Carson RE, Huang Y, Morris ED. Determination of the in vivo selectivity of a new κ-opioid receptor antagonist PET tracer 11C-LY2795050 in the rhesus monkey. J Nucl Med. 2013;54:1668–1674. doi: 10.2967/jnumed.112.118877. [DOI] [PMC free article] [PubMed] [Google Scholar]
- 19.Naganawa M, Zheng MQ, Henry S, Nabulsi N, Lin SF, Ropchan J, Labaree D, Najafzadeh S, Kapinos M, Tauscher J, Neumeister A, Carson RE, Huang Y. Test-Retest Reproducibility of Binding Parameters in Humans with 11C-LY2795050, an Antagonist PET Radiotracer for the κ Opioid Receptor. J Nucl Med. 2015;56:243–248. doi: 10.2967/jnumed.114.147975. [DOI] [PMC free article] [PubMed] [Google Scholar]
- 20.Zubieta JK, Gorelick DA, Stauffer R, Ravert HT, Dannals RF, Frost JJ. Increased mu opioid receptor binding detected by PET in cocaine-dependent men is associated with cocaine craving. Nat Med. 1996;2:1225–1229. doi: 10.1038/nm1196-1225. [DOI] [PubMed] [Google Scholar]
- 21.Zubieta JK, Smith YR, Bueller JA, Xu Y, Kilbourn MR, Jewett DM, Meyer CR, Koeppe RA, Stohler CS. Regional mu opioid receptor regulation of sensory and affective dimensions of pain. Science. 2001;293:311–315. doi: 10.1126/science.1060952. [DOI] [PubMed] [Google Scholar]
- 22.Harris RE, Clauw DJ, Scott DJ, McLean SA, Gracely RH, Zubieta JK. Decreased central μ-opioid receptor availability in fibromyalgia. J Neurosci. 2007;27:10000–10006. doi: 10.1523/JNEUROSCI.2849-07.2007. [DOI] [PMC free article] [PubMed] [Google Scholar]
- 23.Zubieta JK, Dannals RF, Frost JJ. Gender and Age Influences on Human Brain Mu-Opioid Receptor Binding Measured by PET. Am J Psychiatry. 1999;156:842–848. doi: 10.1176/ajp.156.6.842. [DOI] [PubMed] [Google Scholar]
- 24.Naganawa M, Zheng MQ, Nabulsi N, Tomasi G, Henry S, Lin SF, Ropchan J, Labaree D, Tauscher J, Neumeister A, Carson RE, Huang Y. Kinetic modeling of 11C-LY2795050, a novel antagonist radiotracer for PET imaging of the kappa opioid receptor in humans. J Cereb Blood Flow Metab. 2014;34:1818–1825. doi: 10.1038/jcbfm.2014.150. [DOI] [PMC free article] [PubMed] [Google Scholar]
- 25.Carson RE, Barker WC, Liow J, Johnson CA. Design of a motion-compensation OSEM list-mode algorithm for resolution-recovery reconstruction for the HRRT. Nucl Sci Symp Conf Record IEEE. 2003;5:3281–3285. [Google Scholar]
- 26.Muller-Gartner HW, Links JM, Prince JL, Bryan RN, McVeigh E, Leal JP, Davatzikos C, Frost JJ. Measurement of radiotracer concentration in brain gray matter using positron emission tomography: MRI-based correction for partial volume effects. J Cereb Blood Flow Metab. 1992;12:571–583. doi: 10.1038/jcbfm.1992.81. [DOI] [PubMed] [Google Scholar]
- 27.Giovacchini G, Lerner A, Toczek MT, Fraser C, Ma K, DeMar JC, Herscovitch P, Eckelman WC, Rapoport SI, Carson RE. Brain incorporation of 11C-arachidonic acid, blood volume, and blood flow in healthy aging: a study with partial-volume correction. J Nucl Med. 2004;45:1471–1479. [PubMed] [Google Scholar]
- 28.Holmes CJ, Hoge R, Collins L, Woods R, Toga AW, Evans AC. Enhancement of MR images using registration for signal averaging. J Comput Assist Tomogr. 1998;22:324–333. doi: 10.1097/00004728-199803000-00032. [DOI] [PubMed] [Google Scholar]
- 29.Wells WM, Viola P, Atsumi H, Nakajima S, Kikinis R. Multi-modal volume registration by maximization of mutual information. Med Image Anal. 1996;1:35–51. doi: 10.1016/s1361-8415(01)80004-9. [DOI] [PubMed] [Google Scholar]
- 30.Tzourio-Mazoyer N, Landeau B, Papathanassiou D, Crivello F, Etard O, Delcroix N, Mazoyer B, Joliot M. Automated anatomical labeling of activations in SPM using a macroscopic anatomical parcellation of the MNI MRI single-subject brain. Neuroimage. 2002;15:273–289. doi: 10.1006/nimg.2001.0978. [DOI] [PubMed] [Google Scholar]
- 31.Gallezot JD, Nabulsi N, Neumeister A, Planeta-Wilson B, Williams WA, Singhal T, Kim S, Maguire RP, McCarthy T, Frost JJ, Huang Y, Ding YS, Carson RE. Kinetic modeling of the serotonin 5-HT(1B) receptor radioligand [(11)C] P943 in humans. J Cereb Blood Flow Metab. 2010;30:196–210. doi: 10.1038/jcbfm.2009.195. [DOI] [PMC free article] [PubMed] [Google Scholar]
- 32.Innis RB, Cunningham VJ, Delforge J, Fujita M, Gjedde A, Gunn RN, Holden J, Houle S, Huang SC, Ichise M, Iida H, Ito H, Kimura Y, Koeppe RA, Knudsen GM, Knuuti J, Lammertsma AA, Laruelle M, Logan J, Maguire RP, Mintun MA, Morris ED, Parsey R, Price JC, Slifstein M, Sossi V, Suhara T, Votaw JR, Wong DF, Carson RE. Consensus nomenclature for in vivo imaging of reversibly binding radioligands. J Cereb Blood Flow Metab. 2007;27:1533–1539. doi: 10.1038/sj.jcbfm.9600493. [DOI] [PubMed] [Google Scholar]
- 33.Cunningham VJ, Rabiner EA, Slifstein M, Laruelle M, Gunn RN. Measuring drug occupancy in the absence of a reference region: the Lassen plot re-visited. J Cereb Blood Flow Metab. 2010;30:46–50. doi: 10.1038/jcbfm.2009.190. [DOI] [PMC free article] [PubMed] [Google Scholar]
- 34.Woo CW, Krishnan A, Wager TD. Cluster-extent based thresholding in fMRI analyses: pitfalls and recommendations. Neuroimage. 2014;91:412–419. doi: 10.1016/j.neuroimage.2013.12.058. [DOI] [PMC free article] [PubMed] [Google Scholar]
- 35.Gear RW, Miaskowski C, Gordon NC, Paul SM, Heller PH, Levine JD. Action of naloxone on gender-dependent analgesic and antianalgesic effects of nalbuphine in humans. J Pain. 2000;1:122–127. [Google Scholar]
- 36.Gear RW, Gordon NC, Heller PH, Paul S, Miaskowski C, Levine JD. Gender difference in analgesic response to the kappa-opioid pentazocine. Neurosci Lett. 1996;205:207–209. doi: 10.1016/0304-3940(96)12402-2. [DOI] [PubMed] [Google Scholar]
- 37.Gear RW, Miaskowski C, Gordon NC, Paul SM, Heller PH, Levine JD. Kappa-opioids produce significantly greater analgesia in women than in men. Nat Med. 1996;2:1248–1250. doi: 10.1038/nm1196-1248. [DOI] [PubMed] [Google Scholar]
- 38.Gear R, Miaskowski C, Gordon N, Paul S, Heller P, Levine J. Significantly greater analgesia in females compared to males after kappa-opioids. Nat Med. 1996;2:1248–1250. doi: 10.1038/nm1196-1248. [DOI] [PubMed] [Google Scholar]
- 39.Weerts EM, Wand GS, Kuwabara H, Munro CA, Dannals RF, Hilton J, Frost JJ, McCaul ME. Positron Emission Tomography Imaging of Mu-and Delta-Opioid Receptor Binding in Alcohol-Dependent and Healthy Control Subjects. Alcohol Clin Exp Res. 2011;35:2162–2173. doi: 10.1111/j.1530-0277.2011.01565.x. [DOI] [PMC free article] [PubMed] [Google Scholar]