Abstract
Prostate cancer is one of the leading causes of cancer deaths among men, many miRNAs have been demonstrated to play critical role in the progression of prostate cancer, miR-186 suppresses the progression of many tumors, such as bladder cancer and glioma. Previous study shows miR-186 is downregulated in prostate cancer tissues, and is a good prognosis for prostate cancer patients. In this study, we found miR-186 was downregulated in prostate cancer cells and tissues, overexpression of miR-186 inhibited cell proliferation and tumorigenesis in vitro determined by MTT assay, colony formation assay and soft agar growth assay, whereas knockdown of miR-186 reduced these effects. Cell cycle analysis found miR-186 overexpression arrested cell cycle in G0/G1 phase, and reduced p21 and p27 levels, and enhanced Cyclin D1 and the phosphorylation of Rb levels, suggesting miR-186 blocked G1/S transition. A novel oncogene Golgi phhosphoprotein 3 (GOLPH3) was the target of miR-186, miR-186 bound to the 3’UTR of GOLPH3. Moreover, miR-186 was negatively correlated with GOLPH3 in prostate cancer tissues. In conclusion, our study suggested miR-186 inhibited cell proliferation through targeting oncogene GOLPH3.
Keywords: miR-186, GOLPH3, prostate cancer, cell proliferation
Introduction
microRNA (miRNA) inhibits target gene expression by a combination of translational repression and mRNA destabilization, and can serve as a tumor suppressor or an oncogene [1-3].
miR-186 has been demonstrated to play critical role in the progression of many tumors. In non-small cell lung carcinoma (NSCLC), miR-186 is downregulated in NSCLC cells and specimens, it inhibits cell proliferation by directly targeting cell cycle regulatory proteins Cyclin D1, CDK2 and CDK6 [4], other groups find miR-186 also suppresses growth, migration and invasion of NSCLC cells through targeting Rho-associated protein knase 1 (ROCK1) and pituitary tumor transforming gene 1 (PTTG1) [5,6]. miR-186 cooperated with miR-216b, miR-337-3p and miR-760 to induce apoptosis of colorectal cancer cells by inhibiting α subunit of protein kinase CKII [7]. Epithelial-mesenchymal transition (EMT) promoter Twist1 is the target of miR-186 in ovarian cancer, overexpression of miR-186 induces mesenchymal-epithelial transition (MET), arrests cell cycle in G1 phase and enhances apoptosis and chemosensitivity to cisplatin [8]. Long non-coding RNA CRNDE contributes to the cell proliferation, migration, invasion and survival of glioma stem cells through inhibiting miR-186. Mechanism analysis suggests X-linked inhibitor of apoptosis (XIAP) and PAK7 are the targets of miR-186, XIAP can inhibit Caspase 3 activation, PAK7 suppresses BAD and MARK2 to inhibit apoptosis and migration and invasion, respectively. PAK7 also promotes Cyclin D1 to regulate cell cycle progression [9]. In other kinds of tumors, miR-186 can function as an oncogene. miR-186 targets to tumor suppressor gene FOXO1 to promote endometrial tumorigenesis [10]. miR-186 is a poor prognosis factor for patients with pancreatic ductal adenocarcinoma (PDAC), and is overexpressed in PDAC tissues. Functional analysis reveals miR-186 promotes cell proliferation, migration and invasion by targeting nuclear receptor subfamily 5, group A member 2 (NR5A2) [11]. miR-186 promotes hepatocarcinogenesis by targeting tumor suppressor A kinase anchor protein 12 (AKAP12) [12].
Prostate cancer is the second diagnosed cancer in men worldwide, with about 1.1 million new cases in 2012 [13], the current therapy approach couldn’t reduce the death rate of prostate cancer. New therapy methods and targets are essential for prostate cancer diagnosis and treatment. Recently, Kati Erdmann, et al. find miR-186 is downregulated in prostate cancer tissues compared to the normal prostate tissues and benign prostatic hyperplasia, the correlation analysis between miR-186 expression clinicopathologocal parameters suggestes miR-186 expression is negative correlation with T, N and M classification, it may be a good prognosis factor for prostate cancer patients. But the role of miR-186 hasn’t been studied [14].
Here, we determined the expression of miR-186 in prostate cancer cells and tissues, then we upregulated or downregulated miR-186 expression to determine the role of miR-186 in cell proliferation and tumorigenesis in vitro using MTT assay, colony formation assay, cell cycle assay, Ki67 staining assay and soft agar growth assay. We looked for the target of miR-186 and confirmed using luciferase reporter assay, and found miR-186 inhibited cell proliferation of prostate cancer by targeting GOLPH3.
Materials and methods
Cell culture, RNA oligoribonucleotides and transfection
Primary-cultured prostate epithelial cell lines (indicated as N) were maintained in 5% Ham’s F12 (Hyclone) with 5% fetal bovine serum (FBS) (Hyclone), 5 ug/ml insulin, 10 ng/ml epidermal growth factor, 1 ug/ml hydrocortisone (Sigma). Prostate cancer cell lines LNCap, 22RV1, Tsu-Pr1, PC3 and DU145 were obtained from the American Type Culture Collection (ATCC), and were maintained in RPMI-1640 medium supplemented with 10% FBS.
Wild miR-186 mimic, mutational miR-186 mimic, miR-186 inhibitor and their cognate control RNAs (indicated as negative control (NC)) were synthesized by RiBio Co., Ltd. Cells were seeded in six-well plates, and 20 nm oligonucleotides were transfected into indicated prostate cancer cells using riboFECT CP transfection Reagent (RiBio Co., Ltd) when the density of cells up to 50~80%.
Human prostate cancer samples
Eight pairs of prostate cancer tissues (indicated as T) and adjacent normal prostate tissues (indicated as ANT) were collected from Department of Pathology, Guangzhou Red Cross Hospital, Medical College, Jinan University, and were frozen and stored in liquid nitrogen for further use. For the use of these samples for research purposes, prior patient’s written informed consents and approval from the Department of Pathology, Guangzhou Red Cross Hospital, Medical College, Jinan University were obtained.
RNA isolation and real time RT-PCR
Total miRNA from cultured cells and tissues using was extracted using miRNeasy mini Kit (Qiagen), total RNA from cultured cells was extracted using TRIzol (Life Technologies), cDNA was reverse transcribed using SuperScript II Reverse Transcriptase (Invitrogen). Oligo (dT)12-18 was used for genes reverse transcription, specific primer was used for miR-186 reverse transcription, the sequence was shown as follow:
5’TCGTATCCAGTGCAGGGTCCGAGGTATTCGCACTGGATACGACAGCCCA3’. The gene/miRNA expression level was quantified using FastStart Universal SYBR Green Master (Roche) and performed at Applied Biosystems 7300 Sequence Detection System. RUN24 was used as an endogenous control for miRNA date normalization, GAPDH was used as an endogenous control for gene normalization. The sequences were show as follows: miR-618: F: 5’GTCGTATCACAAAGAATTCTCCTTTTT3’, R: 5’GTGCAGGGTCCGAGGT3’. p21: F: 5’CGATGCCAACCTCCTCAACGA3’, R: 5’TCGCAGACCTCCAGCATCCA3’. p27: F: 5’GAGCAATGCGCAGGAATAA3, R: 5’TCCACAGAACCGGCATTT3’. Cyclin D1: F: 5’TCCTCTCCAAAATGCCAGAG3’, R: 5’GGCGGATTGGAAATGAACTT3’. The relative expression of gene and miRNA were calculated using a comparative Ct method.
Western blot assay
Total protein was isolated from using RIPA Lysis buffer (50 mM Tris (pH 7.4), 1 mM EDTA, 150 mM NaCl, 1% NP-40 and 0.5% SDS) supplemented with cocktail (Roche). Western blot assay was performed as previously described [15]. Antibodies used were described as follows: GOLPH3 (sc-242931), p21 (sc-397), p27 (sc-528), Cyclin D1 (sc-450), Rb (sc-50) and p-Rb (sc-16670). The membranes were stripped and re-probed with anti-α-Tubulin (sc-5286) antibody as the loading control. These antibodies were purchased from Santa Cruz Biotechnology.
Cell proliferation assay
MTT assay was performed according to the standard method [16]. For colony formation assay, cells were plated in 6-well plates at a density of 500 cells every well and transfected miR-186 mimic or miR-186 inhibitor. Then cells were maintained in RPIM-1640 containing 10% FBS for 10 days. Colonies were fixed using methanol, stained with 0.1% crystal violet for 10 min, and photographed.
Soft agar growth assay
Soft afar growth assay was performed according to the previous method [16]. Briefly, 500 cells were suspended in 2 ml complete medium with 0.3% agar (Sigma), plated on top of a bottom layer with 1% complete medium agar mixture. 10 days later, viable colonies which contained more than 50 cells or were larger than 0.1 mm were counted. Colony size was determined using an ocular micrometer, colonies greater than 0.1 mm in diameter were counted.
Cell cycle assay
Cells were trypsinized and washed with cold PBS followed by fixation in 70% ethanol for overnight at 4°C. After washing with cold PBS three times, cells were resuspended in 800 ul PBS with propidium iodide (PI, Sigma) at a density of 50 ug/ml and RNase A (Sangon Biotech) at a density of 100 unit/ml for 30 min at 37°C. Cells were analyzed for DNA content using a FACSCalibur cytometer (BD).
Ki67 staining assay
Cells transfected with miR-186 mimic or miR-186 inhibitor were seeded the cover glass placed in 6-well plates, when the density of cells was up to 60%, cells washed with cold PBS three times followed by fixation in 4% polyformaldehyde for 15 min, and washed with cold PBS three times. Cells were permeated using 0.5% Triton X-100 for 20 min at room temperature, and were washed with cold PBS three times. Then cells were blocked with 1% BSA for 30 min and discarded. Cells were incubated with anti-Ki67 antibody (1:200, ab15580, Abcam) for overnight at 4°C and washed with PBST three times, followed by incubating at room temperature for 1 h with a Goat Anti-Rabbit IgG H&L (Alexa fluor 568) (1:1000, ab175471, Abcam). Cells were washed with cold PBST three times. Nuclear DNA was labeled in blue with DAPI. Cells were photographed using Axio Imager Z2 (Carl Zeiss Corporation).
Luciferase reporter assay
The 3’-UTR sequence of GOLPH3 containing the binding site of miR-186 was cloned into the psiCHECK-2 vector (GOLPH3-3’UTR). Cells which were seeded in triplicate in 24-well plates at 60% confluence were cotransfected psiCHECK-2-GOLPH3-3’UTR with miR-186 mimic, miR-186 inhibitor or mutational miR-186 mimic using lipofectamine 2000 (Invitrogen), luciferase activities were investigated after 48 h by Dua-Luciferase Reporter Assay System (Promega) according to the manufacturer’s instruction.
Statistical analysis
All experiments were carried out in triplicate. GraphPad Prism 6 (GraphPad Software, Inc.) was used for analysis the data. Results are presented as the mean ± standard deviation (STDEV) for three repeated individual experiments for each group. Statistical differences were analyzed by using student’s t-test (two-paired) and One-way analysis of variance (ANOVA) for independent samples. A P-value < 0.05 was considered statistically significant.
Results
miR-186 is downregulated in prostate cancer cells and tissues
We found miR-186 was significantly downregulated in prostate cancer cells compared to the normal prostate epithelial cells (Figure 1A). miR-186 was also downregulated in primary prostate cancer tissues compared to the adjacent normal prostate tissues (Figure 1B). Together, miR-186 was downregulated in prostate cancer cells and tissues, and might inhibit prostate cancer progression.
Figure 1.
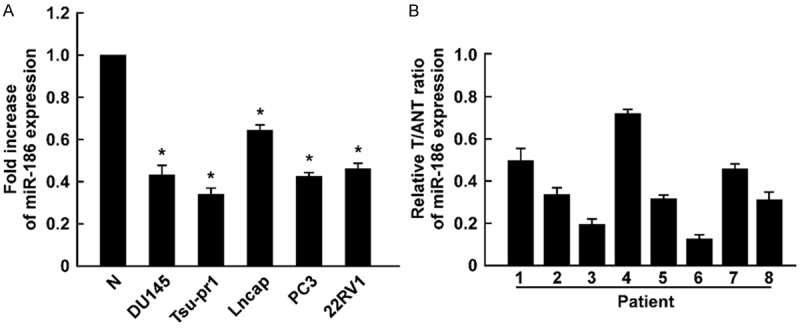
miR-186 is downregulated in prostate cancer cells and tissues. A. Real time RT-PCR determined miR-186 expression in prostate cancer cells and primary-cultured prostate epithelial cells. B. Real time RT-PCR determined miR-186 expression in prostate cancer tissues (T) and adjacent normal prostate tissues (ANT). Error bars represent ± S.D. *P < 0.05.
miR-186 overexpression inhibits cell proliferation of prostate cancer
To elucidate the role of miR-186 in the proliferation of prostate cancer, we overexpressed miR-186 in prostate cancer cells DU145 and PC3. MTT assay found overexpression of miR-186 decreased cell proliferation rate (Figure 2A), colony formation assay showed miR-186 overexpression suppressed cell proliferation (Figure 2B). Soft agar growth assay revealed miR-186 overexpression suppressed tumorigenesis in vitro, as shown by decreased colony numbers and sizes (Figure 2C). We further examined whether miR-186 overexpression suppressed cell proliferation using cell cycle assay and cell proliferation marker Ki67 staining assay. Cell cycle assay suggested overexpression of miR-186 was associated with a decrease of the cell population in S phase and an increase of the cell population in G1 phase in indicated cells (Figure 3A). Ki67 staining assay suggested the number of Ki67 positive cells were significantly decreased when miR-186 was overexpressed (Figure 3B). Taken together, miR-186 overexpression inhibited cell proliferation.
Figure 2.
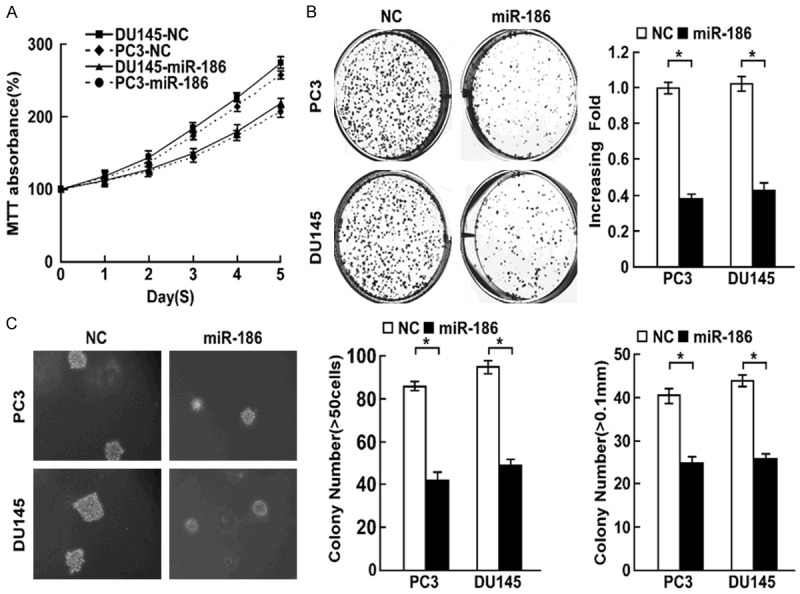
Overexpression of miR-186 inhibits cell proliferation. A. MTT determined the effect of miR-186 overexpression on cell proliferation in prostate cancer cells PC3 and DU145. B. Colony formation assay determined the role of miR-186 in cell proliferation in indicated cells with miR-186 overexpression. C. Soft agar growth assay determined the effect of miR-186 overexpression on tumorigenesis in vitro. Error bars represent ± S.D. *P < 0.05.
Figure 3.
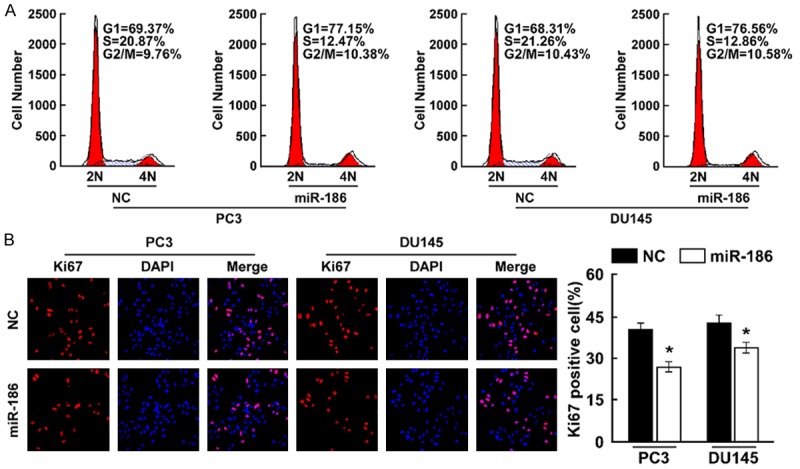
Overexpression of miR-186 inhibits cell proliferation. A. Cell cycle assay determined the role of miR-186 in cell cycle progression by overexpressing miR-186. B. Ki67 staining assay determined the effect of miR-186 overexpression on cell proliferation. Error bars represent ± S.D. *P < 0.05.
miR-186 knockdown promotes cell proliferation of prostate cancer
To confirm that miR-186 contributes to the cell proliferation, we downregulated miR-186 level in prostate cancer cells PC3 and DU145. MTT assay found knockdown of miR-186 increased cell proliferation rate (Figure 4A), colony formation assay found knockdown of miR-186 significantly promoted cell proliferation (Figure 4B). Soft agar growth assay revealed that knockdown of miR-186 promoted tumorigenesis in vitro, as shown by increased colony numbers and sizes (Figure 4C). Cell cycle assay suggesting knockdown of miR-186 was associated with a decrease of the cell population in G1 phase and an increase of the cell population in S phase in indicated cells (Figure 5A). Ki67 staining assay suggested the number of Ki67 positive cells were significantly increased when miR-186 was downregulated (Figure 5B). These results suggested miR-186 knockdown promoted cell proliferation.
Figure 4.
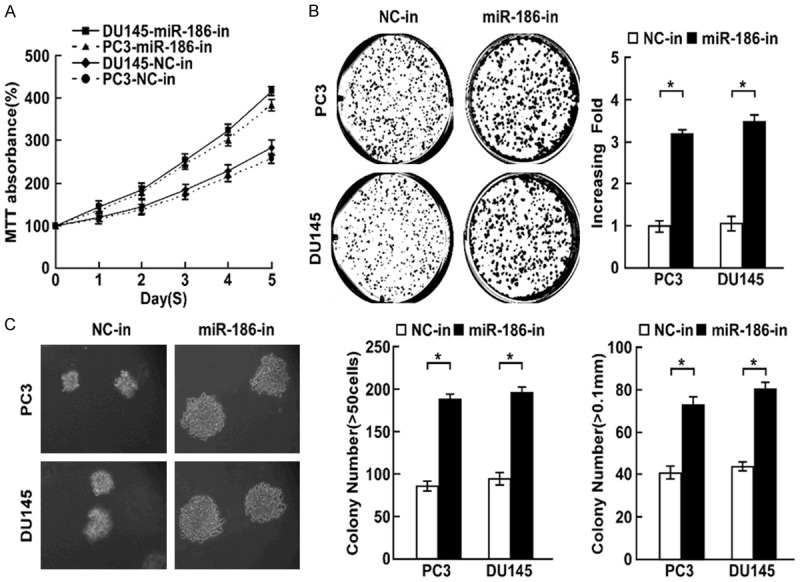
Knockdown of miR-186 promotes cell proliferation. A. MTT determined the effect of miR-186 knockdown on cell proliferation in prostate cancer cells PC3 and DU145. B. Colony formation assay determined the role of miR-186 in cell proliferation in indicated cells with miR-186 knockdown. C. Soft agar growth assay determined the effect of miR-186 knockdown on tumorgenesis in vitro. Error bars represent ± S.D. *P < 0.05.
Figure 5.
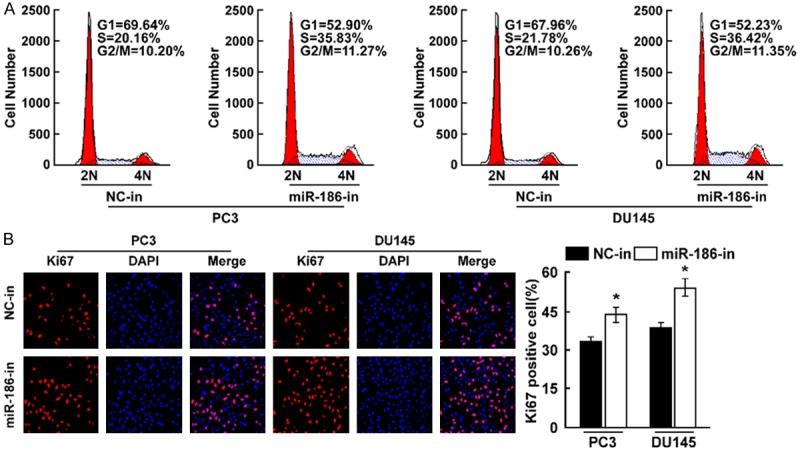
Knockdown of miR-186 inhibits cell proliferation. A. Cell cycle assay determined the role of miR-186 in cell cycle progression by downregulating miR-186. B. Ki67 staining assay determined the effect of miR-186 knockdown on cell proliferation. Error bars represent ± S.D. *P < 0.05.
miR-186 regulates the cell cycle regulatory proteins involved in G1/S transition
We found overexpression of miR-186 decreased the cell population of S phase, and increased the cell population of G1 phase, whereas miR-186 knockdown reduced this effect, suggesting miR-186 regulated G1/S transition. So we determined whether miR-186 regulates cell cycle proteins which regulate G1/S transition. Overexpression of miR-186 increased p21 and p27 expression, but decreased Cyclin D1 expression in both mRNA and protein levels. Knockdown of miR-186 decreased p21 and p27 expression, but increased Cyclin D1 expression (Figure 6A and 6B). Rb is a tumor suppressor, it binds to E2F family proteins, and inhibits the activity of E2Fs, E2Fs promote the expression of genes about G1/S transition, such as CDC2, Cyclin E, Cyclin A and thymidine kinase. The phosphorylation of Rb disrupts its interaction with E2Fs, and releases activity of E2Fs to promote G1/S transition [17]. We found knockdown of miR-186 increased the phosporylation level of Rb, overexpression of miR-186 decreased the phosporylation level of Rb (Figure 6B). These results suggested miR-186 regulated the cell cycle regulatory proteins involved in G1/S transition.
Figure 6.
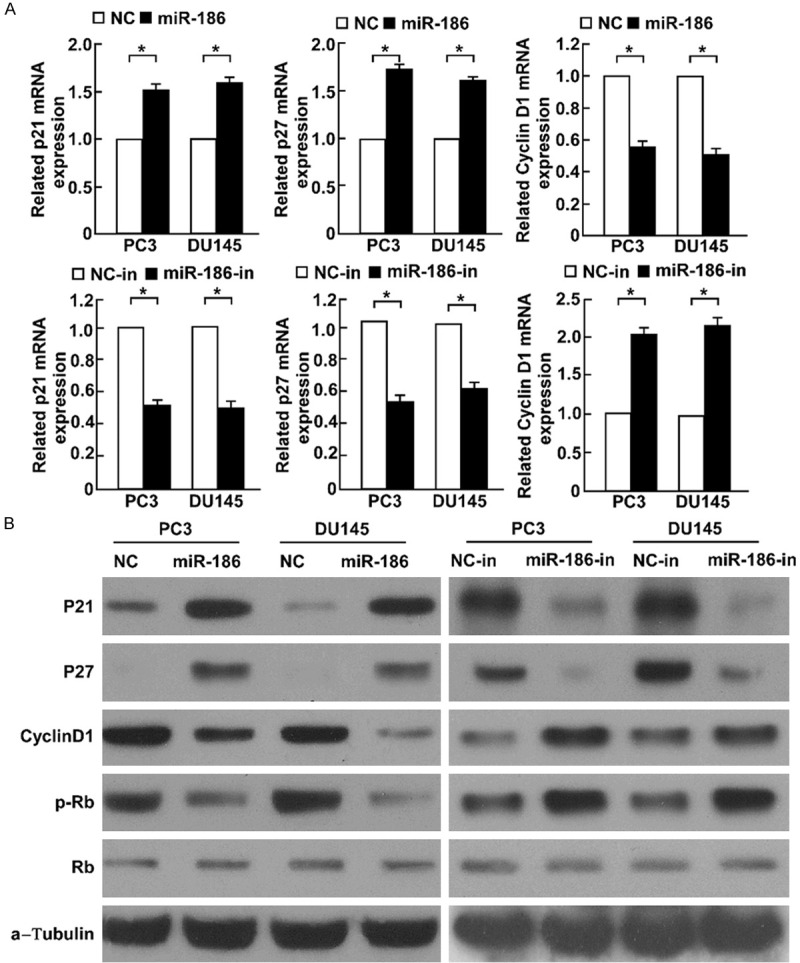
miR-186 regulates cell cycle regulatory proteins about G1/S transition. A. Real time RT-PCR determined p21, p27 and Cyclin D1 in PC3 and DU145 with miR-186 overexpression of knockdown. B. Western blot determined p21, p27, Cyclin D1, Rb and p-Rb level in indicated cells with miR-186 overexpression of knockdown. α-Tubulin was used as the lading control. Error bars represent ± S.D. *P < 0.05.
GOLPH3 is the target of miR-186
miRNAs mediate target mRNA degradation and/or inhibit translation. We used TargetScan and miRanda to predict the target of miR-186, and found GOLPH3 that is a novel oncogene was the target of miR-186 (Figure 7A). Western blot assay showed overexpression of miR-186 decreased GOLPH3 expression, knockdown of miR-186 increased GOLPH3 expression (Figure 7B and 7C). To examine whether miR-186 directly binds to the 3’UTR of GOLPH3, we subcloned the sequence of 3’UTR of GOLPH3 into psiCHECK™-2 vector, and cotransfected with miR-186 mimic, mutational miR-186 mimic or miR-186 inhibitor into indicated prostate cancer cell. Luciferase report assay suggested luciferase activity was reduced when psiCHECK-2-GOLPH3-3’UTR was cotransfected with wild miR-186 mimic in a dose manner, luciferase activity was increased when psiCHECK-2-GOLPH3-3’UTR was cotransfected with miR-186 inhibitor in a dose manner, but the luciferase activity wasn’t changed when psiCHECK-2-GOLPH3-3’UTR was cotransfected with mutational miR-186 mimic (Figure 7D). These results showed GOLPH3 is the target of miR-186.
Figure 7.
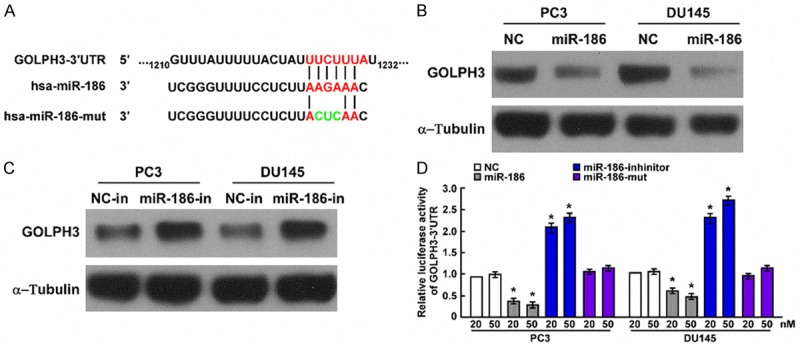
GOLPH3 is the target of miR-186. A. Predicted binding of miR-186 to the 3’UTR of GOLPH3. B. Western blot determined GOLPH3 expression after miR-186 was overexpressed. α-Tubulin was used as the lading control. C. Western blot determined GOLPH3 expression after miR-186 was downregulated. α-Tubulin was used as the loading control. D. Luciferase activity of GOLPH3-3’UTR reporter in indicated cells cotransfected miR-186 mimic, miR-186 inhibitor and mutational miR-186 mimic.
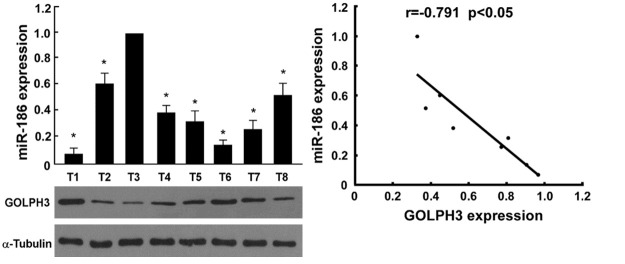
We also analyzed the relationship between miR-186 levels and GOLPH3 expression in prostate cancer tissues, and found that there was a negative correlation between miR-186 levels and GOLPH3 expression in prostate cancer tissues (Figure 8).
Figure 8.
miR-186 levels were negatively correlation with GOLPH3 expression in prostate cancer tissues. Western blot was used to determine GOLPH3 expression in prostate cancer tissues, α-Tubulin was used as the loading control. Real time RT-PCR was used to determine miR-186 expression in prostate cancer tissues.
Discussion
In present study, we found miR-186 was downregulated in prostate cancer cells and tissues, miR-186 overexpression suppressed anchorage-dependent and -independent growth, miR-186 knockdown promoted anchorage-dependent and -independent growth. Cell cycle assay found overexpression of miR-186 arrested cell cycle in G0/G1 phase, suggesting miR-186 inhibited G1/S transition, when miR-186 was downregulated, cell cycle inhibitors p21 and p27 were significantly downregulated, Cyclin D1 and phosphorylation of Rb levels were upregulated. Knockdown of miR-186 reduced these effects. Ki67 is a marker for cell proliferation [18], Ki67 staining assay showed that Ki67 level was significantly reduced, once miR-186 overexpression, confirming miR-186 regulated cell proliferation by regulation G1/S transition.
GOLPH3 is the target of miR-186 predicted by software online, miR-186 level was negative correlation with GOLPH3 level, luciferase reporter assay found miR-186 directly bound to the 3’UTR of GOLPH3, mutation in the seed site of miR-186 abrogated the interaction. GOLPH3 is a novel oncogene, its copy number is amplified in many tumors, such as lung cancer, ovarian cancer, breast cancer, prostate cancer and melanoma, it regulates cell size and enhances mTOR signaling [19]. GOLPH3 also regulates NF-κB signaling, it enhances the expression of TRAF2, RIP and NEMO to sustain the activation of NF-κB in hepatocellular carcinoma (HCC) and promotes HCC aggressiveness [20].
Recently, many groups find GOLPH3 not only promotes the progression of various tumors, but also function as a prognosis of poor outcome. For example, GOLPH3 is an independent prognosis factor for gastric cancer [21], epithelial ovarian cancer [22], NSCLC [23], renal cell carcinoma [24], breast cancer [25], esophageal squamous cell carcinoma [26] and glioblastoma multiforme [27]. Hong Shen group finds GOLPH3 is upregulated in hormone-dependent prostate cancer tissues and castration resistant prostate cancer tissues, moderate/intense GOLPH3 level is positively correlated with androgen independence, higher Gleason score, bone metastasis, higher baseline prostate-specific antigen (PSA) and higher PSA nadir. Patients with moderate/intense GOLPH3 level have poor disease-free survival and overall survival. GOLPH3 is also a worse prognosis factor for prostate cancer patients [28]. Wenzhi Li et al. find GOLPH3 is overexpressed in prostate cancer cells, knockdown of GOLPH3 inhibits cell proliferation by activating p21 expression and suppressing CDK1/2 and Cyclin B1 expression and the phosphorylation of AKT and mTOR [29]. We also determined whether miR-186 inhibits prostate cancer cell proliferation by inhibiting GOLPH3, double knockdown of miR-186 and GOLPH3 promoted cell proliferation (data not shown).
In summary, we found miR-186 contributes to the proliferation of prostate cancer through directly target to GOLPH3.
Acknowledgements
This work was funded by National natural science foundation of China (No. 81272849, 81472319) and the Natural science foundation of Guangdong province (No. 2014A030313680, 2014A030313325), Guangdong medical scientific research fund (No. A2015309) and Medical and health science and technology project of Guangzhou (No. 20151A011012).
Disclosure of conflict of interest
None.
Authors’ contribution
LNY and XH conceived and designed the experiments; XH, YX, WHP, MYL, XXH, ZXL and QX performed the experiments; HX, YX, WHP and MYL analyzed the data; ZXL and QXcontributed reagents/materials/analysis tools; LNY and XH wrote the paper.
References
- 1.Pichler M, Calin GA. MicroRNAs in cancer: from developmental genes in worms to their clinical application in patients. Br J Cancer. 2015;113:569–573. doi: 10.1038/bjc.2015.253. [DOI] [PMC free article] [PubMed] [Google Scholar]
- 2.Zhao Z, Li S, Song E, Liu S. The roles of ncRNAs and histone-modifiers in regulating breast cancer stem cells. Protein Cell. 2016;7:89–99. doi: 10.1007/s13238-015-0199-4. [DOI] [PMC free article] [PubMed] [Google Scholar]
- 3.Jasinski-Bergner S, Mandelboim O, Seliger B. The role of microRNAs in the control of innate immune response in cancer. J Natl Cancer Inst. 2014;106 doi: 10.1093/jnci/dju257. [DOI] [PubMed] [Google Scholar]
- 4.Cai J, Wu J, Zhang H, Fang L, Huang Y, Yang Y, Zhu X, Li R, Li M. miR-186 downregulation correlates with poor survival in lung adenocarcinoma, where it interferes with cell-cycle regulation. Cancer Res. 2013;73:756–766. doi: 10.1158/0008-5472.CAN-12-2651. [DOI] [PubMed] [Google Scholar]
- 5.Cui G, Cui M, Li Y, Liang Y, Li W, Guo H, Zhao S. MiR-186 targets ROCK1 to suppress the growth and metastasis of NSCLC cells. Tumour Biol. 2014;35:8933–8937. doi: 10.1007/s13277-014-2168-6. [DOI] [PubMed] [Google Scholar]
- 6.Li H, Yin C, Zhang B, Sun Y, Shi L, Liu N, Liang S, Lu S, Liu Y, Zhang J, Li F, Li W, Liu F, Sun L, Qi Y. PTTG1 promotes migration and invasion of human non-small cell lung cancer cells and is modulated by miR-186. Carcinogenesis. 2013;34:2145–2155. doi: 10.1093/carcin/bgt158. [DOI] [PubMed] [Google Scholar]
- 7.Kim SY, Lee YH, Bae YS. MiR-186, miR-216b, miR-337-3p, and miR-760 cooperatively induce cellular senescence by targeting alpha subunit of protein kinase CKII in human colorectal cancer cells. Biochem Biophys Res Commun. 2012;429:173–179. doi: 10.1016/j.bbrc.2012.10.117. [DOI] [PubMed] [Google Scholar]
- 8.Zhu X, Shen H, Yin X, Long L, Xie C, Liu Y, Hui L, Lin X, Fang Y, Cao Y, Xu Y, Li M, Xu W, Li Y. miR-186 regulation of Twist1 and ovarian cancer sensitivity to cisplatin. Oncogene. 2016;35:323–32. doi: 10.1038/onc.2015.84. [DOI] [PubMed] [Google Scholar]
- 9.Zheng J, Li XD, Wang P, Liu XB, Xue YX, Hu Y, Li Z, Li ZQ, Wang ZH, Liu YH. CRNDE affects the malignant biological characteristics of human glioma stem cells by negatively regulating miR-186. Oncotarget. 2015;6:25339–25355. doi: 10.18632/oncotarget.4509. [DOI] [PMC free article] [PubMed] [Google Scholar]
- 10.Myatt SS, Wang J, Monteiro LJ, Christian M, Ho KK, Fusi L, Dina RE, Brosens JJ, Ghaem-Maghami S, Lam EW. Definition of microRNAs that repress expression of the tumor suppressor gene FOXO1 in endometrial cancer. Cancer Res. 2010;70:367–377. doi: 10.1158/0008-5472.CAN-09-1891. [DOI] [PMC free article] [PubMed] [Google Scholar]
- 11.Zhang ZL, Bai ZH, Wang XB, Bai L, Miao F, Pei HH. miR-186 and 326 predict the prognosis of pancreatic ductal adenocarcinoma and affect the proliferation and migration of cancer cells. PLoS One. 2015;10:e0118814. doi: 10.1371/journal.pone.0118814. [DOI] [PMC free article] [PubMed] [Google Scholar]
- 12.Goeppert B, Schmezer P, Dutruel C, Oakes C, Renner M, Breinig M, Warth A, Vogel MN, Mittelbronn M, Mehrabi A, Gdynia G, Penzel R, Longerich T, Breuhahn K, Popanda O, Plass C, Schirmacher P, Kern MA. Down-regulation of tumor suppressor A kinase anchor protein 12 in human hepatocarcinogenesis by epigenetic mechanisms. Hepatology. 2010;52:2023–2033. doi: 10.1002/hep.23939. [DOI] [PubMed] [Google Scholar]
- 13.Torre LA, Bray F, Siegel RL, Ferlay J, Lortet-Tieulent J, Jemal A. Global cancer statistics, 2012. CA Cancer J Clin. 2015;65:87–108. doi: 10.3322/caac.21262. [DOI] [PubMed] [Google Scholar]
- 14.Erdmann K, Kaulke K, Thomae C, Huebner D, Sergon M, Froehner M, Wirth MP, Fuessel S. Elevated expression of prostate cancer-associated genes is linked to down-regulation of microRNAs. BMC Cancer. 2014;14:82. doi: 10.1186/1471-2407-14-82. [DOI] [PMC free article] [PubMed] [Google Scholar]
- 15.lyu Z, Mao Z, Wang H, Fang Y, Chen T, Wan Q, Wang M, Wang N, Xiao J, Wei H, Li X, Liu Y, Zhou Q. MiR-181b targets Six2 and inhibits the proliferation of metanephric mesenchymal cells in vitro. Biochem Biophys Res Commun. 2013;440:495–501. doi: 10.1016/j.bbrc.2013.09.059. [DOI] [PubMed] [Google Scholar]
- 16.Lin H, Dai T, Xiong H, Zhao X, Chen X, Yu C, Li J, Wang X, Song L. Unregulated miR-96 induces cell proliferation in human breast cancer by downregulating transcriptional factor FOXO3a. PLoS One. 2010;5:e15797. doi: 10.1371/journal.pone.0015797. [DOI] [PMC free article] [PubMed] [Google Scholar]
- 17.Massague J. G1 cell-cycle control and cancer. Nature. 2004;432:298–306. doi: 10.1038/nature03094. [DOI] [PubMed] [Google Scholar]
- 18.Li LT, Jiang G, Chen Q, Zheng JN. Ki67 is a promising molecular target in the diagnosis of cancer (review) Mol Med Rep. 2015;11:1566–1572. doi: 10.3892/mmr.2014.2914. [DOI] [PubMed] [Google Scholar]
- 19.Scott KL, Kabbarah O, Liang MC, Ivanova E, Anagnostou V, Wu J, Dhakal S, Wu M, Chen S, Feinberg T, Huang J, Saci A, Widlund HR, Fisher DE, Xiao Y, Rimm DL, Protopopov A, Wong KK, Chin L. GOLPH3 modulates mTOR signalling and rapamycin sensitivity in cancer. Nature. 2009;459:1085–1090. doi: 10.1038/nature08109. [DOI] [PMC free article] [PubMed] [Google Scholar]
- 20.Dai T, Zhang D, Cai M, Wang C, Wu Z, Ying Z, Wu J, Li M, Xie D, Li J, Song L. Golgi phosphoprotein 3 (GOLPH3) promotes hepatocellular carcinoma cell aggressiveness by activating the NF-kappaB pathway. J Pathol. 2015;235:490–501. doi: 10.1002/path.4479. [DOI] [PubMed] [Google Scholar]
- 21.Hu BS, Hu H, Zhu CY, Gu YL, Li JP. Overexpression of GOLPH3 is associated with poor clinical outcome in gastric cancer. Tumour Biol. 2013;34:515–520. doi: 10.1007/s13277-012-0576-z. [DOI] [PubMed] [Google Scholar]
- 22.Ma Y, Wang X, Wu Y, Sun B, Lv H, Rong F, Zheng X. Overexpression of GOLPH3 protein is associated with worse prognosis in patients with epithelial ovarian cancer. Tumour Biol. 2014;35:11845–11849. doi: 10.1007/s13277-014-2411-1. [DOI] [PubMed] [Google Scholar]
- 23.Zhang Y, Ma M, Han B. GOLPH3 high expression predicts poor prognosis in patients with resected non-small cell lung cancer: an immunohistochemical analysis. Tumour Biol. 2014;35:10833–10839. doi: 10.1007/s13277-014-2357-3. [DOI] [PubMed] [Google Scholar]
- 24.Xue Y, Wu G, Liao Y, Xiao G, Ma X, Zou X, Zhang G, Xiao R, Wang X, Liu Q, Long D, Yang J, Xu H, Liu F, Liu M, Xie K, Huang R. GOLPH3 is a novel marker of poor prognosis and a potential therapeutic target in human renal cell carcinoma. Br J Cancer. 2014;110:2250–2260. doi: 10.1038/bjc.2014.124. [DOI] [PMC free article] [PubMed] [Google Scholar]
- 25.Zeng Z, Lin H, Zhao X, Liu G, Wang X, Xu R, Chen K, Li J, Song L. Overexpression of GOLPH3 promotes proliferation and tumorigenicity in breast cancer via suppression of the FOXO1 transcription factor. Clin Cancer Res. 2012;18:4059–4069. doi: 10.1158/1078-0432.CCR-11-3156. [DOI] [PubMed] [Google Scholar]
- 26.Wang JH, Chen XT, Wen ZS, Zheng M, Deng JM, Wang MZ, Lin HX, Chen K, Li J, Yun JP, Luo RZ, Song LB. High expression of GOLPH3 in esophageal squamous cell carcinoma correlates with poor prognosis. PLoS One. 2012;7:e45622. doi: 10.1371/journal.pone.0045622. [DOI] [PMC free article] [PubMed] [Google Scholar]
- 27.Zhou J, Xu T, Qin R, Yan Y, Chen C, Chen Y, Yu H, Xia C, Lu Y, Ding X, Wang Y, Cai X, Chen J. Overexpression of Golgi phosphoprotein-3 (GOLPH3) in glioblastoma multiforme is associated with worse prognosis. J Neurooncol. 2012;110:195–203. doi: 10.1007/s11060-012-0970-9. [DOI] [PubMed] [Google Scholar]
- 28.Hua X, Yu L, Pan W, Huang X, Liao Z, Xian Q, Fang L, Shen H. Increased expression of Golgi phosphoprotein-3 is associated with tumor aggressiveness and poor prognosis of prostate cancer. Diagn Pathol. 2012;7:127. doi: 10.1186/1746-1596-7-127. [DOI] [PMC free article] [PubMed] [Google Scholar]
- 29.Li W, Guo F, Gu M, Wang G, He X, Zhou J, Peng Y, Wang Z, Wang X. Increased Expression of GOLPH3 is Associated with the Proliferation of Prostate Cancer. J Cancer. 2015;6:420–429. doi: 10.7150/jca.11228. [DOI] [PMC free article] [PubMed] [Google Scholar]


