Abstract
The effect of silver on the phase transition and microstructure of titanium oxide films grown by pulsed cathodic arc had been investigated by XRD, SEM and Raman spectroscopy. Following successive thermal annealing up to 1000 °C, microstructural analysis of annealed Ag-TiO2 films reveals that the incorporation of Ag nanoparticles strongly affects the transition temperature from the initial metastable amorphous phase to anatase and stable rutile phase. An increase of silver content into TiO2 matrix inhibits the amorphous to anatase phase transition, raising its temperature boundary and, simultaneously reduces the transition temperature to promote rutile structure at lower value of 600 °C. The results are interpreted in terms of the steric effects produced by agglomeration of Ag atoms into larger clusters following annealing which hinders diffusion of Ti and O ions for anatase formation and constrains the volume available for the anatase lattice, thus disrupting its structure to form rutile phase. The effect of silver on the optical and wetting properties of TiO2 was evaluated to demonstrate its improved photocatalytic performance.
Titanium dioxide is a polymorphous compound with a broad range of applications in catalysis and photocatalysis, gas sensors, energy storage, self-cleaning devices, optical and corrosion protective coatings1. These applications are dependent on the crystallographic structure, morphology and physical properties of the different phases of titania. As a bulk material, it can exhibit anatase, rutile and brookite forms while TiO2 thin films only show amorphous, anatase or rutile structures. Brookite thin films can only be achieved by chemical deposition techniques2,3 at high deposition or annealing temperatures4.
Different chemical routes have been used to synthesize bulk titania. Sol-gel5, hydrothermal techniques6, spray pyrolysis and chemical vapour deposition allow to synthesize anatase powders at low temperatures7,8, while rutile phase can be obtained after annealing treatments at temperatures around 900 °C9. In TiO2 powders, the transition temperature is determined by grain size, deposition techniques and process conditions such as thermal annealing10. In some applications, for instance optical coatings, the fabrication of rutile at lower temperatures is of paramount importance, since rutile is thermodynamically the most stable phase of titania, giving the highest refractive index and hardness11,12. Nowadays, there are many reports on the structural and morphological properties of the anatase-rutile (A-R) transformation upon annealing treatments, showing either pure or mixed rutile phase at temperatures above 800 °C13,14,15.
To promote the A-R transition at lower temperatures for bulk titania, many dopants have been proposed, thus expanding its range of applications. For instance, V-doped TiO2 powders show the promotion of rutile phase at 700 °C, with an improvement of their ferromagnetic characteristics16. Besides, Ni- and Ru-doped TiO2 systems also show rutile phase at 700 °C having larger grain size17. In addition, other dopant promoters such as Co, Cr, Cu, Na, Ni, Sn, Al and Zn have been studied in the past12. In these earlier studies, silver (Ag) has been theoretically predicted as a cation promoter for the A-R transition in bulk titania, although no systematic work has been reported.
Recently, the thin film properties of TiO2 have been thoroughly investigated, because it can be used for photocatalytic applications, as hydrophobic coating for optical glass and antireflection coating in solar cells. In addition, Ag-doped TiO2 films are well known for their antibacterial properties18. However, the influence of silver on the phase transition and other physical properties of the films is not well documented, and only a few studies have been reported on the evolution of the phases of TiO2 films grown by chemical methods such as sol-gel containing low Ag concentrations19,20,21. These works show either a mixture of TiO2 phases or no evidence of the rutile phase after thermal annealing at temperatures up to 700 °C21,22,23,24. In contrast, while physical deposition techniques are used such as sputtering25, pulsed laser26 and cathodic arc27, the influence of silver on the transition temperature from anatase to rutile of TiO2 films has not been fully investigated23,28.
It is evident that the tailoring of crystalline phases of TiO2 matrix would optimise their device performance by enhancing the catalytic properties, refractive index profile and bio-activity of the selected phase of interest29,30,31,32. It is also desirable to achieve denser rutile films at temperatures compatible with non-high temperature resistant substrates, having superior mechanical, optical and charge transport properties33,34. In a recent work, we have evaluated the effect of incorporating silver into TiO2 films using X-Ray Absorption Near Structure (XANES)35. The results had demonstrated, for the first time to the best of our knowledge, the dominant effect of silver on the phase transition from amorphous state to anatase and rutile.
The main purpose of this work is to investigate the underlying physical mechanisms of the anatase to rutile phase transformation phenomenon further and determine the effect of incorporating Ag nanopaticles into TiO2 thin films systematically. The phase property and surface morphology of TiO2 films have been studied by tailoring the addition of Ag content into TiO2 matrix followed by successive thermal treatments up to 1000 °C to identify the boundary of amorphous to anatase transition, and similarly the possibility of inducing anatase to rutile transition at lower annealing temperature. In addition, the wetting properties and optical spectral response of TiO2 thin films have been assessed to study the influence of Ag incorporation onto their photocatalytic performance and optical transmittance.
Results
Raman Analysis
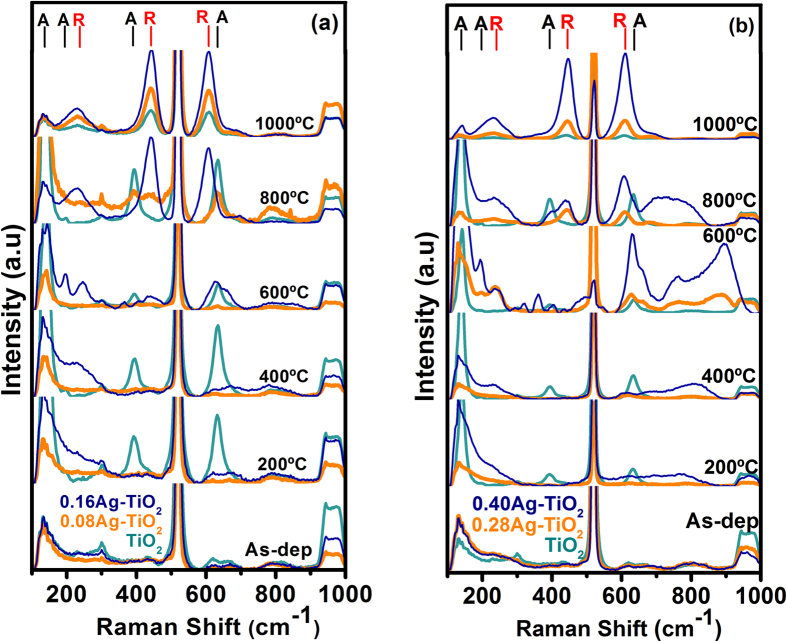
It is well-known that Raman spectroscopy is a powerful tool to detect the vibrational modes of chemical bonds and can identify the distinct crystalline state of materials accurately. In this work, we have employed this technique to investigate the effect of silver on the microstructural properties of TiO2 films after thermal annealing. The Raman spectra, as shown in Fig. 1, indicate that the as-deposited samples are non-crystalline in nature, since no characteristic bands of TiO2 are detected. The strong band located at 520 cm−1 corresponds to the LO-phonon line of the silicon substrate as well as to the associated noise as expected.
Figure 1.
Raman spectra of the Ag-TiO2 films as a function of annealing temperature with silver concentration as: (a) 0.08–0.16Ag and (b) 0.28–0.40Ag. The pure TiO2 Raman spectrum is inserted in both graphs as reference. Anatase and Rutile bands are labelled as A and R respectively.
The evolution of spectra from pure TiO2 films following annealing, Fig. 1a, reveals three bands located at 144, 395 and 638 cm−1 at 200 °C that are characteristic Eg (Low-Frequency, LF), B1g, and Eg (High-Frequency, HF) phonon modes of anatase36,37 respectively. With an increase of the annealing temperature above 200 °C, the anatase vibrational modes became more intense until a new prominent band develops at 1000 °C, representing characteristic of vibration modes of rutile phase38. At this high temperature other rutile bands, 442 and 608 cm−1 which are associated with the Eg and A1g phonon modes were also observed along with an additional band arising from two phonon scattering vibrations located at 235 cm−1.
As for the Ag-TiO2 nanocomposite films, the vibrational modes corresponding to the anatase start to form at 400 °C for the samples with lowest Ag content (0.08Ag-TiO2), whereas weaker B1g, and Eg (HF) modes of anatase tend to develop at 600 °C (Fig. 1a). Even with an increase of temperature up to 800 °C, these bands still remain weak in intensity. In addition, the Eg rutile vibration starts to appear at this higher temperature, which is fully developed at 1000 °C, accompanied by the evolution of the other two intense vibrational rutile modes.
For the 0.16Ag-TiO2 samples, Fig. 1a, the vibrational anatase modes are detected at and above 600 °C, with a new band centred at 198 cm−1 corresponding to the Eg vibration phonon mode, while the other fundamental vibrational modes of anatase are very weak. The band located at 245 cm−1, which is related to the double phonon scattering as stated above, indicates the anharmonicity of the emerging rutile phase36. Further annealing at 800 °C produces a shift of this band to 235 cm−1 along with other two vibrational rutile modes, the Eg and A1g centred at 442 and 608 cm−1 respectively with no sign of anatase bands. At 1000 °C, only the vibrational modes associated to the rutile phase were observed.
The distinct features were observed from the 0.28Ag-TiO2 and 0.40Ag-TiO2 films unlike low Ag content samples. As shown in Fig. 1b, the broad and intense Eg (HF), Eg (198 cm−1) anatase modes as well as a weak rutile double phonon band (at 245 cm−1) were detected at 600 °C simultaneously, which were otherwise absent at lower annealing temperatures. In addition, the annealed 0.40Ag-TiO2 sample at 600 °C had also shown a new band at 320 cm−1, featuring the two-phonon scattering band of the anatase phase. Further annealing at 800 °C produces an enhancement of the vibrational rutile modes, characterized by narrow and intense bands, especially the Eg and A1g phonon modes that became sharper when the annealing temperature reached to 1000 °C. It is noteworthy that in all of the Ag-TiO2 samples the broad and complex bands, located at wavenumbers higher than 650 cm−1, are originated from the silicon substrate.
Preliminary analysis of Raman spectra have established that the pure as-deposited TiO2 films grown by pulsed cathodic arc are primarily amorphous. Following thermal treatments, the anatase phase is developed at 200 °C for these films, while for Ag containing samples with the lowest atomic ratio (0.08) the anatase transition is shifted to 400 °C, and finally showing weak bands of rutile at 800 °C. In samples with Ag ratio of 0.16, anatase phase fully develops at annealing temperature of 600 °C. With increasing temperature above 600 °C, the weak rutile bands start to form that are further developed becoming more intense at 800 °C. In contrast, the spectra corresponding to samples with higher Ag ratios (0.28 and 0.40) exhibit that the samples are amorphous up to 600 °C with little sign of anatase. Above 600 °C anatase phase is predominant, however a favourable thermally induced grown condition promotes rutile phase to form and develop simultaneously unlike low Ag-content sample. At higher temperatures above 800 °C, the rutile phase seems to be the dominant one as only rutile bands are present.
Crystallographic phase and Microstructure
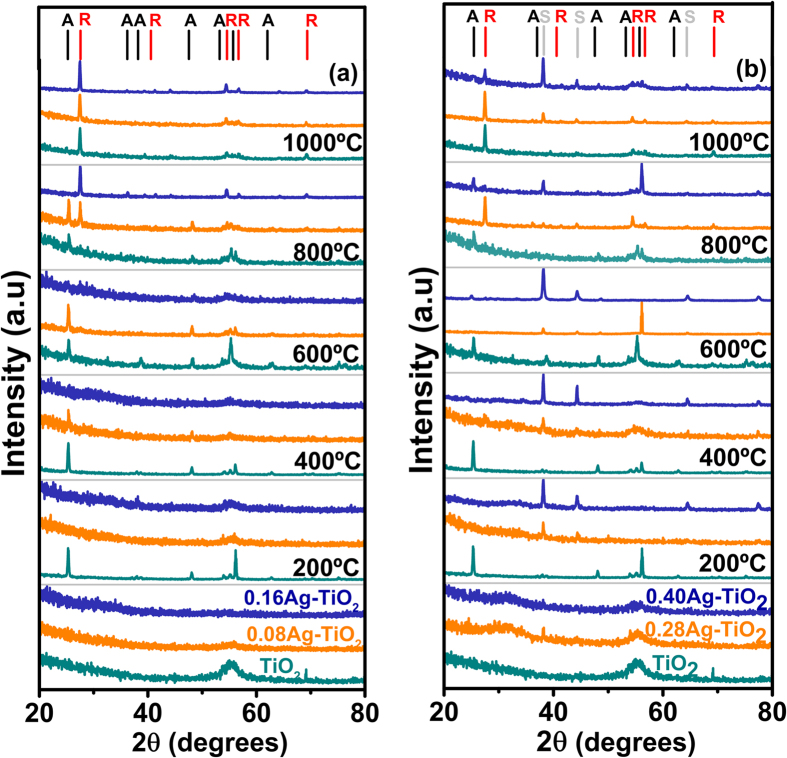
Figure 2 shows grazing angle X-ray diffraction spectra of pure TiO2 and Ag-TiO2 films in as-deposited form and after annealing at temperatures up to 1000 °C. For pure TiO2 sample, the absence of XRD peaks confirms that the structure of the films is amorphous at room temperature (25 °C) showing only broad background, whereas above 200 °C the XRD patterns reveal four distinct peaks at 25.3, 48.1, 55.0 and 62.7° respectively, originated from anatase phase (JCPD-211272 data card, used as reference). Rutile peaks at 27.4, 54.3, 56.6 and 69.1° were only observed when the annealing temperature was increased up to 1000 °C based on rutile data card reference identification (JCPD-211276). The peak located at 56.2° is attributed to the silicon substrate.
Figure 2.
XRD patterns of pure TiO2 and Ag containing TiO2 thin films with silver concentration as: (a) 0.08–016Ag and (b) 0.28–0.40Ag annealed at different temperatures. The pure TiO2 XRD pattern is inserted in both graphs as reference. Anatase, Rutile and silver phases are labelled as A, R and S respectively.
In contrast, the XRD spectra of the Ag containing TiO2 films with low atomic ratio (0.08 and0.16) show that they are still amorphous at 200 °C, thereby validating Raman scan (Fig. 2a) discussed in earlier section. Only peaks related to anatase phase were observed in these samples when annealing temperature reached at 400 °C, while a mixture of rutile and anatase phases were observed at 800 °C. XRD analysis had established that the final crystal structure of the Ag-TiO2 films became rutile following thermal annealing at higher temperature at and above 1000 °C. This results are in agreement with previous results, which show the phase evolution of the Ag-TiO2 films with annealing treatments35.
For these low Ag-content annealed samples, no peak related to silver was observed. This can be interpreted by the fact that silver nanoparticles are finely dispersed in the film microstructure and their concentration is likely below the detection limit of the diffractometer as also reported by others23.
In Fig. 2b, the XRD patterns of samples with higher Ag concentrations (0.28 and 0.40 atomic ratio) reveal the formation of anatase phase only at and above 600 °C unlike the low Ag-content samples shown in Fig. 2a that produces anatase phase at 400 °C. Further thermal treatments have shown a promotion of rutile at 800 °C but with no evidence of anatase phase. At 1000 °C, only the rutile phase was observed. It was also noted from XRD analysis that high temperature annealing of the high Ag content TiO2 film at 1000 °C gives rise to an additional peak at 38.1°, corresponding to the (111) plane of crystalline silver (reference JCPD-40783)39.
The identification of the (111) silver by XRD in samples with high Ag ratio (>0.16) reveals that Ag atoms diffuse into the amorphous TiO2 matrix and agglomerate in forming larger clusters following heat treatment subsequently. The crystallite size of silver in the 0.28 and 0.40 Ag-TiO2 samples have been found to increase with the Ag atomic ratio and annealing temperature. The grain size of Ag was calculated from the width (FWHM) of the XRD peaks according to Scherrer equation as given in Table 1 40. In fact, this type of agglomeration of Ag and Au atoms as metallic nanoparticles in dielectric materials owing to heat treatment is well documented in the literature23. The initial nuclei are supposed to grow by Ostwald-type ripening in a broad range of sizes as the annealing temperature increases41. As shown in Fig. 3, HRTEM analysis exhibits the presence of Ag clusters in 0.28 Ag-TiO2 films following annealing at 200 °C that are of 4.5 nm size on average. In addition, TEM image also reveals the (111) crystallographic planes similar to XRD analysis, having the characteristic separation distance of 0.23 nm.
Table 1. Silver (Ag) grain size (nm) in the TiO2 samples annealed at different temperatures.
| Samples | Temperature (°C) |
||||
|---|---|---|---|---|---|
| 200 | 400 | 600 | 800 | 1000 | |
| 0.28Ag-TiO2 | 41.4 | 47.7 | 48.1 | 67.5 | 93.4 |
| 0.40Ag-TiO2 | 45.9 | 55.0 | 63.8 | 42.8 | 66.9 |
Figure 3.
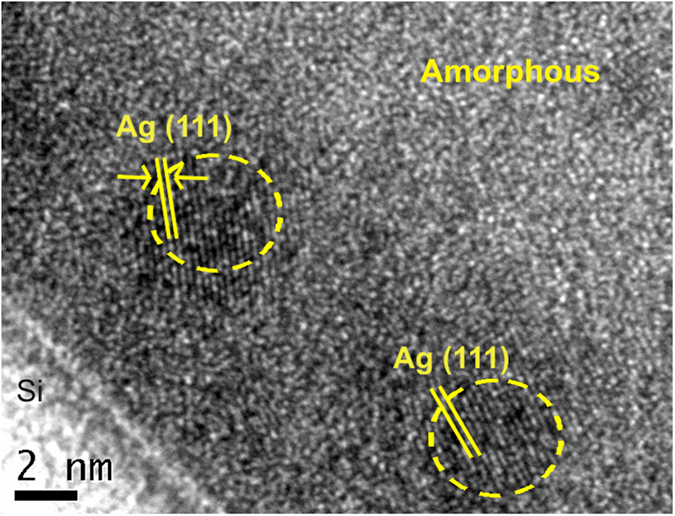
HRTEM image of silver nanoparticles in the 0.28Ag-TiO2 film annealed at 200 °C and of 1 hour duration, shows the (111) crystallographic planes.
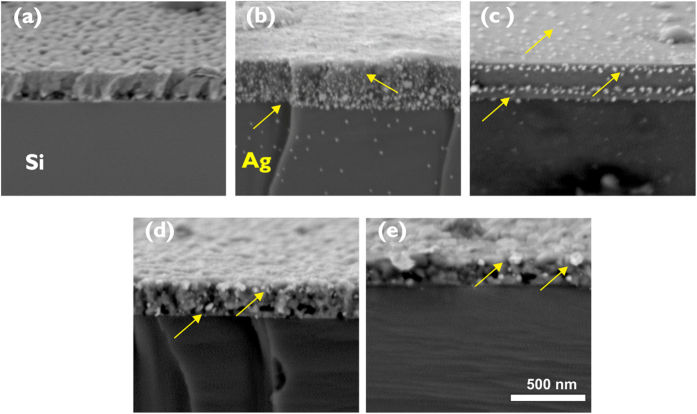
The formation of the Ag clusters and their agglomeration with temperature have been further identified by FESEM study of the cross sectional scan of the films. Figure 4 shows the images of silver nanoparticles embedded in Ag-TiO2 films annealed at different temperatures. In the as-deposited samples, the surface morphology of the film is columnar in nature with a homogeneous texture. As shown in Fig. 4b, silver nanoparticles are distributed within the coating microstructure at 200 °C, and it is agglomerated in spherical-shaped particles with a mean grain size of around 40 nm. SEM and XRD analysis had further revealed that the clustering of Ag nanoparticles increases in size from 45 to 70 nm following an increase in annealing temperature from 400 to 800 °C respectively. As observed in Fig. 4c–e, these clusters tend to diffuse and migrate towards the film surface, in agreement with the results by other authors42,43.
Figure 4.
SEM images of the morphology of the 0.16Ag-TiO2 samples: (a) As-deposited and (b–e) Annealed at 200, 400, 600 and 800 °C respectively. The arrows indicate silver particles.
XRD results had confirmed the interpretation of the Raman spectra on the nature of shift of the phase transition. The transition temperature from amorphous to anatase shifts progressively up to 400 °C for low Ag content samples compared to the as-deposited TiO2 film, whereas such transition occurs at higher temperature at 600 °C for higher Ag concentration. It was further observed that the appearance of the rutile phase is promoted at lower temperatures 800 °C and even at 600 °C for higher Ag contents in Ag-TiO2 samples that would be of potential interest for thin film device applications. Furthermore, HRTEM and FESEM analysis indicate that Ag nanoparticles migrate through the TiO2 microstructure under the influence of thermal treatments, forming agglomerates that increase their grain size with annealing temperature.
Silver Oxidation by XPS Analysis
The gradual transformation of silver to the metallic state with increasing annealing temperature had been observed by XPS analysis. Figure 5 shows the XPS spectra of the Ag 3d core level of 0.28Ag-TiO2 films before and after annealing at 300 and 400 °C. The Ag 3d5/2 and Ag 3d3/2 peaks have been detected giving binding energies of 369.0 and 375.0 eV respectively (Fig. 5a). After deconvolution, the spectra have shown a small shoulder peak located at 368.0 eV along with a doublet located at 374.0 eV. The high energy value of the Ag 3d peaks could be ascribed to the presence of spatial charge associated to the ion bombardment, as well as to the particle size44. Additionally, adventitious carbon on the film surface45 could also contribute to this effect, whereas the small doublet is attributed to Ag0 46,47. To avoid the effect of carbon, the annealed samples were etched for 60 minutes for XPS characterisation. XPS analysis of the samples annealed at 300 °C (Fig. 5b) shows that the Ag 3d5/2 and Ag 3d3/2 core levels are located at 368.3 and 374.3 eV respectively. The position of these peaks coincides with the previous doublet, a characteristic of metallic silver48,49, which is in good agreement with the XRD results. As shown in Fig. 5c, annealing at higher temperatures allows the metallic state of silver to become stable implying that there is no significant shift of the Ag core level peaks in this case.
Figure 5.
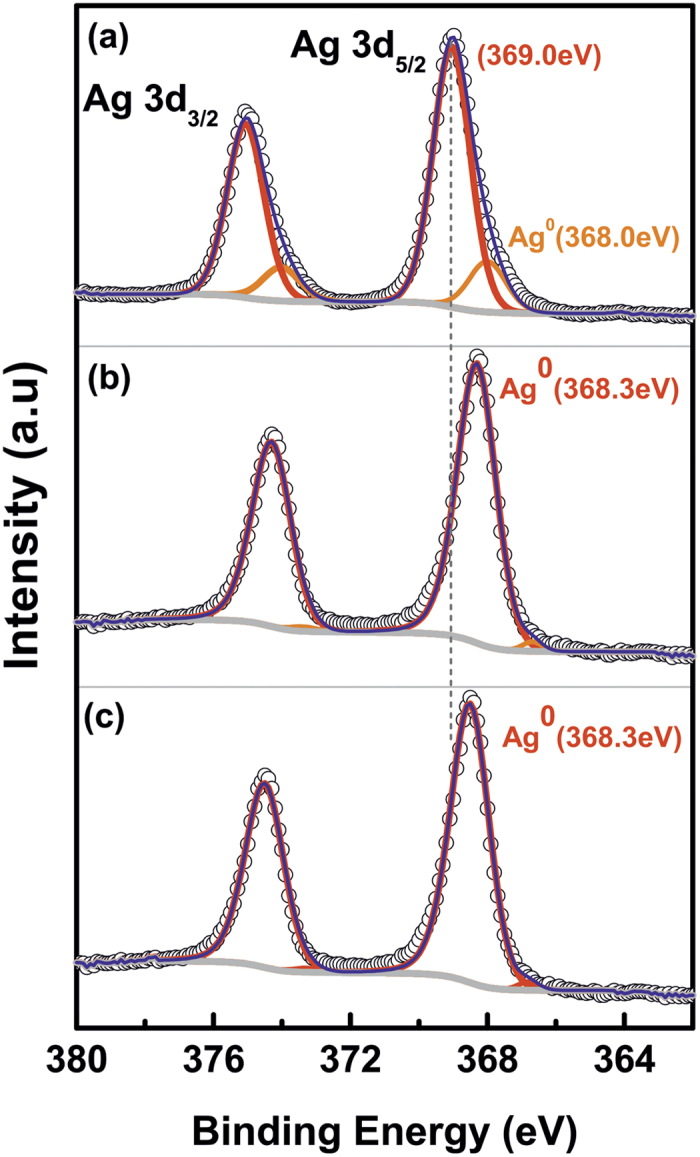
XPS Analysis of Ag-3d core level spectra of the 0.28 Ag-TiO2 films (a) As-deposited, and (b,c) Annealed at 300 °C and 400 °C respectively for 1 hour. The annealed samples have been analysed after 60 min etching.
Surface morphology by AFM Analysis
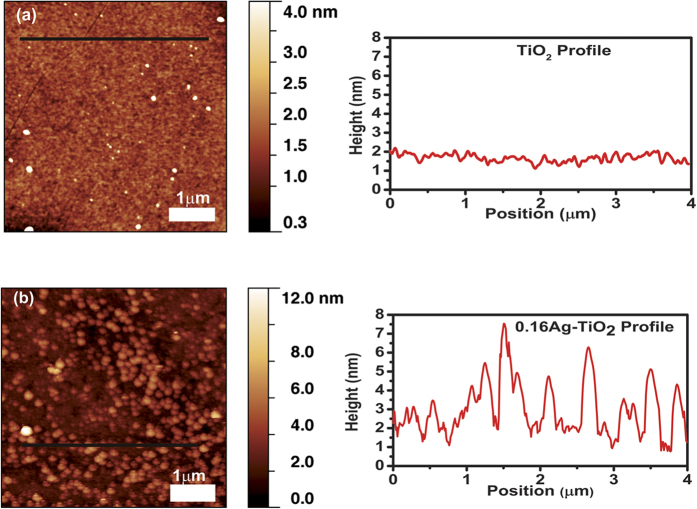
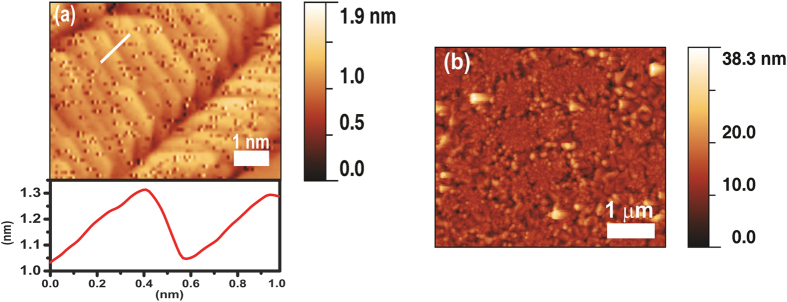
Figure 6a shows the surface morphology of pure TiO2 and 0.16Ag-TiO2 films without annealing. A surface with average rms roughness of 0.2 nm (Ra = 0.2 ± 0.1 nm) was observed in the pure TiO2 sample. The grainy structure and the absence of atomically smooth terraces indicates that the as-deposited samples are amorphous/polycristalline in nature50. The 0.16Ag-TiO2 sample shows densely populated grain structures, giving a higher rms roughness value as Ra = 0.7 ± 0.1 nm (Fig. 6b). Following annealing at 800 °C, a change in surface morphology was clearly noticed from AFM scan of these samples. In contrast to the as-deposited pure TiO2, the annealed sample, Fig. 7a, shows flat terraces similar to those observed in rutile TiO2 (110) crystalmetals with the characteristic monoatomic step height of 0.3 ± 0.1 nm, indicating the crystallinity acquired during annelaing51. However, for the 0.16Ag-TiO2 sample, Fig. 7b, the atomic terraces are not observed which is expected due to silver diffusion and segregation onto the film surface, as confirmed by SEM analysis (Fig. 4e). In addition, a change in the average roughness value was obtained after annealing at 800 °C: the pure TiO2 films show Ra = 5.1 ± 0.2 nm, whereas in the 0.16Ag-TiO2 sample it was increased giving Ra = 7.2 ± 0.2 nm. Comparing the Ra values obtained from Ag-content samples after annealing at 800 °C, the films roughness increases slightly in good agreement with the previous results that has established this increase in Ra values related to phase transformations of the film microstructure with thermal annealing13,52.
Figure 6.
Topographic AFM images and height profile of the amorphous as-deposited films: (a) Pure TiO2 and (b) 0.16Ag-TiO2.
Figure 7.
Topographic AFM images of the annealed films at 800 °C: (a) Pure TiO2, with height profile of the atomic terraces and (b) 0.16Ag-TiO2.
Wetting Property
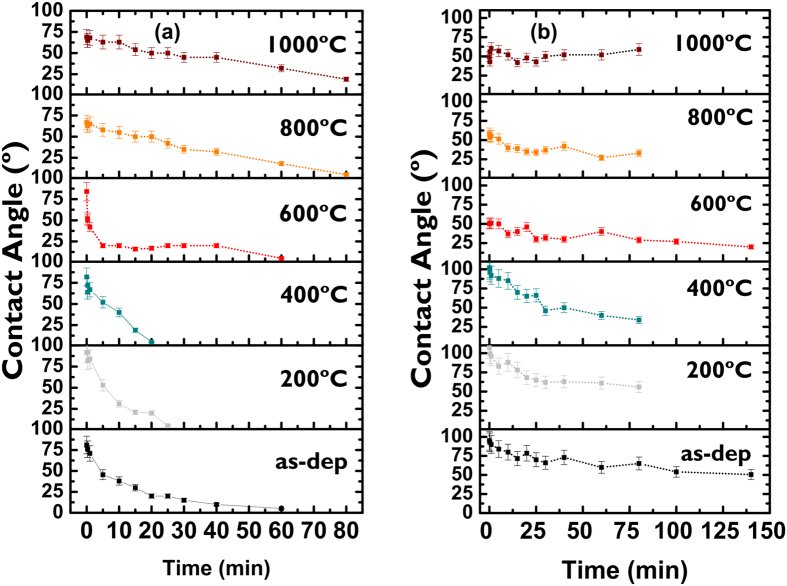
The photocatalytic performance of the Ag-TiO2 films had been assessed by investigating wetting properties of the annealed samples at different temperatures. The effect of UV irradiation time on contact angle of the films is illustrated in Fig. 8a,b for two samples with different Ag contents of 0.08 and 0.28 respectively. In the as-deposited films, the value of the wetting angle before UV irradiation was measured as 81°, which indicates partially hydrophobic state of the film surface. As can be observed from Fig. 8a, the contact angle of UV-irradiated films with lower silver content (0.08) decreases monotonously in all samples irrespective of post-processing thermal treatment. This signifies the tendency of the films to become highly hydrophilic following irradiation. It is noteworthy that the contact angle decreases sharply for the samples, subjected to annealing at lower temperature range between 200–400 °C. This is, in fact, the boundary between amorphous to anatase transformation at which the film surface reaches quickly, by about 30 min, at superhydrophilic state producing contact angle ~5°, whereas the annealed samples between 600–1000 °C require longer irradiation time of about 60 min to reach the superhydrophilic state. Finally, at 1000 °C when the crystalline phase is fully transformed to rutile, the time required to achieve superhydrophilicity increases further about 80 minutes giving rise to contact angle of 19°. In contrast, the wetting angle of 0.28Ag-TiO2 sample shows significant difference compared to 0.08Ag-content films as shown in Fig. 8b. In higher Ag-content samples, the contact angle takes longer time up to 140 min to reach lower value in achieving hydrophilic state under similar processing conditions. In particular, the annealed samples at 600 °C and above gave a low value of contact angle, however tend to retain its hydrophilicity value,, of about 50°, substantially after prolong period of UV exposure. It is evident that the presence of Ag in TiO2 matrix would influence the wetting properties of the annealed film surface during crystallization process and change in microstructure induced by phase transition as reported by others53,54. The results had established that the Ag-TiO2 structure with high silver content, when subjected to high temperature annealing to reach full phase transformation to rutile, maintain the lower and constant value of hydrophobicity, being insensitive to UV illumination.
Figure 8.
Evolution of the wetting angle on Ag-TiO2 films under UV illumination: (a) 0.08Ag-TiO2 and (b) 0.28Ag-TiO2.
Optical properties
The Ag-content samples deposited on glass substrates and annealed at 300 °C and 450 °C respectively were chosen for the spectral characterisation in the UV-visible-NIR bands. The transition temperature of the glass substrate is 557 °C that imposes limitation on choice of higher annealing temperatures. This paper is, therefore, focussed on qualitative study of the photocatalytic performance of TiO2 film at lower temperature range below 500 °C which prevents structural relaxation in glass to retain its mechanical property. As expected, the optical study of the TiO2 sample will only provide the effect of amorphous to anatase phase transformation at 300–450 °C. In fact, TiO2 at its anatase phase has soft crystal direction along the [001] orientation, e.g., normal to the device layer plane that allows easier band gap tuning unlike rutile phase. While the rigorous analysis of the optical properties of annealed Ag-content TiO2 film is beyond the scope of this paper, it will be still interesting to investigate qualitatively the degree of improvement of its photocatalytic behaviour from variation of the energy band gap (Eg) owing to complex phase kinetics of Ag-content TiO2 matrix at anatase phase.
The energy band gap (Eg) of the material was estimated from the transmission spectrum and optical absorption coefficients obtained from the well-known formulas given by equations (1,2) using graphical methods55.
 |
 |
where, α is the absorption coefficient that depends on valence and conduction band configuration of the material, and varies with photon energy, hν. Eg is the material band gap and η0 is the refractive index. Here, λ is wavelength, h is Planks constant and c is velocity of light in free space. n is a constant typically considered as 1/2 for allowed band transitions and 2 for forbidden transitions. In this study, the Ag-TiO2 samples annealed at 300–450 °C gave rise to anatase phase which shows an indirect band gap transition as expected. The value of constant, n is usually taken as 1/2 for allowed transition. However, for indirect and allowed transition as observed in anatase TiO2 film, n is considered here as 2 by taking into account of multi-phonon scattering using same approximate equation (1) as validated by others54.
Figure 9a–c illustrate the transmittance characteristics of the as-deposited TiO2 and Ag-TiO2 samples before and post annealing at 300 °C and 450 °C respectively. Figure 9a shows high transmittance of around 80–90% in the visible range of 350–500 nm obtained from the as-deposited TiO2 sample prior to annealing that starts to decrease gradually above 550 nm giving an average value of 70% in NIR band. The rapid decay of the transmittance curve for all samples towards UV band represents the intrinsic absorption band edge of the material with cut-off wavelength at λ = 390 nm. Following annealing as depicted in Fig. 9b,c, the samples exhibit similar trend with a slight shift of the transmission peak but with a reduction of transmittance values, in particular for the samples having higher Ag-content, e.g. 0.28Ag and 0.40Ag, along with a shift of the absorption band edge towards shorter wavelength. The spectral response of the higher Ag-content samples also shows an additional strong absorption band that starts to form at longer wavelength, for example the 0.28-Ag-TiO2 sample producing an absorption peak at 500 nm following annealing at 300 °C. This effect is prominent at annealing temperature of 450 °C for all higher Ag-content samples that give rise to a strong absorption peak with larger shift towards longer wavelength and of reduced transmission. The maximum redshift was measured from the 0.40-Ag-TiO2 sample with absorption peak at 547 nm. A similar nature of shift of the transmittance peak and of the absorption edge were observed for all samples depending on Ag-contents that can be attributed to thermally induced diffusion and agglomeration of Ag nanoparticles acting as scattering centres. The increased absorption and redshift towards NIR band obtained from the high Ag-content TiO2 structure can be explained due to the combined effects of onset of the phase transition and formation of larger Ag clusters along with surface plasmon resonance originated from Ag agglomeration and its migration towards film surface56.
Figure 9.
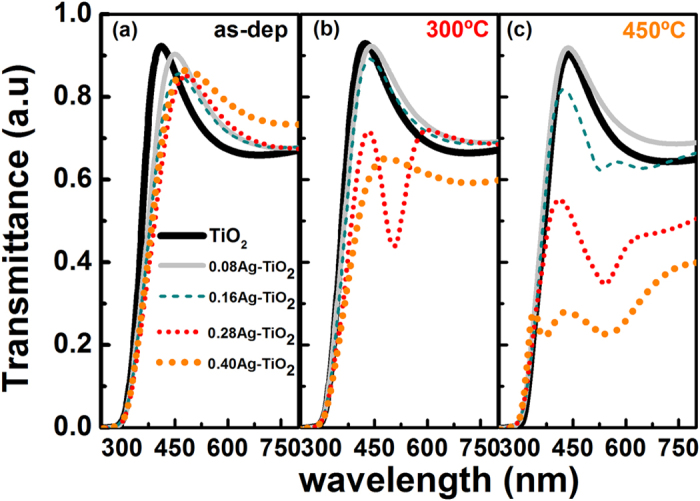
Optical transmittance spectra of TiO2-Ag thin film coatings deposited on glass: (a) As-deposited samples without annealing, (b) Annealed at 300 °C and (c) Annealed at 450 °C respectively for 1 hour.
Figure 10 shows the variation of bandgap (Eg) with annealing temperature for different Ag-content TiO2 samples. As expected, the band gap is increased in all samples following thermal annealing due to the shift of intrinsic absorption band edge towards short wavelength. It is noteworthy that an incorporation of Ag nanoparticles in TiO2 matrix causes a decrease in bandgap with and without thermal treatment compared to pure TiO2 structure, e.g., Eg from 3.1 eV in TiO2 to 2.8 eV in 0.40Ag-TiO2 sample at the as-deposited condition. This can be explained by charge transfer of type-d electron of Ag to the conduction band of TiO2, resulting in narrowing of bandgap as reported by others57. In effect, Ag nanoparticles act as recombination centre for electron trapping by introducing new electronic states within bandgap of TiO2. Thus the preliminary results have established the possibility of improvement of photocatalytic efficiency by reducing the band gap in anatase Ag-content TiO2 film at lower annealing temperature.
Figure 10.
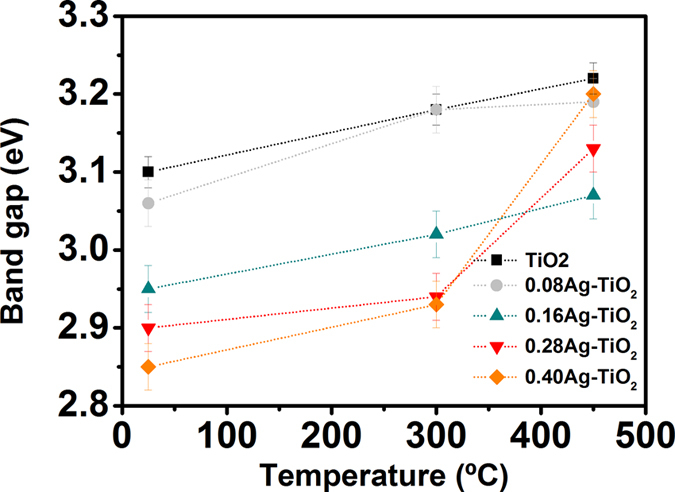
Variation of the energy bandgap (eV) versus annealing temperature for different concentration of silver content in TiO2 thin film structure.
Discussion
The amorphous structure resulting from the deposition of compounds with highly directional bonds, such as in TiO2 thin films, has been attributed to the relatively high energy needed by the bonded atoms to rotate around a particular bond to satisfy crystal symmetry58. The energy required to re-arrange the Ti-O bonds in forming a crystalline structure, can be induced by soft thermal annealing. In this process, these bonds suffer a continuous reorganization during the transition, with the breaking and re-forming, to crystallize in anatase and eventually in the more stable rutile phase. Previous studies have shown that a relatively soft heat treatment (200–400 °C) to pure TiO2 films is enough to activate the transition from the amorphous to anatase phase13,59,60. The crystallization temperature depends on the host material, synthesis method, grain size and the deposition conditions, whereas the transition had been identified by XRD and SEM techniques13,14,60,61,62,63.
According to some authors, metal cations added to the anatase phase, with valence band lower tan +3, or larger radii than Ti4+ ions occupy substitutional positions in the TiO2 matrix. The ultimate effect is an increase in oxygen vacancies in the TiO2 lattice to compensate the charge neutrality, thus promoting antase-to-rutile transformation in doped samples12,64. However, such concept does not take into account of the diffusion and agglomeration processes of silver nanoparticles during the annealing treatment, as observed in this and other studies19,65,66.
In this work adapting cathodic arc technique, the anatase structure of films was obtained at 200 °C for pure TiO2, but the presence of Ag atoms increases the crystallization temperature, as detected by XRD and Raman spectroscopy. Thus, the amorphous-to-anatase transition temperature was found to be systematically delayed until it reached to 400 °C for the atomic ratio of 0.08, and to 600 °C for higher Ag concentrations. Frequently, silver is obtained in the oxide state when deposited by PVD and CVD techniques in reactive oxygen atmospheres24,67, and for this reason the increase in the transition temperature from amorphous to anatase could be ascribed to the additional energy required to dissociate Ag-O bonds initially formed in the deposited films. Additionally, the lower chemical affinity of silver towards oxygen, as compared to titanium, also favours the reduction of silver to the metallic state during annealing, as it has been revealed by XPS and XRD analysis. Moreover, FESEM image analysis indicates that Ag atoms diffuse at higher annealing temperature and eventually nucleate forming large aggregates with lower surface energy, as observed by other authors68.
The nucleation of silver aggregates is by itself another factor that may strongly affect the anatase transition due to their much larger size, e.g., mean grain size of several nm in annealed films at 200 °C when compared to the ionic radii of Ti and O atoms as 0.13 and 0.074 nm respectively. Therefore, it is reasonable to assume that the presence of Ag aggregates would slow down the re-arrangement of Ti-O bonds in the amorphous films to crystallize into the anatase structure. It is also found that an increase in Ag concentration tends to hinder the crystallization to higher temperatures, as indicated by XRD spectra of the 0.28 and 0.40 Ag samples, in which anatase phase forms only at 600 °C.
On the other hand, the A-R phase transformation initiates between 700–1000 °C in pure TiO2 powders and films13,17,26,69,70,71, while full rutile phase is usually detected at around 1000 °C. In this work, rutile phase is also clearly distinguished from anatase at 1000 °C by its characteristic vibrational bands. In case of TiO2 films with low Ag content (Ag below 2 at.%), some authors have observed the rutile phase at 750 °C24. In other studies, with lower Ag/Ti content (0.06) obtained by sol-gel, the A-R transition is found at temperatures close to 800 °C72. However, the samples produced in this study show an earlier onset of the transition to rutile which is initiated at lower temperature of 600 °C for the Ag atomic ratio of 0.08, with the rutile proportion in the film becoming higher as the Ag concentration increases.
The thermally induced agglomeration of silver atoms may explain the promotion of rutile phase at lower temperature, since the A-R transition implies a contraction of the c-axis, with a reduction of the unit cell volume of around 8%12. The agglomeration of Ag and formation of lager clusters within TiO2 matrix will eventually constrain the volume available for the anatase lattice, thus disrupting the anatase phase to form a more stable and denser rutile microstructure.
In addition, the presence of silver aggregates with different sizes noticeably affects the wetting properties and optical transmittance as discussed above. It is well known that the photocatalytic response in TiO2 is determined, among other factors, by photo-generation of electron-hole (e–h) pairs and their subsequent energy separation efficiency. According to the model proposed by Meng68, small size Ag clusters act as electron traps for photogenerated e–h carriers in the TiO2 film through a Schottky barrier effect, thus increasing the concentration of holes and, consequently, their surface energy. The ultimate effect is the absorption enhancement of –OH and O2− species leading to hydrophilicity of the film surface as depicted in Fig. 8. On the contrary, large size Ag nanoparticles that can be found in samples with higher Ag-content and/or annealed at T > 600 °C act as electronic recombination centres. In effect, this would reduce the separation efficiency of the e-h pairs and, therefore, the hydrophilic response of the films (Fig. 8b). In addition, other morphological properties such as grain size, surface roughness, texture, and even the amorphous→anatase→rutile transition would also contribute to the wetting properties of the film surface. In particular, the surface energy of anatase has been found to be lower than rutile12. This may explain the lower irradiation time (20 min) needed to reach the superhydrophilic state in the samples with low Ag content, when subjected to annealing at 400 °C that promotes anatase phase in accordance with the results obtained by other authors73,74, though the films present faster response to UV irradiation. Similarly, larger size of Ag agglomerates and their diffusion towards film surface following annealing at 450 °C can be considered as the major physical mechanisms resulting in an additional absorption peak and its redshift towards NIR in high Ag content samples as observed from the transmittance spectra in Fig. 9.
Finally, a qualitative description of the phase transition in Ag-TiO2 films is depicted schematically in Fig. 11 that demonstrates the nature of transformation of crystalline states within the Ag-TiO2 matrix including their interdependence on Ag atomic ratios and thermal annealing temperature, as evaluated in this interesting study. The faded zones comprise of a mixture of phases that could be found extending over a wide temperature range. It should be noted that the crystallization temperature of the different TiO2 phases presented in this study was taken as an estimated value since the thermal annealing was conducted for 1h each in step of 200 °C, and was increased up to 1000 °C as final step. The qualitative diagram clearly indicates an early onset of stable rutile phase at around 600 °C for higher concentration Ag-content TiO2 samples compared to lower Ag-content ones. This effect is envisaged to have an impact on achieving stable rutile phase in TiO2 films at lower processing temperature for photocatalytic and thin film device applications.
Figure 11.
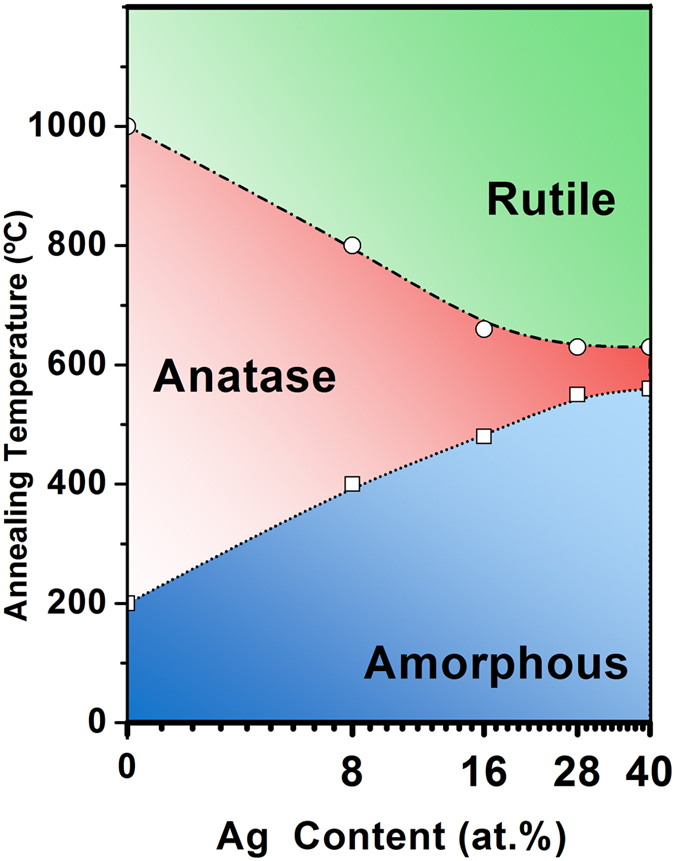
Phase diagram of the Ag-TiO2 films with different silver content expressed in atomic percent Ag:(Ti + Ag). The phase diagram was obtained based on both Raman and XRD data.
Conclusions
The influence of silver on phase transformation of TiO2 films had been thoroughly investigated by depositing Ag-TiO2 thin film structure on silicon substrate employing reactive pulsed cathodic arc technique and followed by thermal annealing up to 1000 °C for 1 hour. The surface morphology and crystal orientation of the Ag-TiO2 films had been evaluated using SEM, Raman and XRD analysis with an emphasis on the wetting properties and optical transmittance. In samples with high Ag:(Ti + Ag) atomic ratio of 0.28, Raman analysis shows characteristic bands of anatase at 600 °C, co-existing with small rutile peaks which eventually develop into well defined, with no overlapping, bands of rutile at 800 °C. XRD analysis has revealed the formation of (111) plane of crystalline silver in high Ag-content sample (>0.16) indicating favourable conditions for diffusion of Ag nanoparticles into amorphous TiO2 structure following thermal annealing and finally, their agglomeration in forming larger clusters that has an impact on their wetting property and optical absorption. TEM analysis has identified the Ag clusters of about 4.5 nm in size estimated from 0.28 Ag-content sample at 200 °C and its (111) plane with characteristic separation of 0.23 nm. With higher annealing temperature at 800 °C, the size of Ag clusters increases up to 70 nm as observed from SEM image analysis. The experimental results have demonstrated the dominant role of Ag concentration and its grain size in tailoring thermally induced phase transition of TiO2 films. The amorphous to anatase transition is found to be delayed until 600 °C in low Ag-content TiO2 films compared to 200 °C in the pure TiO2 films, whereas the rutile phase is, in fact, promoted at lower temperature with onset at 600 °C for higher Ag-content TiO2 films.
This has established clearly the possibility of low temperature fabrication of TiO2 thin film structure to achieve stable rutile phase by incorporating Ag with precise control of its atomic concentration that would simultaneously (a) inhibit amorphous to anatase transition and (b) promote anatase to rutile transition at lower temperature range of 600 °C. These contrasting effects have been tentatively explained by the steric constraints imposed by diffusion and agglomeration of silver atoms in forming larger clusters following thermal annealing. In the first case, by hindering the diffusion process of the smaller titanium and oxygen ions to form anatase, whereas, in the second case, by a progressive reduction of the available space to maintain relatively high volume of the anatase unit cell, these two thermally induced processes would ultimately disrupt its anatase structure leading to formation of more stable and denser rutile phase. In addition, the study of the wetting property reveals that the presence of silver clusters in the TiO2 films renders their partial hydrophobic character to a superhydrophilic state, with a rapid response to the UV light, for low Ag content samples in its anatase phase, subjected to annealing at 200–400 °C. The transmittance characteristics of Ag-TiO2 coatings have exhibited the formation of additional absorption peak and its redshift towards near infrared in high Ag-content samples owing to large size of Ag agglomerates and surface plasmon resonance effect. The narrowing of band gap is observed in anatase Ag-content TiO2 films at lower annealing temperature showing promise in tailoring photocatalytic efficiency. The synergy of formation of rutile phase in TiO2 films at lower annealing temperature, its improved wetting properties and increased optical absorption at near infrared band by incorporation of silver nanoparticles into TiO2 matrix is envisaged to enhance the functionality of Ag-TiO2 thin films having potential for photocatalytic, antimicrobial, optical coatings and thin film IR sensor applications.
Methods
Silver containing TiO2 films (Ag-TiO2 samples) with different silver concentration have been deposited by pulsed cathodic arc on [100] silicon substrates using pure (99.99%) titanium and silver cathodes. The setup of pulsed cathodic arc system was described elsewhere75,76. The cathodic arc technique allows the control of the composition by adjusting the pulse ratio on the Ag and Ti cathodes. The arc discharge was made in a reactive atmosphere, with an oxygen flow of 60 sccm and working pressure of 1 × 10⁻² mbar. In order to obtain homogeneous films, the substrates were located at 12 cm from the cathodes and rotated with a frequency of 8 Hz by an MDRIVE 23 PLUS motor. The different samples, with varying Ag:Ti + Ag atomic ratio concentrations which were chosen as 0.08, 0.16, 0.28 and 0.40 respectively in trial run, were produced by changing the pulse ratio on the Ti and Ag cathodes as 38:2, 8:2, 4:2 and 2:2 respectively. The film thickness was around 100 nm in all samples, as measured with a DEKTAK 150 STYLUS profilometer. The film microstructure was analysed by scanning electron microscopy (FESEM NANOSEM 230), equipped with X-ray energy dispersion spectroscopy which was employed to estimate the Ag:(Ti + Ag) atomic ratio concentration. Following deposition, the samples were annealed in ambient atmosphere at 200, 400, 600, 800 and 1000 °C in step for 1 hour each, respectively. Raman spectra were recorded before and after thermal annealing using an ENWAVE EZraman-N spectrometer provided with a LEICA DM 300 microscope. The spectra were generated using a diode laser at 532 nm and power of 350mW. In addition, XRD analysis had been performed for all the samples, before and after annealing, by X-ray diffractometry (D8 BRUKER ADVANCED with CuKα radiation) in the 2θ range, from 20° to 80° with 0.5° incident grazing angle.
XPS measurements were performed in an ultrahigh vacuum, with a base pressure of 1 × 10⁻¹⁰ mbar, PHOIBOS 100 ESCA/Auger spectrometer with a MgKα anode (1253.6 eV). For data analysis, the spectra were subjected to the Shirley background subtraction formalism. In order to analyze the Ag 3d core levels in the as-deposited samples, the binding energy scale was calibrated with respect to the C 1s core level peak at 285.0 eV. For the annealed samples, the spectra were collected before and after a sequence of etching treatments of about 60 minutes by Ar+ bombardment. The etching rate of the sample was 0.12 nm per minute.
The morphological studies of selected Ag-TiO2 samples before and after annealing at 800 °C were conducted using atomic force microscopy (AFM, Multimode Veeco) in the tapping mode77. AFM image analysis was performed with Gwyddion program applying a plane background subtraction filter. The cross section images of the thin film samples were also investigated by high resolution scanning electron microscopy (HRSEM), NANOSEM 230 FEI. Furthermore, high resolution TEM (HRTEM) images were evaluated for samples annealed at 200 °C, using a FEI TECNAI T30 microscope. The ultra-thin foils of around 25 nm were prepared by Focus Ion Beam (FIB) HELIOS 600 dual system for TEM analysis.
Finally, in order to investigate the effect of silver on the wetting properties of the films, contact angle measurements were carried out by illuminating the film surface with UV radiation (Xe lamp of 125 W) for a time period ranging from 0 up to140 min. After UV irradiation, distilled water droplets (1 μl) were produced on the samples to wet the sample surface, and the contact angle was collected with a CCD CAM 100 (KSV Instruments). The optical transmission property of TiO2 films was studied by depositing the thin film on borosilicate crown glass substrates and the spectral characteristics of the samples were evaluated using a SOLIDSPEC 3700 UV-visible-NIR spectrometer to calculate the transmittance and the energy band gap respectively.
Additional Information
How to cite this article: Mosquera, A. A. et al. Effect of silver on the phase transition and wettability of titanium oxide films. Sci. Rep. 6, 32171; doi: 10.1038/srep32171 (2016).
Acknowledgments
This work was supported by the State Secretary of Research, Development and Innovation of Spain through the FUNCOAT project, within the program CONSOLIDER INGENIO 2010 (ref. CSD2008-00023).
Footnotes
Author Contributions A.A.M., J.M.A., V.N., D.B. and J.L.E. wrote the article and analysed the experimental data. The experimental work has been performed by A.A.M. and V.N. All the authors participated equally in the discussion, and the article was reviewed by A.A.M., J.M.A., V.N., D.B. and J.L.E.
References
- Diebold U. The surface science of titanium dioxide. Surface Science Reports 48, 53–229 (2003). [Google Scholar]
- Kuznetsova I. N., Blaskov V., Stambolova I., Znaidi L. & Kanaev A. TiO2 pure phase brookite with preferred orientation, synthesized as a spin-coated film. Materials Letters 59, 3820–3823 (2005). [Google Scholar]
- Di Paola A., Addamo M., Bellardita M., Cazzanelli E. & Palmisano L. Preparation of photocatalytic brookite thin films. Thin Solid Films 515, 3527–3529, doi: 10.1016/j.tsf.2006.10.114 (2007). [DOI] [Google Scholar]
- Moret M. P., Zallen R., Vijay D. P. & Desu S. B. Brookite-rich titania films made by pulsed laser deposition. Thin Solid Films 366, 8–10 (2000). [Google Scholar]
- Wang Z., Helmersson U. & Käll P. O. Optical properties of anatase TiO2 thin films prepared by aqueous sol-gel process at low temperature. Thin Solid Films 405, 50–54 (2002). [Google Scholar]
- Zhang Z., Triani G. & Fan L. J. Amorphous to anatase transformation in atomic layer deposited titania thin films induced by hydrothermal treatment at 120 °C. Journal of Materials Research 23, 2472–2479 (2008). [Google Scholar]
- Mathur S. & Kuhn P. CVD of titanium oxide coatings: Comparative evaluation of thermal and plasma assisted processes. Surface and Coatings Technology 201, 807–814, doi: 10.1016/j.surfcoat.2005.12.039 (2006). [DOI] [Google Scholar]
- Bessergenev V. G. et al. Study of physical and photocatalytic properties of titanium dioxide thin films prepared from complex precursors by chemical vapour deposition. Thin Solid Films 503, 29–39, doi: 10.1016/j.tsf.2005.10.046 (2006). [DOI] [Google Scholar]
- Mathews N. R., Morales E. R., Cortés-Jacome M. A. & Toledo Antonio J. A. TiO2 thin films–Influence of annealing temperature on structural, optical and photocatalytic properties. Solar Energy 83, 1499–1508 (2009). [Google Scholar]
- Jayasree V. et al. Influence of reactive oxygen ambience on the structural, morphological and optical properties of pulsed laser ablated potassium lithium niobate thin films. Thin Solid Films 517, 603–608 (2008). [Google Scholar]
- Zywitzki O. et al. Structure and properties of crystalline titanium oxide layers deposited by reactive pulse magnetron sputtering. Surface and Coatings Technology 180–181, 538–543 (2004).22422014 [Google Scholar]
- Hanaor D. A. H. & Sorrell C. C. Review of the anatase to rutile phase transformation. Journal of Materials Science 46, 855–874 (2010). [Google Scholar]
- Hou Y. Q., Zhuang D. M., Zhang G., Zhao M. & Wu M. S. Influence of annealing temperature on the properties of titanium oxide thin film. Applied Surface Science 218, 97–105 (2003). [Google Scholar]
- Zhao B., Zhou J., Chen Y. & Peng Y. Effect of annealing temperature on the structure and optical properties of sputtered TiO2 films. Journal of Alloys and Compounds 509, 4060–4064 (2011). [Google Scholar]
- Hunsche B., Verghl M. & Ritz A. Investigation of TiO2 based thin films deposited by reactive magnetron sputtering for use at high temperatures. Thin Solid Films 502, 188–192 (2006). [Google Scholar]
- Tian Z. M. et al. Effect of annealing conditions on the magnetism of Vanadium-doped TiO2 powders. Solid State Communications 146, 522–525 (2008). [Google Scholar]
- Zhang Y. H. & Reller A. Phase transformation and grain growth of doped nanosized titania. Materials Science and Engineering C 19, 323–326 (2002). [Google Scholar]
- Song D. H., Uhm S. H., Lee S. B., Han J. G. & Kim K. N. Antimicrobial silver-containing titanium oxide nanocomposite coatings by a reactive magnetron sputtering. Thin Solid Films 519, 7079–7085 (2011). [Google Scholar]
- Yu B., Leung K. M., Guo Q., Lau W. M. & Yang J. Synthesis of Ag-TiO2 composite nano thin film for antimicrobial application. Nanotechnology 22 (2011). [DOI] [PubMed] [Google Scholar]
- Mohammadi M. R. & Fray D. J. Synthesis and characterisation of nanostructured neodymium titanium oxides by sol-gel process: Controlling the phase composition, crystal structure and grain size. Materials Chemistry and Physics 122, 512–523 (2010). [Google Scholar]
- Seery M. K., George R., Floris P. & Pillai S. C. Silver doped titanium dioxide nanomaterials for enhanced visible light photocatalysis. Journal of Photochemistry and Photobiology A: Chemistry 189, 258–263 (2007). [Google Scholar]
- Chao H. E., Yun Y. U., Xingfang H. U. & Larbot A. Effect of silver doping on the phase transformation and grain growth of sol-gel titania powder. Journal of the European Ceramic Society 23, 1457–1464 (2003). [Google Scholar]
- Adochite R. C. et al. The influence of annealing treatments on the properties of Ag:TiO 2 nanocomposite films prepared by magnetron sputtering. Applied Surface Science 258, 4028–4034 (2012). [Google Scholar]
- García-Serrano J., Gómez-Hernández E., Ocampo-Fernández M. & Pal U. Effect of Ag doping on the crystallization and phase transition of TiO2 nanoparticles. Current Applied Physics 9, 1097–1105 (2009). [Google Scholar]
- Miao L. et al. Preparation and characterization of polycrystalline anatase and rutile TiO2 thin films by rf magnetron sputtering. Applied Surface Science 212–213, 255–263 (2003). [Google Scholar]
- Zhao L., Han M. & Lian J. Photocatalytic activity of TiO2 films with mixed anatase and rutile structures prepared by pulsed laser deposition. Thin Solid Films 516, 3394–3398 (2008). [Google Scholar]
- Kleiman A., Márquez A. & Lamas D. G. Anatase TiO2 films obtained by cathodic arc deposition. Surface and Coatings Technology 201, 6358–6362 (2007). [Google Scholar]
- Ryu S. W., Kim E. J., Ko S. K. & Hahn S. H. Effect of calcination on the structural and optical properties of M/TiO2 thin films by RF magnetron co-sputtering. Materials Letters 58, 582–587 (2004). [Google Scholar]
- Eufinger K., Poelman D., Poelman H., De Gryse R. & Marin G. B. Photocatalytic activity of dc magnetron sputter deposited amorphous TiO2 thin films. Applied Surface Science 254, 148–152 (2007). [Google Scholar]
- Zou J., Gao J. & Xie F. An amorphous TiO2 sol sensitized with H2O2 with the enhancement of photocatalytic activity. Journal of Alloys and Compounds 497, 420–427 (2010). [Google Scholar]
- Ou K. L., Shih Y. H., Huang C. F., Chen C. C. & Liu C. M. Preparation of bioactive amorphous-like titanium oxide layer on titanium by plasma oxidation treatment. Applied Surface Science 255, 2046–2051 (2008). [Google Scholar]
- Ohtani B., Ogawa Y. & Nishimoto S. I. Photocatalytic activity of amorphous-anatase mixture of titanium(IV) oxide particles suspended in aqueous solutions. Journal of Physical Chemistry B 101, 3746–3752 (1997). [Google Scholar]
- Okimura K. Low temperature growth of rutile TiO2 films in modified rf magnetron sputtering. Surface and Coatings Technology 135, 286–290 (2001). [Google Scholar]
- Pradhan S. S. et al. Low temperature stabilized rutile phase TiO2 films grown by sputtering. Thin Solid Films 520, 1809–1813 (2012). [Google Scholar]
- Mosquera A. A., Endrino J. L. & Albella J. M. XANES observations of the inhibition and promotion of anatase and rutile phases in silver containing films. Journal of Analytical Atomic Spectrometry 29, 736–742, doi: 10.1039/c3ja50354b (2014). [DOI] [Google Scholar]
- Tompsett G. A. et al. The Raman spectrum of brookite, TiO2 (Pbca, Z = 8). Journal of Raman Spectroscopy 26, 57–62; 10.1002/jrs.1250260110 (1995). [DOI] [Google Scholar]
- Berger H., Tang H. & Lévy F. Growth and Raman spectroscopic characterization of TiO2 anatase single crystals. Journal of Crystal Growth 130, 108–112 (1993). [Google Scholar]
- Chang H. & Huang P. J. Thermo-Raman Studies on Anatase and Rutile. Journal of Raman Spectroscopy 29, 97–102 (1998). [Google Scholar]
- Meng F. & Lu F. Pure and silver (2.5–40 vol%) modified TiO2 thin films deposited by radio frequency magnetron sputtering at room temperature: Surface topography, energy gap and photo-induced hydrophilicity. Journal of Alloys and Compounds 501, 154–158 (2010). [Google Scholar]
- Patterson A. L. The scherrer formula for X-ray particle size determination. Physical Review 56, 978–982 (1939). [Google Scholar]
- Zuo J., Keil P. & Grundmeier G. Synthesis and characterization of photochromic Ag-embedded TiO2 nanocomposite thin films by non-reactive RF-magnetron sputter deposition. Applied Surface Science 258, 7231–7237 (2012). [Google Scholar]
- Torrell M. et al. Functional and optical properties of Au:TiO2 nanocomposite films: The influence of thermal annealing. Applied Surface Science 256, 6536–6542, doi: 10.1016/j.apsusc.2010.04.043 (2010). [DOI] [Google Scholar]
- Seery M. K., George R., Floris P. & Pillai S. C. Silver doped titanium dioxide nanomaterials for enhanced visible light photocatalysis. Journal of Photochemistry and Photobiology A: Chemistry 189, 258–263, doi: 10.1016/j.jphotochem.2007.02.010 (2007). [DOI] [Google Scholar]
- Radnik J., Mohr C. & Claus P. On the origin of binding energy shifts of core levels of supported gold nanoparticles and dependence of pretreatment and material synthesis. Physical Chemistry Chemical Physics 5, 172–177; 10.1039/B207290D (2003). [DOI] [Google Scholar]
- Swift P. Adventitious carbon—the panacea for energy referencing? Surface and Interface Analysis 4, 47–51; 10.1002/sia.740040204 (1982). [DOI] [Google Scholar]
- Park M.-S. & Kang M. The preparation of the anatase and rutile forms of Ag–TiO2 and hydrogen production from methanol/water decomposition. Materials Letters 62, 183–187, doi: 10.1016/j.matlet.2007.04.105 (2008). [DOI] [Google Scholar]
- Al-Kuhaili M. F. Characterization of thin films produced by the thermal evaporation of silver oxide. Journal of Physics D: Applied Physics 40, 2847 (2007). [Google Scholar]
- Akgun B., Durucan C. & Mellott N. Effect of silver incorporation on crystallization and microstructural properties of sol-gel derived titania thin films on glass. Journal of Sol-Gel Science and Technology 58, 277–289; 10.1007/s10971-010-2388-1 (2011). [DOI] [Google Scholar]
- Chang Y. Y., Shieh Y. N. & Kao H. Y. Optical properties of TiO 2 thin films after Ag ion implantation. Thin Solid Films 519, 6935–6939 (2011). [Google Scholar]
- Tian G. et al. Investigation on microstructure and optical properties of titanium dioxide coatings annealed at various temperature. Optical Materials 28, 1058–1063 (2006). [Google Scholar]
- Navarro V., Rodríguez De La Fuente O., Mascaraque A. & Rojo J. M. Reduced hardness at the onset of plasticity in nanoindented titanium dioxide. Physical Review B - Condensed Matter and Materials Physics 78 (2008). [Google Scholar]
- Martin N., Rousselot C., Rondot D., Palmino F. & Mercier R. Microstructure modification of amorphous titanium oxide thin films during annealing treatment. Thin Solid Films 300, 113–121 (1997). [Google Scholar]
- Meng F. & Sun Z. A mechanism for enhanced hydrophilicity of silver nanoparticles modified TiO2 thin films deposited by RF magnetron sputtering. Applied Surface Science 255, 6715–6720, doi: 10.1016/j.apsusc.2009.02.076 (2009). [DOI] [Google Scholar]
- Disdier J., Herrmann J.-M. & Pichat P. Platinum/titanium dioxide catalysts. A photoconductivity study of electron transfer from the ultraviolet-illuminated support to the metal and of the influence of hydrogen. Journal of the Chemical Society, Faraday Transactions 1: Physical Chemistry in Condensed Phases 79, 651–660; 10.1039/F19837900651 (1983). [DOI] [Google Scholar]
- Eunah K., Zhong-Tao J. & Kwangsoo N. Measurement and Calculation of Optical Band Gap of Chromium Aluminum Oxide Films. Japanese Journal of Applied Physics 39, 4820 (2000). [Google Scholar]
- Lee K.-C., Lin S.-J., Lin C.-H., Tsai C.-S. & Lu Y.-J. Size effect of Ag nanoparticles on surface plasmon resonance. Surface and Coatings Technology 202, 5339–5342, doi: 10.1016/j.surfcoat.2008.06.080 (2008). [DOI] [Google Scholar]
- Yu J., Xiong J., Cheng B. & Liu S. Fabrication and characterization of Ag–TiO2 multiphase nanocomposite thin films with enhanced photocatalytic activity. Applied Catalysis B: Environmental 60, 211–221, doi: 10.1016/j.apcatb.2005.03.009 (2005). [DOI] [Google Scholar]
- Machlin E. Materials Science in Microelectronics I: The Relationships Between Thin Film Processing & Structure. 2 edn (Elsevier Science, 2005). [Google Scholar]
- Hasan M. M., Haseeb A. S. M. A., Saidur R., Masjuki H. H. & Hamdi M. Influence of substrate and annealing temperatures on optical properties of RF-sputtered TiO2 thin films. Optical Materials 32, 690–695 (2010). [Google Scholar]
- Ben Naceur J., Gaidi M., Bousbih F., Mechiakh R. & Chtourou R. Annealing effects on microstructural and optical properties of Nanostructured-TiO2 thin films prepared by sol-gel technique. Current Applied Physics 12, 422–428 (2012). [Google Scholar]
- György E. et al. Anatase phase TiO2 thin films obtained by pulsed laser deposition for gas sensing applications. Applied Surface Science 247, 429–433 (2005). [Google Scholar]
- Shukla G., Mishra P. K. & Khare A. Effect of annealing and O2 pressure on structural and optical properties of pulsed laser deposited TiO2 thin films. Journal of Alloys and Compounds 489, 246–251 (2010). [Google Scholar]
- Jaing C. C., Chen H. C. & Lee C. C. Effects of thermal annealing on titanium oxide films prepared by ion-assisted deposition. Optical Review 16, 396–399 (2009). [Google Scholar]
- Nair J., Nair P., Mizukami F., Oosawa Y. & Okubo T. Microstructure and phase transformation behavior of doped nanostructured titania. Materials Research Bulletin 34, 1275–1290 (1999). [Google Scholar]
- Mai L. et al. Synthesis and bactericidal ability of Ag/TiO2 composite films deposited on titanium plate. Applied Surface Science 257, 974–978 (2010). [Google Scholar]
- Chai L. y., Wei S. w., Peng B. & Li Z. y. Effect of thermal treating temperature on characteristics of silver-doped titania. Transactions of Nonferrous Metals Society of China (English Edition) 18, 980–985 (2008). [Google Scholar]
- Hong-Liang F., Xiao-Yong G., Zeng-Yuan Z. & Jiao-Min M. Study on the crystalline structure and the thermal stability of silver-oxide films deposited by using direct-current reactive magnetron sputtering methods. Journal of the Korean Physical Society 56, 1176–1179 (2010). [Google Scholar]
- Meng F., Lu F., Sun Z. & Lü J. A mechanism for enhanced photocatalytic activity of nano-size silver particle modified titanium dioxide thin films. Sci. China Technol. Sci. 53, 3027–3032; 10.1007/s11431-010-4116-z (2010). [DOI] [Google Scholar]
- Orendorz A. et al. Phase transformation and particle growth in nanocrystalline anatase TiO2 films analyzed by X-ray diffraction and Raman spectroscopy. Surface Science 601, 4390–4394 (2007). [Google Scholar]
- Nakaruk A., Ragazzon D. & Sorrell C. C. Anatase-rutile transformation through high-temperature annealing of titania films produced by ultrasonic spray pyrolysis. Thin Solid Films 518, 3735–3742 (2010). [Google Scholar]
- Long H., Yang G., Chen A., Li Y. & Lu P. Growth and characteristics of laser deposited anatase and rutile TiO2 films on Si substrates. Thin Solid Films 517, 745–749 (2008). [Google Scholar]
- Traversa E. et al. Sol-gel preparation and characterization of Ag-TiO2 nanocomposite thin films. Journal of Sol-Gel Science and Technology 19, 733–736 (2000). [Google Scholar]
- Wang X., Hou X., Luan W., Li D. & Yao K. The antibacterial and hydrophilic properties of silver-doped TiO2 thin films using sol–gel method. Applied Surface Science 258, 8241–8246, doi: 10.1016/j.apsusc.2012.05.028 (2012). [DOI] [Google Scholar]
- Meng F., Sun Z. & Song X. Influence of Annealing and UV Irradiation on Hydrophilicity of Ag-TiO. Journal of Nanomaterials 2012, 7; 10.1155/2012/310514 (2012). [DOI] [Google Scholar]
- Sanders D. M. & Anders A. Review of cathodic arc deposition technology at the start of the new millennium. Surface and Coatings Technology 133–134, 78–90 (2000). [Google Scholar]
- Anders A. et al. High quality ZnO:Al transparent conducting oxide films synthesized by pulsed filtered cathodic arc deposition. Thin Solid Films 518, 3313–3319 (2010). [Google Scholar]
- Horcas I. et al. WSXM: A software for scanning probe microscopy and a tool for nanotechnology. Review of Scientific Instruments 78 (2007). [DOI] [PubMed] [Google Scholar]


