Abstract
Objective
The relationship between muscle force production in ALS SOD1G93A mice and single and modeled multifrequency electrical impedance myography (EIM) parameters is unknown. We evaluated the relationship between multifrequency EIM data and paw grip and in situ force measurements, as well to standard measures in including body weight and compound motor action potential (CMAP) amplitude.
Methods
Twenty-nine SOD1 G93A mice aged 13-18 weeks (approximately 4-5 per week) and a group of similarly aged wild-type mice (N=7) were studied with single and multifrequency EIM, CMAP, front and hind-limb paw grip measures, and in situ force measurements of the gastrocnemius.
Results
Significant differences among WT, presymptomatic, and symptomatic ALS animals were identified for all standard measures and single 50 kHz frequency EIM parameters. Of the modeled multifrequency measures, the center frequency, fc, an index of cell size, showed the strongest relationship to force output. The two other multifrequency parameters corresponding to cell size distribution and cell density showed consistent although mostly non-significant differences.
Conclusion
Reductions in force are reflected in single 50 kHz impedance values and in the fc. These data support the construct validity of EIM as an assessment tool of muscle dysfunction in diseases associated with motor neuron loss.
Keywords: motor neuron disease, amyotrophic lateral sclerosis, compound motor action potential amplitude, electrical impedance, force
INTRODUCTION
Pharmacodynamic biomarkers to evaluate disease progression and response to therapy are needed for studies in motor neuron diseases, including amyotrophic lateral sclerosis (ALS) and spinal muscular atrophy (SMA) for both preclinical animal testing and in human clinical trials (1,2). Effective biomarkers could offer greater sensitivity to drug effects than standard outcomes measures such as the ALS Functional Rating Scale-Revised, strength testing, timed functional tests (such as the 6-minute walk) and forced vital capacity. However, for such biomarkers to be useful, not only do they need to track disease effectively, they also must relate strongly to valid clinical measures.
One biomarker with potential value is electrical impedance myography (EIM). In EIM, a weak, high-frequency electrical current is passed through a small region of muscle and the consequent surface voltages measured (3). Alterations in these voltages, described by three parameters, resistance, reactance, and phase, provide data on the changes in muscle condition, including progressive muscle fiber atrophy. Work to date has shown that EIM values do correlate broadly to functional measures in human subjects, such as strength, as measured by handheld dynamometry, in both ALS (4) and SMA (5). Analogous studies in mice have also shown clear alteration in EIM values with disease progression and to simple functional measures, such as the paw grip endurance test (6).
Despite these findings, the relationship between muscle force output and EIM values in such diseases has not been studied. Moreover, most of the data collected thus far has utilized single frequency impedance values or non-specific multifrequency parameters (7,8). However, there is available for analysis a group of multifrequency impedance parameters that are based on the standard Cole impedance model, which stand as a foundational concept in the field of electrical bioimpedance (9). This model, described decades ago, offers additional morphological insights into the underlying state of the tissue. These parameters, include the center frequency (fc ), an indicator of cell size, the alpha parameter (α), an indicator of cell size distribution, and resistance at 0 Hz relative to infinite frequency (R0/R∞), an indicator of cell density. Thus, in this study we investigate the relationship between actual muscle dynamics, measured in situ and via paw grip strength testing, and single and multifrequency EIM data in a group of healthy and ALS SOD1G93A mice; in addition, we perform a comparison to a standard measure of disease: compound motor action potential (CMAP) amplitude. The expectation is that such insights could lead to more informed application of impedance measures and their relevance to predicted outcomes in animal motor neuron disease models and in human subjects.
MATERIALS AND METHODS
Animals
Beth Israel Deaconess Institutional Animal Care and Use Committee approval was obtained prior to the initiation of any studies. Breeding pairs of ALS (B6SJL-Tg(SOD1-G93A)1Gur/J) mice were obtained from Jackson Laboratories (Bar Harbor, ME) and bred to obtain 29 animals (approximately half female and half male, see Table 1). In order to study animals with varying force production capability, animals were aged until the period of progressive clinical weakness developed—beginning at approximately 13 weeks onward until 18 weeks of age. Taking this approach allowed us to gather a well-proportioned cohort of 13-18-week-old ALS animals, providing an evenly distributed range of force capabilities. A group of four 17-week-old and 3 18-week-old animals WT animals (3 male and 4 female) were also studied. Since the in situ force measurements to be performed on the animals involved a non-survival surgery (see details below), EIM measurements and muscle force generation experiments were performed at the same session and animals sacrificed immediately after the completion of measurements. Thus, unlike most studies assessing disease progression, the animals were not followed longitudinally.
Table 1.
Breakdown of number of animals by sex and age
| Weeks of age | 13 | 14 | 15 | 16 | 17 | 18 | Total | |
|---|---|---|---|---|---|---|---|---|
| ALS | Male | 2 | 3 | 2 | 4 | 3 | 0 | 14 |
| Female | 2 | 2 | 2 | 3 | 2 | 4 | 15 | |
|
| ||||||||
| Total ALS | 4 | 5 | 4 | 7 | 5 | 4 | 29 | |
|
| ||||||||
| WT | Male | 3 | 1 | 4 | ||||
| Female | 1 | 2 | 3 | |||||
|
| ||||||||
| Total WT | 4 | 3 | 7 | |||||
Motor score
A standard motor score assessment was performed to determine clinical disease onset prior to any other measurements. A score of 4 was given for animals with no sign of motor dysfunction (these were considered presymptomatic); a score of 3 was given for animals with tremors when suspended by the tail; a score of 2 was given when the animals had mild difficulty ambulating; a score of 1 provided when they were dragging at least one of their hind limbs (all scores of 1-3 were considered symptomatic); animals with no strength in either hind limb were sacrificed and not used in the study.
Additional strength measurements
The front and hind paw grip strength were measured by a grip strength meter single computerized sensor with standard pull bars (CAT # 1027CSM, Columbus Instruments, Columbus, OH). The animal was allowed to grasp a small bar connected to a sensitive force transducer. Holding the lower back of the animal, the investigator (JL) pulled the animal away from the bar until it lost its grip. The maximum force recorded out of 5 trials was recorded. This was performed separately on both the fore and hind limbs.
Animal preparation for EIM/CMAP and in situ force testing
Impedance and in situ force experiments were performed under 1-2% inhaled isoflurane anesthesia delivered by nosecone, with body and muscle temperature being maintained by a heating pad (37°C). The fur on the left hind limb was clipped and a depilatory agent applied to the skin to remove all remaining fur. Then the skin was cleaned with 0.9% saline solution. The leg was taped to the measuring surface at an approximately 45° angle extending out from the body in preparation for measurements.
CMAP amplitude
CMAP was performed using a TECA Synergy T2 EMG Monitor System (Viasys, Inc Madison, WI) on the left hind limb stimulating the sciatic nerve at the sciatic notch and recording via ring electrodes (Catalogue # 9013S0312, Natus Neurology, Middleton, Wisconsin, USA).around the entire distal leg (encompassing both the anterior and posterior compartments of the leg), with a ground electrode placed on the right hind paw, as previously described (8). Stimulation was increased until a supramaximal response was obtained and amplitude measured.
EIM measurements
An impedance analyzer (EIM1103, Skulpt Inc., San Francisco, California, USA) was used to obtain multi-frequency data at frequencies between 1 kHz and 1 MHz. With the animal in a prone position, the electrode array, which consisted of four stainless parallel steel strips affixed to a molded plastic base, was placed over the midpoint of the gastrocnemius muscle, as previously described (10).
In situ force measurement
Immediately after CMAP and EIM measurements, a non-survival surgery was performed in which the left gastrocnemius muscle was exposed. The calcaneal tendon was then cut at its insertion point and dissected away from the underlying fascia and soleus muscle. The tendon was then connected to a force lever arm (described in more detail below) and the leg stabilized by inserting a disposable monopolar needle (902-DMF37-S, Natus neurology, Middleton, Wisconsin, USA) through the knee joint, being careful not to injure any nerves. A small needle electrode array was placed in the muscle for measuring real-time impedance change with contraction to be used for an unrelated study. Twitch force was recorded with a 200 μs square pulse stimulated at different rates delivered to insulated electrocardiogram needles (F-E2M-48, Grass Technologies, Warwick, Rhode Island, USA) stimulating the sciatic nerve at the sciatic notch.
We used a high-speed servomotor-based apparatus (Model 305C, Aurora Scientific, Aurora, Ontario, Canada) to measure force and force-velocity outputs. The output force-length signals from the lever system were interfaced to our PC-platform integrating a PXIe-8135 quad-core processor based embedded controller and a two-channel acquisition board PXI-4461 from National Instruments (Austin, Texas, USA). A custom program controlled the lever arm movement and output of a biphasic pulses current muscle stimulator (Model 701, Aurora Scientific).
Stimulation current and muscle resting tension were adjusted to maximize tetanic force; optimal length, L0, was measured with digital calipers as the distance between the knee and the calcaneal tendon. Optimal current and resting tension were determined by maximizing the force produced by a single stimulus pulse. All subsequent isometric data were collected at this stimulation current and resting tension. Tetanic force frequency relationship was recorded after stimulation by a train of square wave stimuli of 200 ms. At the conclusion of all studies, the animals were sacrificed via a stream of carbon dioxide.
Muscle weight
Excised gastrocnemius muscle was measured with a standard analytical balance after removal from the animal.
Data analyses
Multifrequency measures
The modeled multifrequency EIM measurements were then derived. The details of these calculations are provided elsewhere (11) but the 3 parameters of interest include in the center frequency, fc, the dispersion coefficient, α, and the cell density, R0/R∞. Single frequency (50 kHz) values were also extracted from the data set.
Force measures
The force measures of interest included the maximum isometric force (Fmax) and maximum shortening velocity (Vmax).
Comparative and correlative analyses
Animals were grouped by their motor score into either normal (a score of 4), and those with some degree of clinical weakness (scores 1-3). These two groups of animals were also compared to the group of wild-type animals using one-way ANOVA with Tukey-Kramer post-hoc tests. In addition to these simple comparisons, we also performed parametric correlation analyses across the ALS animals alone (without the wild-type) comparing standard measures and the EIM data.
RESULTS
Standard, non-force parameters
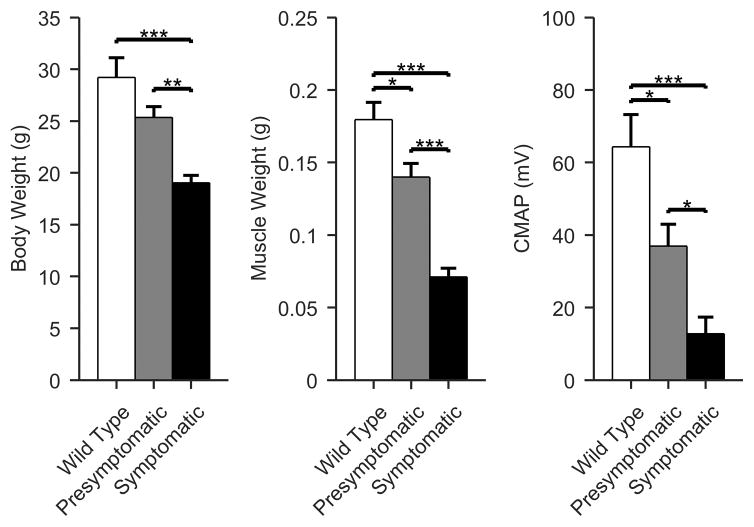
Figure 1 shows column plots demonstrating significant differences among the three groups (ANOVA p < 0.001) assessing standard parameters including standard non-force related measures (body weight, muscle weight, and CMAP) As can be seen there are highly significant differences between the WT and symptomatic and between presymptomatic and symptomatic; however, differences between WT and presymptomatic are smaller, and in the case of body weight, the difference is non-significant.
Figure 1.
Comparison of standard parameters including body weight, excised muscle weight, and CMAP. Note that the differences between WT and presymptomatic animals were less significant than between presymptomatic and symptomatic animals. (Mean +/- standard error of mean; White, WT; gray, presymptomatic; black, symptomatic; *p < 0.05, **p < 0.01, ***p <0.001).
Force differences
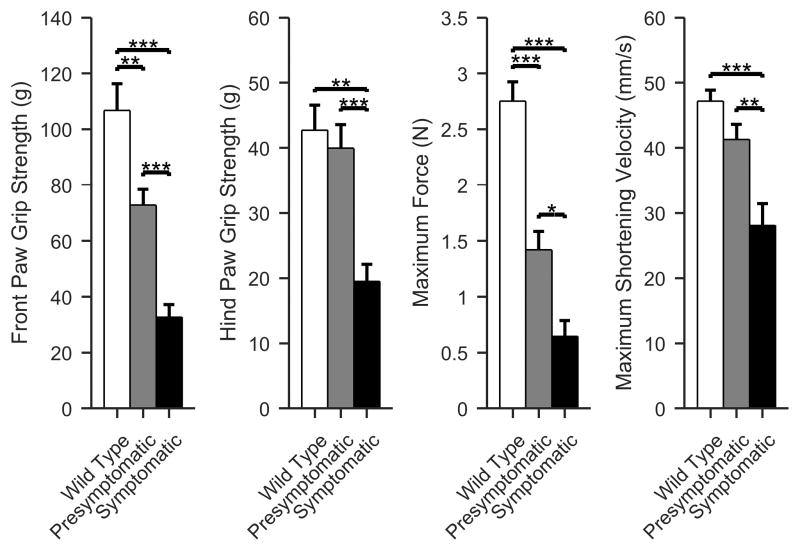
The force differences follow the same basic pattern as the standard non-force parameters (Figure 2, ANOVA p < 0.001). The maximum force measurement shows the greatest difference between WT and presymptomatic animals; front paw grip strength performs similarly.
Figure 2.
Force parameters, including front and hind limb paw grip strength, maximum force and maximum shortening velocity. As with the basic parameters shown in Figure 1, generally the differences between the presymptomatic and symptomatic animals are greater than between the wild type and presymptomatic animals. (Mean +/- standard error of mean; White, WT; gray, presymptomatic; black, symptomatic; *p < 0.05, **p < 0.01, ***p <0.001).
50 kHz frequency EIM differences
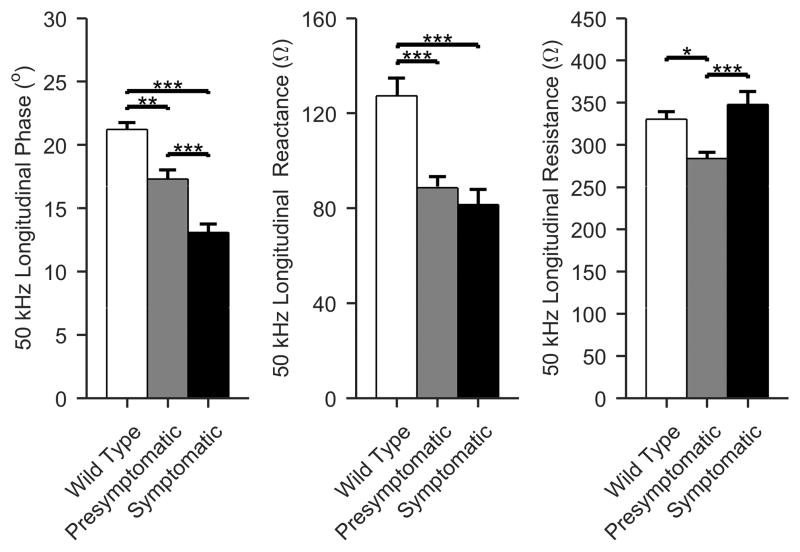
Figure 3 provides single frequency 50 kHz data. Again, the same trend is followed for phase and reactance values (ANOVA p < 0.001 for all); the differences in resistance are less straightforward to explain, however, and are discussed below.
Figure 3.
Single frequency (50 kHz) EIM values. As previously described, the 50 kHz phase values show the greatest differences between all 3 groups of virtually any measure, including body weight, muscle weight, and all force measurements. The reactance also fares fairly well; however, the resistance values are less consistent. See the discussion for potential explanations for these variations. (Mean +/- standard error of mean; White, WT; gray, presymptomatic; black, symptomatic; *p < 0.05, **p < 0.01, ***p <0.001).
Modeled multifrequency EIM values
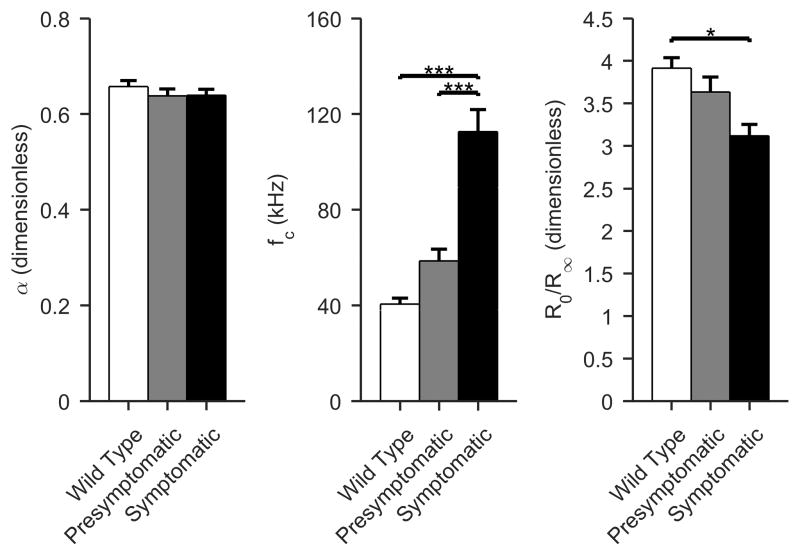
The modeled multifrequency values showed changes in the expected directions, but not all were significant (ANOVA p < 0.001 for fc, p = 0.65 for α, and p = 0.025 for R0/R∞; Figure 4). For fc there were increases in presymptomatic and symptomatic animals as compared to wild type; fc would be expected to increase with cell size, so the observed change is consistent with the expected results. For the dispersion coefficient, α, one anticipates decreasing values, consistent with increasing heterogeneity in muscle fiber size. While these did occur, the changes were modest and non-significant. And for R0/R∞, the expected reduction, corresponding to decreasing cell density was observed, although again, the significance was lower than that for single frequency measures.
Figure 4.
Multifrequency Cole impedance parameters. The parameters alter in the expected direction with the alpha parameter (α) decreasing slightly though non-significantly (consistent with reduced uniformity of cell size), fc increasing significantly, consistent with marked reduction in cell size, and, and R0/R∞ showing a modest reduction, consistent with decreasing cell density. (Mean +/- standard error of mean; White, WT; gray, presymptomatic; black, symptomatic; *p < 0.05, **p < 0.01, ***p <0.001).
Correlations between single-frequency and modeled multifrequency EIM parameters
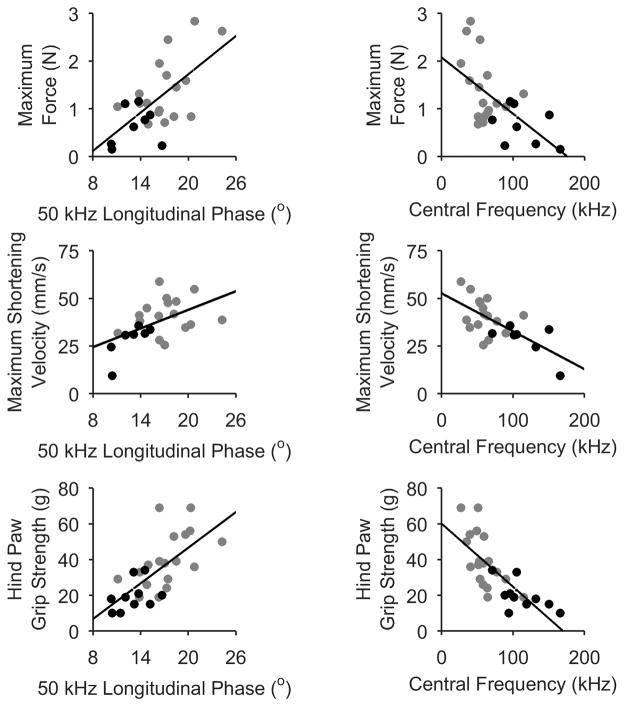
Table 2 provides complete correlation data between the groups and Figure 5 highlights some of the more interesting relationships. As can be seen, for the most part, the simple 50 kHz data provides the strongest correlations. Nonetheless, the fc shows some potential value, consistent with its ability to identify fiber atrophy; for example, both Vmax and hind paw grip strength correlate more strongly to fc than to 50 kHz phase.
Table 2.
Correlations between impedance parameters and standard and force measures
| 50 kHz Phase | 50 kHz Reactance | 50 kHz Resistance | Central Frequency (fc) | Alpha (α) | R0/R∞ | |
|---|---|---|---|---|---|---|
| Body Weight | 0.72*** | 0.39* | -0.48* | -0.66*** | 0.14 | 0.34 |
| Muscle Weight | 0.77*** | 0.34 | -0.61*** | -0.76*** | 0.07 | 0.38 |
| CMAP | 0.67*** | 0.40* | -0.34 | -0.66*** | -0.05 | 0.36 |
| FPGS | 0.70*** | 0.29 | -0.57*** | -0.70*** | 0.26 | 0.38 |
| HPGS | 0.69*** | 0.42* | -0.38* | -0.75*** | -0.11 | 0.48 |
| Fmax | 0.64*** | 0.29 | -0.46* | -0.60*** | -0.12 | 0.29 |
| Vmax | 0.52* | 0.23 | -0.45* | -0.68*** | -0.19 | 0.49* |
p < 0.05,
p <0.001
Figure 5.
Correlations showing the relationships between EIM 50 kHz phase, fc, and standard measures in ALS mice only. Black points represent symptomatic animals, gray presymptomatic. Associated R and p values are provided in Table 2.
DISCUSSION
This study has revealed a close relationship between EIM data and a variety of force values for the ALS mouse. In addition, this is the first study to evaluate modeled multifrequency impedance parameters (fc, R0/R∞, and α) in ALS animals and their relationship to force production. Our data show that of the modeled parameters, the fc is the only one that shows strong correlations to the force parameters, although the other two do alter in the expected directions, with reductions in R0/R∞ and α.
The origin of the impedance alterations described here is fairly straightforward. Denervation produces marked muscle fiber atrophy, which directly alters the impedance characteristics of the muscle. These include a reduction in the measured reactance, an increase in the resistance, and thus a consequent reduction in the phase value (which is calculated via the equation phase = arctan(reactance/resistance)), most easily observed at single frequencies (e.g., 50 or 100 kHz, the frequencies most commonly evaluated). One single-frequency result observed in this data but not previously described is that resistance actually appears lower in the presymptomatic ALS mice than in the wild type. The explanation for this is not immediately clear, however, it is possible that early denervation could lead to increased intramuscular water, corresponding to the increased T2 signal on magnetic resonance imaging that has been described in denervated muscle (12). As the muscle atrophies further, this reduction in resistance reverses as the muscle size decreases further. In addition, the multifrequency characteristics of the impedance spectrum change dramatically in disease, as we have previously demonstrated most clearly in SOD1 G93A rats (7). However, to date, we have not studied any of the standard modeled Cole impedance parameters described here. Of these 3 standard Cole parameters, it appears that fc, which presumably provides an index of muscle fiber size, is most significantly altered, consistent with marked muscle fiber atrophy that develops in ALS.
Of interest is the fact that the correlation between EIM and the in situ gastrocnemius force is fairly similar to that obtained between EIM and front paw grip force. Indeed, the direct correlation between the gastrocnemius in situ force and front paw grip force is also strong (r=0.63, p< 0.001). It is also interesting that the hind limb paw grip correlates less strongly with the EIM values. We believe that the explanation for this is simple: performing the hind paw grip strength measurements is less reliable than front paw measurements; indeed hind paw grip strength correlates non-significantly with the in situ gastrocnemius measurements (r= 0.30, p =0.086).
One important aspect to the significance of these identified relationships is that they support that much of the weakness in these mice is due to peripheral motor neuron loss and consequent muscle atrophy, consistent with previous work (13). If central nervous system disease were playing a substantial role, one would expect a considerably more modest reduction in impedance values and potential poor correlation to the observed forces. Some reductions might be expected, as disuse atrophy second to primary central disease could impact the EIM data to some extent (14,15). Moreover, the relationship between in situ force and paw grip strength would also likely be weak.
As we have shown previously (7,8), the EIM values correlate strongly with CMAP and thus it is not that surprising that both CMAP and EIM have relatively similar correlations to force. A major advantage of EIM over CMAP, however, is that the technique requires no nerve stimulation and thus can be performed on proximal muscles, including paraspinal muscles and proximal appendicular muscles, as well the tongue. Moreover, since the nerve itself does not need to be stimulated, one additional source of potential error is removed (e.g., from submaximal stimulation).
This study has several important limitations. First and most obvious is the fact that because the in situ measurements required animal sacrifice the data collected here were of necessity cross-sectional—each animal only being studied once. For a pharmacodynamic biomarker to be useful (i.e. one that measures the effect of a therapy), it would need to be followed longitudinally in the same animal. This has already been pursued in several previous studies (7,8,16) and our goals here were to identify the relationship and clinical meaning of the observed changes, another important characteristics of a useful biomarker, but did not include the identification of whether EIM outperforms other biomarkers of disease progression in the ALS G93A mouse model. Second, we have only evaluated a single disease—namely ALS that produces profound weakness as it progresses. It is not possible to predict how this would hold for other conditions with certainty, although similar relationships with SMA, for example, are likely given that prominent motor neuron loss and subsequent muscle atrophy are major aspects of the pathology in both conditions. Third, we have not attempted to relate the multifrequency parameters to the pathological condition of the muscle itself. Given the severe muscle fiber atrophy that accompanies ALS, characterizing fiber size and density would have been extraordinarily challenging. Finally, it is important to recognize that all the tissues under the electrodes will contribute to the measured impedance values, and hence the calculated modeled parameters as well. Nevertheless, since the electrical current passes preferentially through the more highly conductive muscle, the data mainly reflect the characteristics of that tissue and not skin or subcutaneous fat.
In conclusion, this study support that there is a strong association between the force generating capability of muscle and single frequency EIM data as well as to the center frequency, fc, an indicator of cell size. This information provides useful insights to assist with the future application of EIM in both animal studies and in human clinical therapeutic trials.
Acknowledgments
This work was funded by the National Institutes of Health R01 NS055099 and the Spinal Muscular Atrophy Foundation.
References
- 1.Bakkar N, Boehringer A, Bowser R. Use of biomarkers in ALS drug development and clinical trials. Brain Res. 2014:1–14. doi: 10.1016/j.brainres.2014.10.031. [DOI] [PMC free article] [PubMed] [Google Scholar]
- 2.Arnold WD, Porensky PN, McGovern VL, Iyer CC, Duque S, Li X, et al. Electrophysiological Biomarkers in Spinal Muscular Atrophy: Preclinical Proof of Concept. Ann Clin Transl Neurol. 2014;1:34–44. doi: 10.1002/acn3.23. [DOI] [PMC free article] [PubMed] [Google Scholar]
- 3.Rutkove SB. Electrical Impedance Myography: Background, Current State, and Future Directions. Muscle Nerve. 2009;40:936–46. doi: 10.1002/mus.21362. [DOI] [PMC free article] [PubMed] [Google Scholar]
- 4.Rutkove SB, Caress JB, Cartwright MS, Burns TM, Warder J, David WS, et al. Electrical impedance myography correlates with standard measures of ALS severity. Muscle and Nerve. 2014;49:441–3. doi: 10.1002/mus.24128. [DOI] [PubMed] [Google Scholar]
- 5.Rutkove SB, Shefner JM, Gregas M, Butler H, Caracciolo J, Lin C, et al. Characterizing spinal muscular atrophy with electrical impedance myography. Muscle Nerve. 2010;42:915–21. doi: 10.1002/mus.21784. [DOI] [PubMed] [Google Scholar]
- 6.Li J, Sung M, Rutkove SB. Electrophysiologic biomarkers for assessing disease progression and the effect of riluzole in SOD1 G93A ALS mice. PLoS One. 2013;8:e65976. doi: 10.1371/journal.pone.0065976. [DOI] [PMC free article] [PubMed] [Google Scholar]
- 7.Wang LL, Spieker AJ, Li J, Rutkove SB. Electrical impedance myography for monitoring motor neuron loss in the SOD1 G93A amyotrophic lateral sclerosis rat. Clin Neurophysiol. 2011;122:2505–11. doi: 10.1016/j.clinph.2011.04.021. [DOI] [PMC free article] [PubMed] [Google Scholar]
- 8.Li J, Sung M, Rutkove SB. Electrophysiologic biomarkers for assessing disease progression and the effect of riluzole in SOD1 G93A ALS mice. PLoS One. 2013;8:e65976. doi: 10.1371/journal.pone.0065976. [DOI] [PMC free article] [PubMed] [Google Scholar]
- 9.Martinsen OG, Grimnes S. Bioimpedance and Bioelectricity Basics. 2. Academic Press; 2008. [Google Scholar]
- 10.Li J, Staats WL, Spieker A, Sung M, Rutkove SB. A technique for performing electrical impedance myography in the mouse hind limb: data in normal and ALS SOD1 G93A animals. PLoS One. 2012;7:e45004. doi: 10.1371/journal.pone.0045004. [DOI] [PMC free article] [PubMed] [Google Scholar]
- 11.Sanchez B, Li J, Yim S, Pacheck A, Widrick JJ, Rutkove SB. Evaluation of Electrical Impedance as a Biomarker of Myostatin Inhibition in Wild Type and Muscular Dystrophy Mice. PLoS One. 2015;10:e0140521. doi: 10.1371/journal.pone.0140521. [DOI] [PMC free article] [PubMed] [Google Scholar]
- 12.Kikuchi Y, Nakamura T, Takayama S, Horiuchi Y, Toyama Y. MR imaging in the diagnosis of denervated and reinnervated skeletal muscles: experimental study in rats. Radiology. 2003;229:861–7. doi: 10.1148/radiol.2293020904. [DOI] [PubMed] [Google Scholar]
- 13.Kent-Braun JA, Walker CH, Weiner MW, Miller RG. Functional significance of upper and lower motor neuron impairment in amyotrophic lateral sclerosis. Muscle Nerve. 1998;21:762–8. doi: 10.1002/(sici)1097-4598(199806)21:6<762::aid-mus8>3.0.co;2-5. [DOI] [PubMed] [Google Scholar]
- 14.Sung M, Li J, Spieker AJ, Spatz J, Ellman R, Ferguson VL, et al. Spaceflight and hind limb unloading induce similar changes in electrical impedance characteristics of mouse gastrocnemius muscle. J Musculoskelet Neuronal Interact. 2013;13:405–11. [PMC free article] [PubMed] [Google Scholar]
- 15.Li J, Spieker AJ, Rosen GD, Rutkove SB. Electrical impedance alterations in the rat hind limb with unloading. J Musculoskelet Neuronal Interact. 2013;13:37–44. [PMC free article] [PubMed] [Google Scholar]
- 16.Li J, Geisbush TR, Arnold WD, Rosen GD, Zaworski PG, Rutkove SB. A comparison of three electrophysiological methods for the assessment of disease status in a mild spinal muscular atrophy mouse model. PLoS One. 2014;9:e111428. doi: 10.1371/journal.pone.0111428. [DOI] [PMC free article] [PubMed] [Google Scholar]


