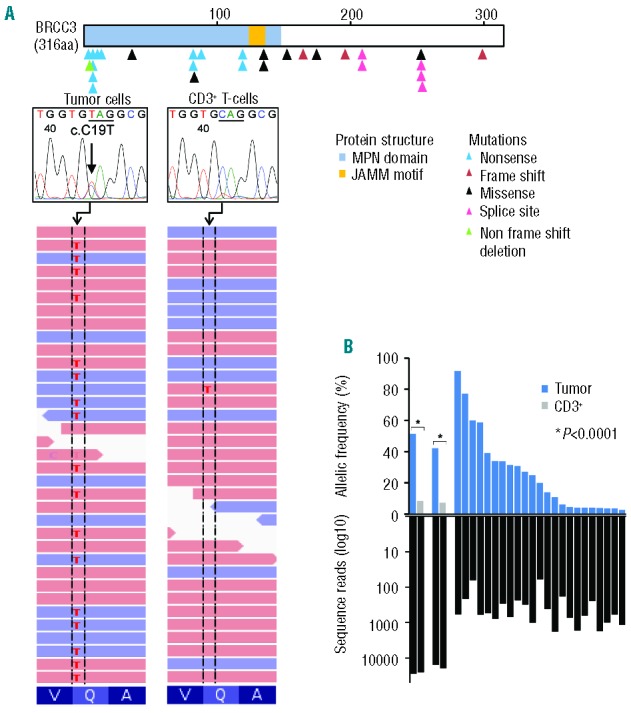
Figure 1.

Somatic BRCC3 mutations as detected by next generation sequencing and Sanger sequencing. (A) Distribution of BRCC3 mutations identified in 28 out of 1444 myeloid neoplasms. Blue, red, black, pink, and green triangles indicate nonsense, frame shift, missense, splice site, and non-frame shift deletion mutations. On the right, a representative mutation (c.C19T, indicated by an arrow) confirmed by whole exome sequencing and Sanger sequencing. (B) (Top) Allelic frequencies in paired bone marrow and CD3+ T-cell samples (n=2) and not paired (n=23) samples as measured by deep sequencing. (Bottom) Depth of coverage of independent reads.
