

Transcription factors that regulate B-cell differentiation are frequently targeted by genetic aberrations in B-cell malignancies. The B-cell translocation gene 1 (BTG1), which encodes a transcription coregulator,1,2 is recurrently affected by gene deletions in B-cell precursor acute lymphoblastic leukemia (BCP-ALL),3–5 and targeted by missense mutations in diffuse large B-cell lymphomas (DLBCL).6,7 Similarly, the closely related BTG2 gene is subject to mutations in DLBCL, Burkitt lymphoma and follicular lymphoma.6–9 To establish the role of BTG1 and BTG2 in B lymphopoiesis, we studied the composition of the hematopoietic compartment in mice deficient for either Btg1 or Btg2, as well as in Btg1;Btg2-double knockout animals. We found that Btg1 and Btg2 are both required at multiple stages of early B-cell development, but also display specific functions in progenitor B-cells. Our data demonstrate that transcriptional cofactors BTG1 and BTG2 act as important regulators of B-cell differentiation, providing an important link to their role as tumor suppressors in B-cell malignancies.
To determine the function of Btg1 and Btg2 during normal hematopoiesis we performed flow cytometric analysis of the bone marrow (BM) compartment and spleen. The fraction of B220+ progenitor B-cells was significantly reduced in Btg1- and Btg2-deficient mice, ranging from a 10% decrease in the Btg2−/− mice, 20% in Btg1−/− mice, to 40% in the Btg1−/−;Btg2−/− double knockout animals relative to control mice (Figure 1A). Similarly, B-cell counts in the spleen were most significantly reduced in Btg1−/−; Btg2−/− mice, with about 30% fewer B220+IgM+ B-cells (Figure 1B). In contrast, the fraction of myeloid progenitor cells in BM was not altered in the Btg1- and Btg2-deficient animals (Online Supplementary Figure S1). In addition, we did not observe any specific defects in T-cell development in mice lacking Btg1 and Btg2 expression (Online Supplementary Figure S2).
Figure 1.
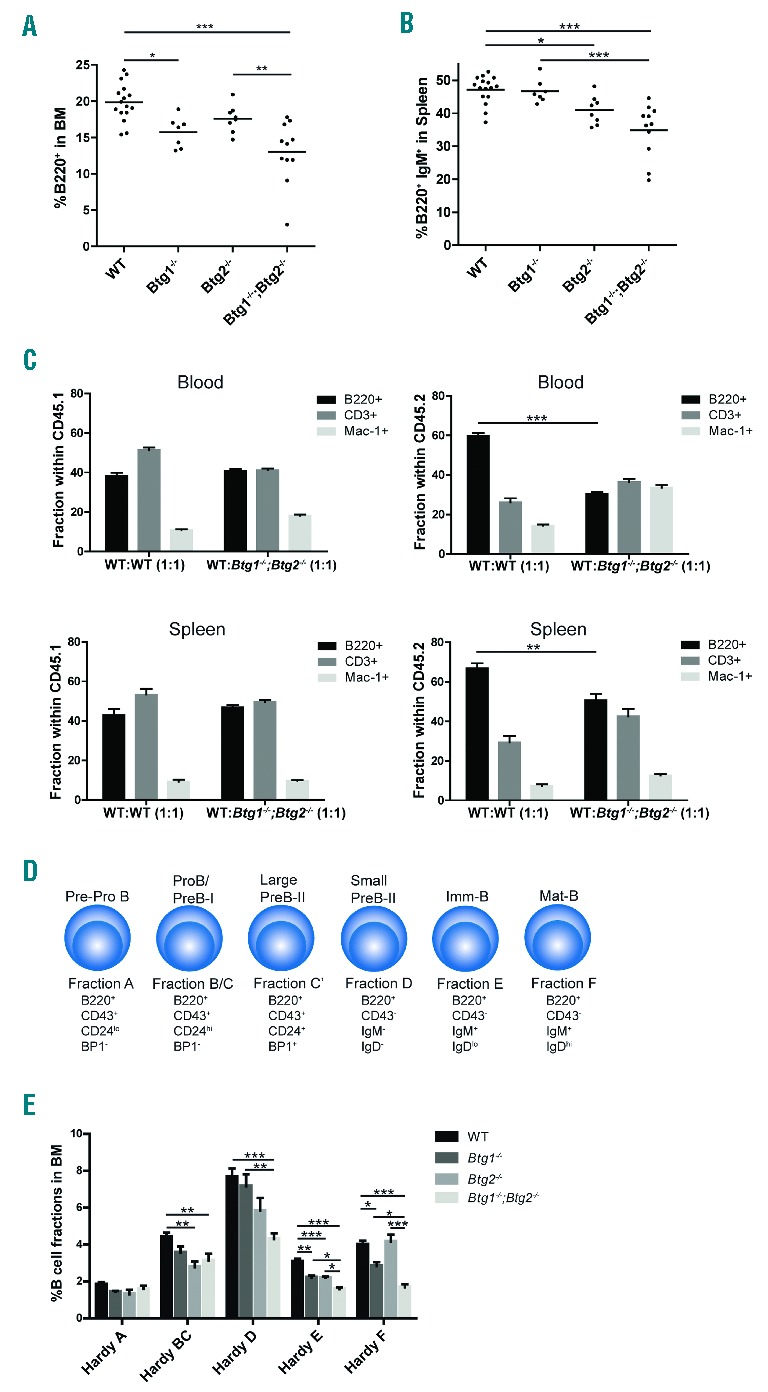
Decreased B-cell numbers in mice deficient for Btg1 and Btg2. (A–B) Flow cytometric analysis was performed on mononuclear cells isolated from bone marrow (BM) and spleen of wild-type (WT) control (n=16), Btg1−/− (n=7), Btg2−/− (n=8) and Btg1−/−;Btg2−/− mice (n=11). The fractions of B220+ BM cells (A) and B220+IgM+ splenocytes (B) are indicated. Each dot represents an individual sample and the horizontal line indicates the mean. (C) Competitive repopulation assay of wild-type and Btg1−/−;Btg2−/− donor cells (CD45.2) derived of BM mixed 1:1 with CD45.1 wild-type cells which were transplanted into 9Gy (Gray) irradiated C57BL6/J mice (CD45.1). Flow cytometric analysis was performed on blood and spleen. The fraction of B220, CD3 and Mac-1 of WT:WT (CD45.1:CD45.1) (n=4) and WT: Btg1−/−; Btg2−/− (CD45.1:CD45.2) (n=6) cells are indicated. (D) Schematic representation of the different B-cell developmental stages according to Hardy nomenclature. Cell surface markers that distinguish specific Hardy fractions are indicated. (E) The percentage for the different Hardy B-cell fractions within BM is indicated as determined in WT control (n=16), Btg1−/− (n=7), Btg2−/− (n=8), and Btg1−/−; Btg2−/− (n=11) mice. Each bar represents the mean of each group of mice ± the standard error of the mean (SEM). *P<0.05, **P<0.01, ***P<0.001.
To assess whether the defect in B lymphopoiesis was not related to defective support from the BM microenvironment in the Btg1 and Btg2 knockout animals, competitive repopulation assays were performed. BM cells derived from either wild-type (CD45.2) or Btg1−/−; Btg2−/− mice (CD45.2) were mixed with competitor wild-type cells (CD45.1) and transplanted into lethally irradiated C57BL6/J mice (CD45.1). FACS analysis on peripheral blood and spleen demonstrated that contribution to the B-cell lineage was significantly reduced using Btg1−/−; Btg2−/− donor cells when compared to wild-type donor cells (Figure 1C), arguing that the observed defect in B-cell development is cell autonomous.
To establish at what stage of early B-cell development Btg1- and Btg2-deficiency affect B-cell differentiation, we investigated the relative frequencies of the different B-cell subsets within the BM compartment. Analysis of the common lymphoid progenitor (CLP) fraction, defined as lineage negative (Lin−) Sca-1+c-Kit+Flt3+Il-7Rα+ cells, revealed no significant differences in Btg1−/−, Btg2−/− and Btg1−/−; Btg2−/− mice compared to wild-type controls (Online Supplementary Figure S3). Next, we employed the cell surface markers B220, CD43, CD24, IgD and IgM, to distinguish different B-cell precursor populations, generally known as Hardy fractions (Figure 1D). When we examined the single knockout animals, the Btg2−/− mice displayed decreased B-cell fractions at both the early and later stages of B-cell differentiation, while Btg1-deficiency resulted only in reduced B-cell fractions beyond the pre-B cell stage, including the immature B-cells (Hardy fractions E and F) (Figure 1E). In the Btg1−/−; Btg2−/− mice, we observed a similar phenotype as the Btg2−/− mice at the early stages of B-lineage differentiation, with a moderate decrease in the pool of pro-B cells (Hardy BC) compared to control mice. However, from the pre-B cell stage onwards, the Btg1−/−; Btg2−/− mice displayed a more pronounced phenotype in comparison to the Btg1−/− and Btg2−/− single knockout animals, showing a 2-fold reduction in the B220+CD43− cell fraction relative to control mice (Hardy D, E and F) (Online Supplementary Figure S4). We conclude from these results that Btg1 and Btg2 are both required for mouse B-cell development, while deficiency for each of the genes shows a different outcome on the relative abundance of the specific Hardy fractions.
To more specifically assess the function of Btg1 and Btg2 in early B lymphopoiesis, we investigated whether interleukin-7 (IL-7) dependent outgrowth of B-lymphoid progenitor cells was affected in the absence of Btg1 and Btg2 expression. BM cells derived from Btg1−/−, Btg2−/− single knockout and Btg1−/−; Btg2−/− double knockout mice were plated in methylcellulose and cultured for one week in the presence of cytokine IL-7. The number of colonies in methylcellulose was about 4-fold lower in cultures derived from Btg1−/− and Btg1−/−; Btg2−/− BM cells relative to those derived from control BM cells (Figure 2A). Moreover, colony size was also reduced in these two knockout genotypes (data not shown). In contrast, Btg2-deficiency had no significant impact on the outgrowth of lymphoid progenitor cells in the IL-7-dependent methylcellulose colony formation assay. Given the fact that the number of B220+ B-cell progenitors was decreased in the BM of the different Btg1 and Btg2 knockout lines, we also analyzed the colony outgrowth of similar amounts of purified CD19+ progenitor B-cells under the same conditions. Again, colony formation was significantly impaired using CD19+ cells derived from Btg1−/− and Btg1−/−; Btg2−/− mice, but not with Btg2−/− progenitor B-cells, which indicates that the loss of Btg1 function is largely responsible for the defective outgrowth of B-lymphoid progenitors (Figure 2B).
Figure 2.
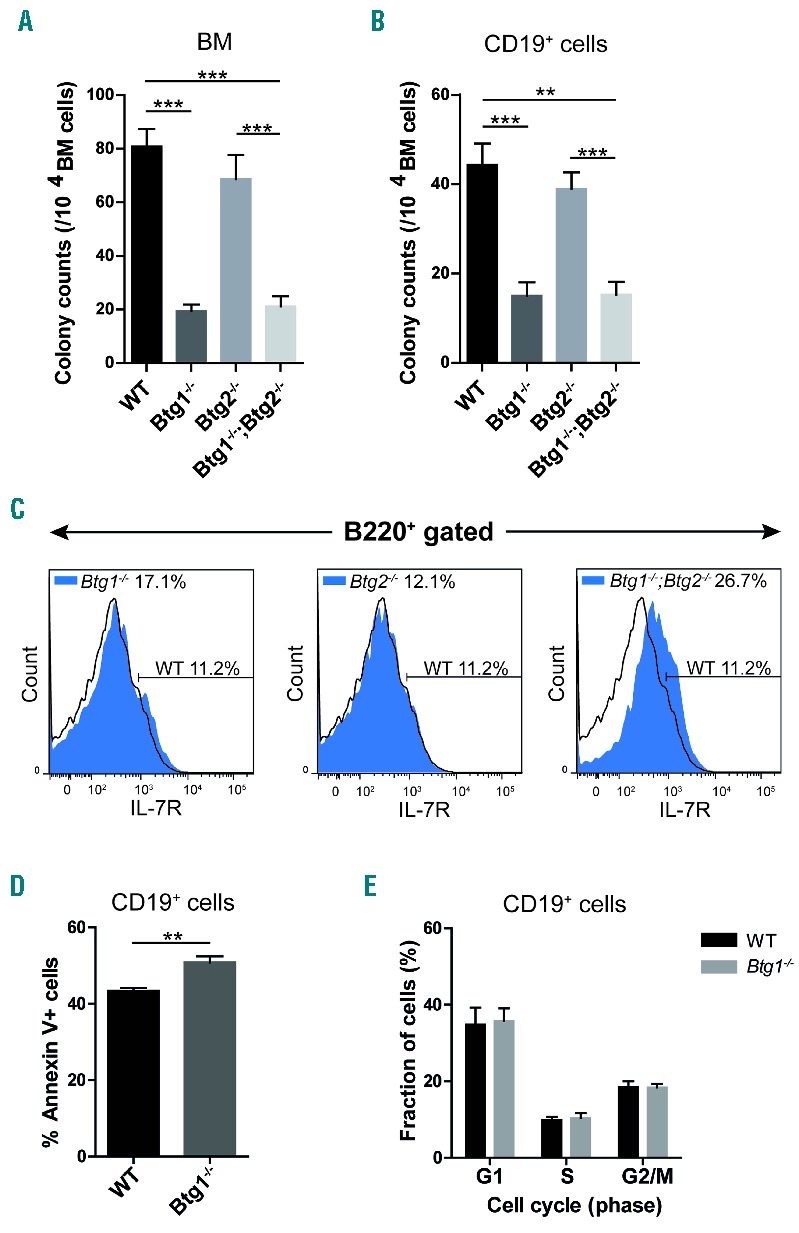
Btg1 stimulates B-cell progenitor outgrowth in response to IL-7. (A) Bone marrow (BM) mononuclear cells (1 × 10⁵ cells) were isolated from wild-type (WT) control (n=18), Btg1−/− (n=7), Btg2−/− (n=8) and Btg1−/−; Btg2−/− mice (n=11) and added in methylcellulose containing 10 ng/mL IL-7. (B) BM mononuclear cells were isolated from WT control (n=10), Btg1−/− (n=7), Btg2−/− (n=4) and Btg1−/−; Btg2−/− mice (n=4) and added after CD19 isolation (2 × 10⁴ CD19+ cells) in methylcellulose containing 10ng/ml IL-7. (A, B) Mean colony counts (and SEM) were determined (>30 cells/colony) after seven days of culture. Data are representative of at least two independent experiments. **P<0.01, ***P<0.001. (C) BM cells from WT, Btg1−/−, Btg2−/−, and Btg1−/−; Btg2−/− mice (all n=2) were stained with B220 and IL-7Rα/CD127 antibodies and the percentage of IL-7Rα-positive cells within the B220+ fraction was determined. The black line indicates IL-7Rα expression in the WT cells, while the blue peak shows the IL-7Rα expression in the Btg1−/−, Btg2−/− and Btg1−/−; Btg2−/− double knockout cells. (D) Apoptosis assay of CD19+ BM cells isolated from WT (n= 4) and Btg1−/− (n=7) cultured for 4 days in B-cell specific medium, by measuring Annexin V using flow cytometry. The percentage of Annexin V-positive cells in CD19+ BM cells is indicated. (E) Proliferation assay of CD19+ BM cells isolated from WT (n= 3) and Btg1−/− (n=3) cultured for 4 days in B-cell specific medium, measuring Ki-67 by flow cytometry. The cell cycle distribution according to Ki-67 staining in CD19+ BM cells is indicated. Each bar represents the mean of each group of mice ± the standard error of the mean (SEM). **P<0.01, ***P<0.001.
To assess whether differences in colony formation could be attributed to reduced expression levels of the IL-7 receptor alpha (IL-7Rα/CD127), CD127 expression was measured on B220+ BM cells by flow cytometry. We observed that IL-7Rα expression was not decreased in Btg1−/− progenitor B-cells, but was even upregulated in Btg1−/−; Btg2−/− cells (Figure 2C), arguing that the low number of colonies due to Btg1-deficiency was not related to reduced IL-7Rα expression levels. Next, we examined whether Btg1-deficient CD19+ cells displayed intrinsic differences in the level of apoptosis and proliferation. We observed a moderate but significant increase in the fraction of Annexin V-positive cells derived from Btg1−/− mice (Figure 2D; Online Supplementary Figure S5), while the cell cycle distribution, as determined by Ki-67 staining, was not affected (Figure 2E). Thus, Btg1 appears to be required for optimal IL-7 dependent B-lymphoid colony formation, in part by promoting cell survival in early progenitor B-cells.
To elucidate how Btg1 and Btg2 regulate B-cell development in vivo, we examined the expression of key transcription factors involved in early B-cell differentiation, including E2a (Tcf3), Foxo1, Ebf1, and Pax5.10,11 Quantitative reverse transcription polymerase reaction (qRT-PCR) on RNA isolated from B220+ sorted BM cells of Btg1−/−, Btg2−/− and Btg1−/−; Btg2−/− mice demonstrated that the expression of these master regulators of B-cell differentiation was not decreased (Figure 3A). On the contrary, mRNA expression levels of these transcription factors were even somewhat elevated in the absence of Btg1 and Btg2. Hence, the partial block in B-cell differentiation observed in the Btg1−/−; Btg2−/− animals cannot be explained by diminished expression levels of these B-lineage transcription factors.
Figure 3.

Aberrant T-lineage gene expression in progenitor B-cells deficient for Btg1 and Btg2. (A) Relative expression levels of B-cell transcription factors E2A (Tcf3), Foxo1, Ebf1 and Pax5 was determined using cDNA generated from B220+ bone marrow (BM) cells of wild type control (WT), Btg1−/−, Btg2−/− and Btg1−/−; Btg2−/−mice by qRT-PCR and normalized to the expression of the housekeeping gene TBP. (B) RNA was isolated from B220+CD43+ and B220+CD43− cells derived from wild type control and Btg1−/−; Btg2−/− mice (n=4) and analyzed by microarray using the Illumina BeadArray platform. The data obtained were RMA normalized and relative gene expression differences of >1.6-fold was determined. KEGG pathway analysis was performed using the online Gene Set Enrichment Analysis (GSEA) tool and relevant pathways with highest P-value that are differentially expressed between WT and Btg1−/−; Btg2−/− cells are indicated. (C) Relative expression levels of Cd4, Ikzf2, Tcf7, Gata3 and Notch1 were determined on cDNA generated from B220+ BM cells of the different genotypes by real-time PCR and normalized to TBP expression. (A and C) Data represent the mean and SEM of three independent experiments containing cDNA derived from 2 different biological samples. *P<0.05, **P<0.01, ***P<0.001.
Next, we performed microarray based gene expression profiling using early (B220+CD43+) and late progenitor B-cells (B220+CD43−) isolated from control and Btg1−/−; Btg2−/− mice and performed Gene Set Enrichment Analyses (GSEA) using the Molecular Signatures Database (MSigDB) to define KEGG pathways that were specifically affected (Figure 3B). Interestingly, several signaling pathways were identified, including the presence of a T-cell receptor signaling signature in early B-cells of Btg1−/−; Btg2−/− mice showing upregulation of Cd3d (Cd3delta) and Cd3g (Cd3gamma) (Online Supplementary Table S1). Therefore, we aimed to assess whether Btg1;Btg2-deficient progenitor B-cells displayed aberrant expression of other T-lineage specific genes, including Cd4, Ikzf2, Tcf7, Gata3 and Notch1. Indeed, qRT-PCR revealed that Btg1−/−; Btg2−/− B220+ BM cells showed significantly increased expression levels of these T-lineage marker genes (Figure 3C), while we also observed higher expression of the CD3, CD4 and CD8 cell surface markers on Btg1−/−; Btg2−/− committed B-cells (Online Supplementary Figure S6). These findings suggest that Btg1 and Btg2 are implicated in regulating B-lineage commitment by suppressing the expression of lineage-inappropriate genes.
In summary, using genetic mouse models, we demonstrate that both Btg1 and Btg2 promote mouse B-cell differentiation at multiple stages of development, and mostly display overlapping functions during B lymphopoiesis, which corresponds with an additive phenotype in the Btg1−/−; Btg2−/− mice. On the other hand, Btg1 fulfills a more prominent role in promoting the proliferative expansion of lymphoid progenitors by inhibiting apoptosis. This is in agreement with the finding that Btg1 ablation in the mouse brain decreases the pool of proliferating stem and progenitor cells, which is accompanied by increased apoptosis.12 Importantly, Btg1 and Btg2 are both required to repress T-lineage gene expression in progenitor B-cells. These findings are partially overlapping with the phenotype observed in Ebf1 and Pax5 knockout mice, where it has been shown that EBF1 and PAX5 are critical regulators of B-lineage specification and commitment by repressing alternative non-B-cell fates.13–15 As the expression of Ebf1 and Pax5 itself is not inhibited in Btg1−/−; Btg2−/− progenitor B-cells, the BTG1 and BTG2 transcriptional coregulators may affect B-lineage commitment by modifying the function of these B-cell specific transcription factors or by epigenetic regulation of their target genes. Notably, PAX5 and EBF1, similar to BTG1, are also subject to gene deletions in BCP-ALL, and combinations of these deletions often co-occur in the same leukemia.4 Together our findings suggest that the block in differentiation observed in BCP-ALL may result from gene alterations affecting multiple master regulators of B-cell differentiation.
Acknowledgments
The authors would like to thank Marieke von Lindern for providing the Btg1 knockout mice, and Felice Tirone for the Btg2 knockout animals. The authors thank the staff of the Central Animal Facility (CDL) and Rob Woestenenk for their technical assistance.
Footnotes
Funding: this research was supported by a grant from the Stichting Kinderen Kankervrij (KiKa-77).
The online version of this letter has a Supplementary Appendix.
Information on authorship, contributions, and financial & other disclosures was provided by the authors and is available with the online version of this article at www.haematologica.org.
References
- 1.Lin WJ, Gary JD, Yang MC, Clarke S, Herschman HR. The mammalian immediate-early TIS21 protein and the leukemia-associated BTG1 protein interact with a protein-arginine N-methyltransferase. J Biol Chem. 1996;271(25):15034–15044. [DOI] [PubMed] [Google Scholar]
- 2.Winkler GS. The mammalian anti-proliferative BTG/Tob protein family. J Cell Physiol. 2010;222(1):66–72. [DOI] [PubMed] [Google Scholar]
- 3.Kuiper RP, Schoenmakers EF, van Reijmersdal SV, et al. High-resolution genomic profiling of childhood ALL reveals novel recurrent genetic lesions affecting pathways involved in lymphocyte differentiation and cell cycle progression. Leukemia. 2007;21(6):1258–1266. [DOI] [PubMed] [Google Scholar]
- 4.Mullighan CG, Goorha S, Radtke I, et al. Genome-wide analysis of genetic alterations in acute lymphoblastic leukaemia. Nature. 2007; 446(7137):758–764. [DOI] [PubMed] [Google Scholar]
- 5.Waanders E, Scheijen B, van der Meer LT, et al. The origin and nature of tightly clustered BTG1 deletions in precursor B-cell acute lymphoblastic leukemia support a model of multiclonal evolution. PLoS Genet. 2012;8(2):e1002533. [DOI] [PMC free article] [PubMed] [Google Scholar]
- 6.Lohr JG, Stojanov P, Lawrence MS, et al. Discovery and prioritization of somatic mutations in diffuse large B-cell lymphoma (DLBCL) by whole-exome sequencing. Proc Natl Acad Sci USA. 2012; 109(10):3879–3884. [DOI] [PMC free article] [PubMed] [Google Scholar]
- 7.Morin RD, Mendez-Lago M, Mungall AJ, et al. Frequent mutation of histone-modifying genes in non-Hodgkin lymphoma. Nature. 2011; 476(7360):298–303. [DOI] [PMC free article] [PubMed] [Google Scholar]
- 8.Love C, Sun Z, Jima D, et al. The genetic landscape of mutations in Burkitt lymphoma. Nat Genet. 2012;44(12):1321–1325. [DOI] [PMC free article] [PubMed] [Google Scholar]
- 9.Pasqualucci L, Khiabanian H, Fangazio M, et al. Genetics of follicular lymphoma transformation. Cell Rep. 2014;6(1):130–140. [DOI] [PMC free article] [PubMed] [Google Scholar]
- 10.Mandel EM, Grosschedl R. Transcription control of early B cell differentiation. Curr Opin Immunol. 2010;22(2):161–167. [DOI] [PubMed] [Google Scholar]
- 11.Ramirez J, Lukin K, Hagman J. From hematopoietic progenitors to B cells: mechanisms of lineage restriction and commitment. Curr Opin Immunol. 2010;22(2):177–184. [DOI] [PMC free article] [PubMed] [Google Scholar]
- 12.Farioli-Vecchioli S, Micheli L, Saraulli D, et al. Btg1 is Required to Maintain the Pool of Stem and Progenitor Cells of the Dentate Gyrus and Subventricular Zone. Front Neurosci. 2012;6:124. [DOI] [PMC free article] [PubMed] [Google Scholar]
- 13.Cobaleda C, Jochum W, Busslinger M. Conversion of mature B cells into T cells by dedifferentiation to uncommitted progenitors. Nature. 2007;449(7161):473–477. [DOI] [PubMed] [Google Scholar]
- 14.Lukin K, Fields S, Guerrettaz L, et al. A dose-dependent role for EBF1 in repressing non-B-cell-specific genes. Eur J Immunol. 2011; 41(6):1787–1793. [DOI] [PMC free article] [PubMed] [Google Scholar]
- 15.Nechanitzky R, Akbas D, Scherer S, et al. Transcription factor EBF1 is essential for the maintenance of B cell identity and prevention of alternative fates in committed cells. Nat Immunol. 2013;14(8):867–875. [DOI] [PubMed] [Google Scholar]