Erythropoiesis stimulating agents (ESA) are generally first-line treatments of anemia in lower risk myelodysplastic syndrome (MDS), yielding response rates of 30 to 60%, median response duration of 20 to 24 months1,2 and a possible survival improvement compared to RBC transfusions alone.1–3 Main consensus prognostic factors of better response to ESA include low or int-1 IPSS, low RBC transfusion burden, and low serum EPO (sEPO).4 Other reported prognostic factors for response to ESA include marrow multilineage dysplasia, flow cytometry scoring,5 ERK and STAT5 phosphorylation in erythroblasts,6,7 and IPSS-R.8
Somatic mutations are found in up to 80% of MDS. Many of them and/or their number have been correlated with outcome irrespective of treatment,9 or after specific treatments like allogeneic SCT10 or hypomethylating agents.11 To our knowledge, however, the prognostic value of somatic mutations in response to ESA has not been assessed. Here, we analyzed whether they predicted results of ESA treatment in lower risk MDS, and added prognostic value to conventional factors.
Seventy-nine lower risk MDS patients treated with ESA by the French (GFM), Italian (FISM) and German (D-MDS) MDS cooperative groups were included based on the availability of all the following data: sEPO, serum ferritin (SF) level, marrow slides for central review by cytomorphologists to evaluate dysplastic features homogeneously, bone marrow DNA, and written informed consent for molecular analysis. To be included, patients should have received high dose ESA, i.e., EPO (60,000 units/week) or darbepoetin (250 to 300 ug/week) for at least 12 weeks, with or without G-CSF. Marrow dysplastic features were reviewed blindly by a panel of cytomorphologists, applying 2008 WHO criteria.11 Ethical approval was obtained by participating groups.
Mutational analysis of the 37 most frequently mutated genes in MDS (listed in Online Supplementary Table S2) was performed on marrow cell DNA collected before ESA treatment, using an Ion AmpliSeq platform (Life Technologies, Carlsbad, USA).12–13 The variant allele frequency (VAF) was calculated by dividing the number of mutated reads by the total number of reads at the position of each mutation. In patients harboring at least 2 mutations, clonal heterogeneity was evaluated by χ2 test to determine if the VAF were significantly different. When several mutations were present, mutations with significantly higher VAF were considered as major, and mutations with significantly lower VAF as minor. In the absence of significantly different VAF, all identified mutations were considered as major.
Erythroid response (HI-E) was defined using IWG 2006 criteria. Logistic regression analysis was used for multivariate analysis of HI-E. Overall survival (OS) from ESA onset and response duration were calculated using the Kaplan-Meier method. A Cox regression model was used to test prognostic factors for response duration and OS.
Of the patients, 26% were RBC transfusion dependent (TD) (Online Supplementary Table S1). In total, 85% of the patients had significant (>10%) dyserythropoiesis, 62% dysgranulopoiesis, and 67% dysmegakaryopoiesis. IPSS was low (45%), int-1 (53%), and not assessable (NA) (2%). IPSS-R was very low (6%), low (58%), intermediate (33%), and NA (2%). HI-E was 64.5%, and median response duration was 19 months, in agreement with previous reports.1,2 RBC transfusion independence (RBC-TI) was achieved in 47% of the TD patients.
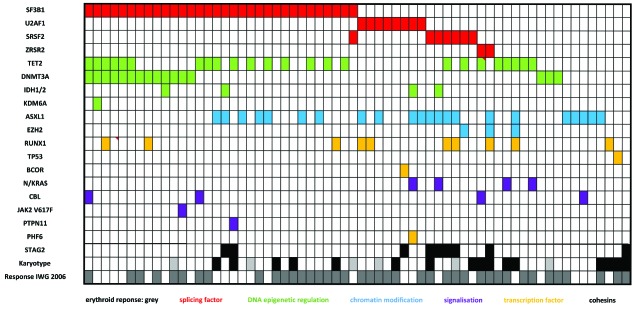
Sequencing results (Figure 1, Online Supplementary Table S2) were interpretable for all genes in all samples. We identified 159 mutations in the 79 patients, including 88 missense, 36 InDel, 28 stopgain, and 7 splicing mutations. A total of 86% of the patients had at least one mutation (median number of mutations 2, range 0–6).
Figure 1.
Barcode in the global cohort. Rows correspond to cytogenetics (normal vs. abnormal) or sequenced genes, and columns represent individual patients. Color coding is based on the category of gene mutated. Karyotype white= normal/black= abnormal/grey=NA. Erythroid response IWG 2006 white=no/grey=yes.
Mutations were found in more than 10% of the patients for SF3B1 (40.5% of the patients), TET2 (30.3%), ASXL1 (27.8%), DNMT3A (20.2%), RUNX1 (12.6%), STAG2 (11.4%), U2AF1 (10.1%) (Online Supplementary Table S2), and involved splicing factors (SF3B1, SRSF2, U2AF1, ZRSR2) (62% of the patients), DNA methylation modifiers (TET2, IDH1, IDH2, DNMT3A) (56%), chromatin modifiers (ASXL1, EZH2, KDM6) (32%), transcription factors (RUNX1, TP53, BCOR, PHF6) (16%), and signaling pathway genes (NRAS, CBL, JAK2, PTPN11) (13%).
VAF comparison between mutated genes in each patient revealed 2 types of clonal patterns: 45 (57%) patients had only one major clone with 1 to 5 mutations (pattern 1), while 34 (43%) patients had a major clone and minor subclone(s) (pattern 2) (Online Supplementary Figure S1). Most mutations were found in major clones; however, 2 of 3 EZH2, 3 of 4 NRAS, and all 5 STAG2 mutations were represented only in minor subclones.
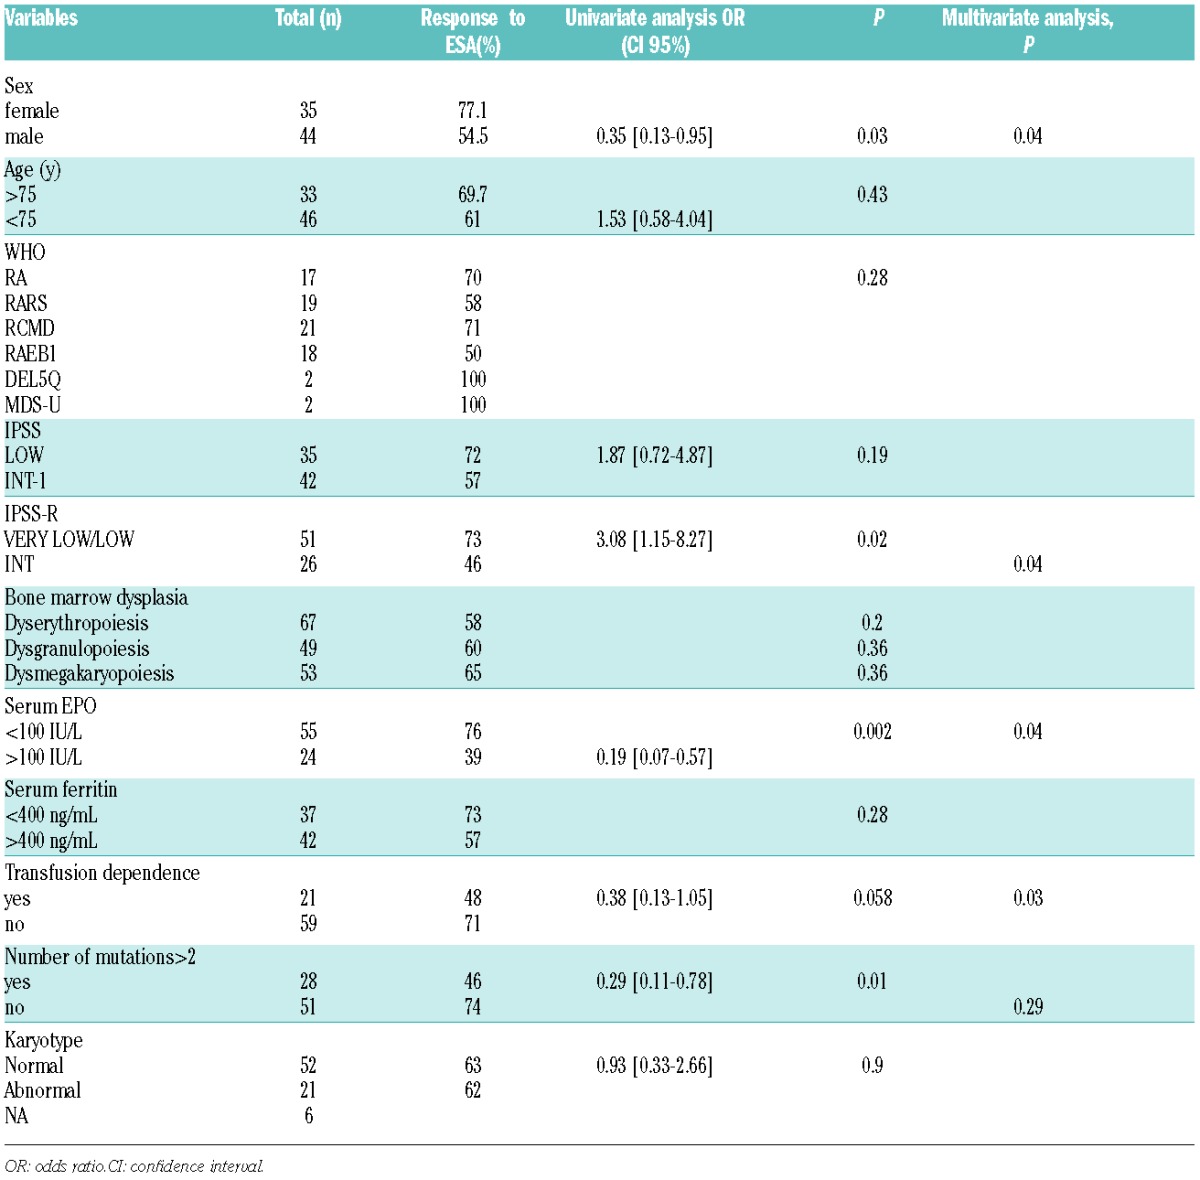
In univariate analysis (Table 1), male sex (P=0.03), sEPO level >100U/L (best discriminant threshold in this study) (P=0.002), and intermediate IPSS-R (P=0.02) were significantly correlated with worse HI-E; RBC-TD had borderline significance (P=0.058); and Hb level, platelet count, ANC, age, karyotype, and importance of dysplasia (after central review) had no significant prognostic impact.
Table 1.
Variables related with ESA response, including variables with P<0.1 in univariate analysis, for the multivariate analysis.

HI-E was 73% and 63% in patients with no mutation, and at least one mutation, respectively (P=0.44). HI-E was 74% in the 51 patients with ≤ 2 mutations versus 46% in the 28 patients with >2 mutations (P=0.01) (Table 1). The cut-off point of 3 mutations was chosen because HI-E was 73%, 71%, 79%, 47%, and 38% in patients with 0, 1, 2, 3 and 4 mutations, respectively. All patients with >2 mutations had multilineage dysplasia, compared with 63% of the patients with ≤ 2 mutations (P=0.01). HI-E was 57% and 65% in patients with mutational pattern 1 (one major clone) and mutational pattern 2 (major and minor subclones), respectively (P=0.62).
Individual mutation of the most frequently mutated genes (SF3B1, TET2, ASXL1, DNMT3A), mutation in a particular gene category (DNA methylation, chromatin modifier, splicing factor, transcription factors, signalling pathways) or mutation of the following genes associated with poor OS in MDS (ASXL1, TP53, RUNX1) had no significant impact on HI-E (Online Supplementary Table S2). In particular, HI-E was 58% in the 32 patients with SF3B1 mutation (31 of whom had received ESA without G-CSF) versus 68% in patients without SF3B1 mutation (P=0.4).
In an adjusted logistic regression model, male sex, sEPO level>100U/L, RBC-TD and IPSS-R, but not the number of mutations or presence of mutations in a particular gene category, were significantly correlated with HI-E (Table 1).
Median response duration to ESA was 19 months (range 3–134). Mutations (individual or by gene category), their number, the mutational pattern (major or minor subclones), multilineage (versus unilineage) dysplasia, sEPO level, karyotype, IPSS-R, age, sex, and TD were not significantly correlated with response duration (data not shown).
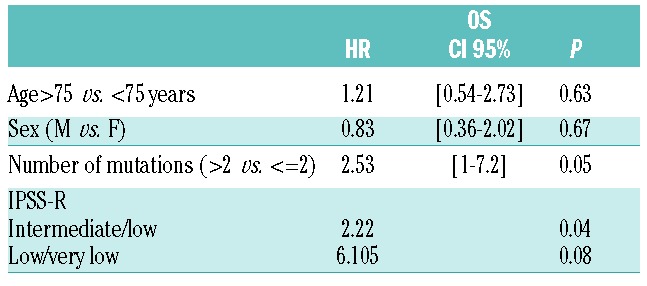
Median OS was 42.5 months. Individual gene mutations, mutations in specific gene categories, and the mutational pattern (major or minor subclones) had no significant impact on OS. On the other hand, patients with >2 mutations had a median survival of 32 months vs. 92 months in patients with ≤ 2 mutations (P=0.04; Online Supplementary Figure S2A). Increasing number of mutations correlated with worse OS (P=0.01, Online Supplementary Figure S2B). In multivariate analysis, IPSS-R and >2 mutations significantly and independently influenced OS (Table 2).
Table 2.
Multivariate analysis for OS. Including variables with P<0.1 in univariate analysis.

In this first next generation sequencing study of lower risk MDS patients treated by ESA, to our knowledge, having >2 somatic mutations was associated with lower HI-E. While previous studies have shown the prognostic value of somatic mutations in MDS (irrespective of treatment, or with hypomethylating agents or allogeneic SCT),9,10 their predictive role in response to ESA has not previously been studied. In the present series, the response rate to ESA was relatively high (64.5%), probably due to the fact that all patients had lower risk MDS, serum EPO level < 500 U/l, were generally not RBC TD, and received high ESA dose (60,000 IU/week of EPO, 250- 300mg/week of darbepoietin). Frequent individual mutations (SF3B1, TET2, ASXL1, DNMT3A), mutations in particular gene categories and mutational patterns (major subclones only or coexistence of major and minor subclones) had no significant impact on response. In addition, in multivariate analysis, prognostic factors of HI-E were serum EPO level, RBC TD, and IPSS-R,8 whilst number or type of mutation were not. Thus, although future analysis of somatic mutations in larger patient cohorts may lead to different conclusions, conventional parameters, especially RBC-TD, sEPO level and IPSS-R, currently appear sufficient to predict response to ESA treatment in routine practice.
Whilst the number of mutations correlated with lower HI-E in univariate analysis, it was not significantly associated with response duration to ESA. Based on these results from a relatively small cohort, systematic analysis of the gene mutation profile may not be considered necessary to predict response to ESA in lower risk MDS patients. On the other hand, the mutational profile could be useful to predict OS in lower risk MDS, as the presence of >2 mutations correlated with worse OS independently of IPSS-R. Similarly, a poorer OS based on mutation number was reported, though independently of treatment, by Bejar et al. and Papaemmanuil et al.9,10,14 Furthermore, since lower risk IPSS patients with more than 2 gene mutations treated with ESA possibly have shorter OS, alternative treatments may be required in these cases. Our results, however, warrant confirmation on larger patient cohorts with precise treatment description.
Acknowledgments
We would like to thank Roche Pharmaceuticals for a research grant, Véronique de Mas for DNA material, and Silke Gloaguen, Rosa Sapena and Elisa Masiera for the registries.
Footnotes
Funding: this work was supported by a grant (Programme Hospitalier de Recherche Clinique MDS-04) from the Institut National du Cancer (INCa) and the Direction de la Recherche Clinique de l’Assistance-Publique-Hôpitaux de Paris and from Roche Pharmaceuticals (research grant).
The online version of this letter has a Supplementary Appendix.
Information on authorship, contributions, and financial & other disclosures was provided by the authors and is available with the online version of this article at www.haematologica.org.
References
- 1.Jadersten M, Malcovati L, Dybedal I, et al. Erythropoietin and Granulocyte-Colony Stimulating Factor Treatment Associated With Improved Survival in Myelodysplastic Syndrome. J Clin Oncol. 2008;26(21):3607–3613. [DOI] [PubMed] [Google Scholar]
- 2.Park S, Grabar S, Kelaidi C, et al. Predictive factors of response and survival in myelodysplastic syndrome treated with erythropoietin and G-CSF: the GFM experience. Blood. 2008;111(2):574–582. [DOI] [PubMed] [Google Scholar]
- 3.Greenberg PL, Sun Z, Miller KB, et al. Treatment of myelodysplastic syndrome patients with erythropoietin with or without granulocyte colony-stimulating factor: results of a prospective randomized phase 3 trial by the Eastern Cooperative Oncology Group (E1996). Blood. 2009;114(12):2393–2400. [DOI] [PMC free article] [PubMed] [Google Scholar]
- 4.Hellström-Lindberg E, Gulbrandsen N, Lindberg G, et al. A validated decision model for treating the anaemia of myelodysplastic syndromes with erythropoietin + granulocyte colony-stimulating factor: significant effects on quality of life. Br J Haematol. 2003;120(6):1037–1046. [DOI] [PubMed] [Google Scholar]
- 5.Westers TM, Alhan C, Chamuleau MED, et al. Aberrant immunophenotype of blasts in myelodysplastic syndromes is a clinically relevant biomarker in predicting response to growth factor treatment. Blood. 2010;115(9):1779–1784. [DOI] [PubMed] [Google Scholar]
- 6.Frisan E, Pawlikowska P, Pierre-Eugene C, et al. p-ERK1/2 is a predictive factor of response to erythropoiesis-stimulating agents in low/int-1 myelodysplastic syndromes. Haematologica. 2010;95(11):1964–1968. [DOI] [PMC free article] [PubMed] [Google Scholar]
- 7.Spinelli E, Caporale R, Buchi F, et al. Distinct Signal Transduction Abnormalities and Erythropoietin Response in Bone Marrow Hematopoietic Cell Subpopulations of Myelodysplastic Syndrome Patients. Clin Cancer Res. 2012;18(11):3079–3089. [DOI] [PubMed] [Google Scholar]
- 8.Santini V, Schemenau J, Levis A, et al. Can the revised IPSS predict response to erythropoietic-stimulating agents in patients with classical IPSS low or intermediate-1 MDS? Blood. 2013;122(13):2286–2288. [DOI] [PubMed] [Google Scholar]
- 9.Papaemmanuil E, Gerstung M, Malcovati L, et al. Clinical and biological implications of driver mutations in myelodysplastic syndromes. Blood. 2013;122(22):3616–3627. [DOI] [PMC free article] [PubMed] [Google Scholar]
- 10.Bejar R, Stevenson KE, Caughey B, et al. Somatic Mutations Predict Poor Outcome in Patients With Myelodysplastic Syndrome After Hematopoietic Stem-Cell Transplantation. J Clin Oncol. 2014;32(25):2691–2698. [DOI] [PMC free article] [PubMed] [Google Scholar]
- 11.Itzykson R, Kosmider O, Cluzeau T, et al. Impact of TET2 mutations on response rate to azacitidine in myelodysplastic syndromes and low blast count acute myeloid leukemias. Leukemia. 2011;25(7):1147–1152. [DOI] [PubMed] [Google Scholar]
- 12.Vardiman JW, Thiele J, Arber DA, et al. The 2008 revision of the World Health Organization (WHO) classification of myeloid neoplasms and acute leukemia: rationale and important changes. Blood. 2009;114(5):937–951. [DOI] [PubMed] [Google Scholar]
- 13.Haferlach T, Nagata Y, Grossmann V, et al. Landscape of genetic lesions in 944 patients with myelodysplastic syndromes. Leukemia. 2014;28(2):241–247. [DOI] [PMC free article] [PubMed] [Google Scholar]
- 14.Bejar R, Stevenson KE, Caughey BA, et al. Validation of a prognostic model and the impact of mutations in patients with lower-risk myelodysplastic syndromes. J Clin Oncol. 2012;30(27):3376–3382. [DOI] [PMC free article] [PubMed] [Google Scholar]


