Abstract
Context:
Orthosiphon stamineus is a medicinal herb widely grown in Southeast Asia and tropical countries. It has been used traditionally as a diuretic, abdominal pain, kidney and bladder inflammation, gout, and hypertension.
Aims:
This study aims to develop and validate the high-performance thin layer chromatography (HPTLC) method for quantification of rosmarinic acid (RA), 3'-hydroxy-5,6,7,4'-tetramethoxyflavone (TMF), sinensitin (SIN) and eupatorin (EUP) found in ethanol, 50% ethanol and water extract of O. stamineus leaves.
Materials and Methods:
HPTLC method was conducted using an HPTLC system with a developed mobile phase system of toluene: ethyl acetate: formic acid (3:7:0.1) performed on precoated silica gel 60 F254 TLC plates. The method was validated based on linearity, accuracy, precision, limit of detection, limit of quantification (LOQ), and specificity, respectively. The detection of spots was observed at ultraviolet 254 nm and 366 nm.
Results:
The linearity of RA, TMF, SIN, and EUP were obtained between 10 and 100 ng/spot with high correlation coefficient value (R2) of more than 0.986. The limit of detection was found to be 122.47 ± 3.95 (RA), 43.38 ± 0.79 (SIN), 17.26 ± 1.16 (TMF), and 46.80 ± 1.33 ng/spot (EUP), respectively. Whereas the LOQ was found to be 376.44 ± 6.70 (RA), 131.45 ± 2.39 (SIN), 52.30 ± 2.01 (TMF), and 141.82 ± 1.58 ng/spot (EUP), respectively.
Conclusion:
The proposed method showed good linearity, precision, accuracy, and high sensitivity. Hence, it may be applied in a routine quantification of RA, SIN, TMF, and EUP found in ethanol, 50% of ethanol and water extract of O. stamineus leaves.
SUMMARY
HPTLC method provides rapid estimation of the marker compound for routine quality control analysis.
The established HPTLC method is rapid for qualitative and quantitative fingerprinting of Orthosiphon stamineus extract used for commercial product.
Four identified markers (RA, SIN, EUP and TMF) found in three a different type of O. stamineus extracts specifically ethanol, 50% ethanol and water extract were successfully quantified using HPTLC method.
Abbreviations Used: HPTLC: High-performance thin layer chromatography; RA: Rosmarinic acid; TMF: 3’-hydroxy-5,6,7,4’-tetramethoxyflavone; SIN: Sinensitin; EUP: Eupatorin; E: Ethanol; EW: 50% ethanol; W: Water; BK: Batu Kurau; KB: Kepala Batas; S: Sik; CJ: Changkat Jering; SB: Sungai Buloh
Key words: Eupatorin, high-performance thin-layer chromatography, Orthosiphon stamineus, rosmarinic acid, sinensitin, validation
INTRODUCTION
Orthosiphon stamineus Benth is commonly known as Misai Kucing or Cat's whiskers are herbaceous shrub from the family of Lamiaceae. The old folk's practice of this plant reported on the use to treat menstrual disorder, gallstone, influenza, hepatitis, and jaundice. Moreover, this plant has been used traditionally as diuretic and to treat kidney and bladder inflammation, gout, diabetes, rheumatism, abdominal pain, anti-allergic, anti-inflammatory, antihypertensive, and antitumor.[1,2]
Various studies on O. stamineus revealed a range of chemical compounds such as mineral (potassium 3%), diterpenes (orthosiphols A–E 0.2%), triterpenes, essential oil (0.02–0.06%), sesquiterpenes, lipophilic flavones such as sinensitin (SIN) (0.1–0.19%), isosenensitin and euphatorin flavonol glycosides, rosmarinic acid (RA) (0.1–0.5%), and other caffeic acid derivatives such as mono and dicafeyl tartaric acid as well as lithospermic acid, phytosterols (β-sitosterol) and essential oil (0.7%), inositol, pimarane, isopimarene and staminane diterpenes, triterpenes, chromenes, and oxygenated sesquiterpenes.[3,4,5,6,7]
Due to innumerable health benefits of phytochemicals, a great attention is being given to determine the quality, efficacy, and standards of the herbal raw material. Numbers of analytical methods are available and reported in the literature for the detection of markers in O. stamineus.[8,9,10,11] A previous study on method development for the simultaneous identification of four markers in O. stamineus extract has been reported using HPLC method.[12,13] However, to best of our knowledge, the rapid screening method for fingerprinting of four compounds found mainly in O. stamineus using high-performance thin-layer chromatography (HPTLC) has not yet been established, and there is a need for rapid qualitative and quantitative fingerprinting for herbal extract as a part of quality control in a commercial product. Thus, this study aims to develop and validate the HPTLC method for quantification of RA, SIN, 3'-hydroxy-5,6,7,4'-tetramethoxyflavone (TMF), and eupatorin (EUP) [Figure 1] found in ethanol (E), 50% ethanol (EW) and water (W) extract of O. stamineus leaves.
Figure 1.
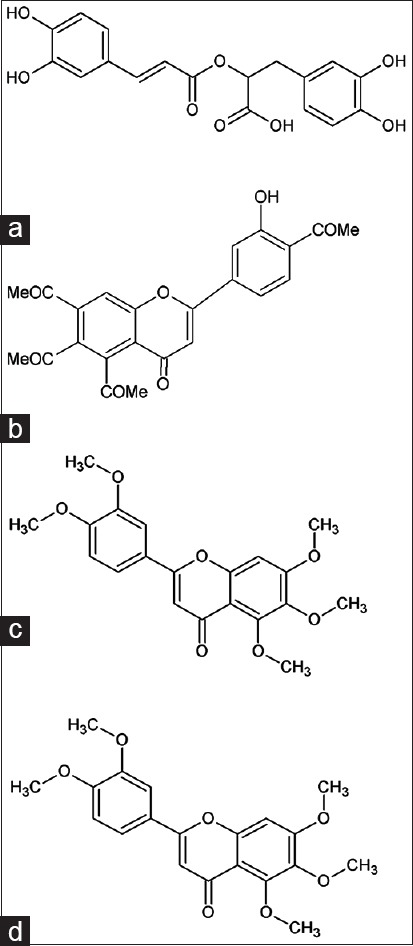
Chemical structure of: (a) rosmarinic acid, (b) 3′hydroxy-5,6,7,4′tetramethoxyflavon, (c) sinensitin, and (d) eupatorin found in Orthosiphon stamineus extracts
MATERIALS AND METHODS
Chromatographic condition
HPTLC fingerprinting analysis was conducted using an HPTLC system (CAMAG, Switzerland) with a developed mobile phase system of toluene: ethyl acetate: formic acid (3:7:0.1). Precoated silica gel 60 F254 thin layer chromatograph (TLC) plates (20 cm × 10 cm), layer thickness of 0.2 mm (E. Merck KGaA, Darmstadt, Germany) were used as stationary phase. Test and standard solutions of 5 µL were spotted as 6 mm band length on the 60F254 TLC plate using a HAMILTON syringe and CAMAG LINOMAT 5 instrument. The amount of standards spotted was in the range of 0.25–1.25 µg. The plates were then developed in a presaturated chamber with the mentioned mobile phase system up to 90 mm in length of the plates. The plates were then air-dried and images at white light, ultraviolet (UV) 254 nm, and UV 366 nm were captured using CAMAG REPROSTAR 3 chamber. Natural products-polyethylene glycol (NPEG) reagent was sprayed on the plates for detection of flavonoids compound. The plates were heated in the oven at 105°C for 2–5 min after the treatment before a densitometric analysis using a CAMAG TLC scanner 3 with winCATS Software, CAMAG Scientific Inc.
Preparation of sample and standard
O. stamineus were collected from five different locations throughout peninsular Malaysia, mainly from Batu Kurau, Kepala Batas, Sik (S), Changkat Jering, and Sungai Buloh. The plant sample was authenticated and deposited at the Herbarium of School of Biology, Universiti Sains Malaysia with voucher number of 11,009. The O. stamineus leaves were cleaned, dried, and grinded into powder form before extraction. Approximately, 30 g of dried O. stamineus powder was extracted separately in 500 mL of ethanol, 50% ethanol and water, using maceration at 60°C for 48 h. Each extract was filtered using Whatman filter paper number 1 and then concentrated using a rotary evaporator (Buchi, Switzerland). The concentrated extract samples were freeze dried using a freeze dryer (Labconco, USA). The extract samples were dissolved in methanol with a concentration of 1 mg/mL. Reference standards of RA, TMF, SIN, and EUP were prepared in methanol with a concentration of 10 µg/mL. The standards were purchased from ChromaDex (USA).
Method validation
The method was validated according to the International Conference on Harmonization (ICH) guidelines.[14]
Linearity (calibration curve)
Calibration curves were determined using a standard concentration ranging from 50–750 ng/spot for RA to 10–100 ng/spot for TMF, SIN, and EUP standards, respectively. Each of the standard solution (50, 100, 250, 500, and 750 µL of RA and 10, 20, 40, 60, 80, and 100 µL of TMF, SIN, and EUP) was applied on the TLC plates separately. The TLC plates were subsequently developed and analyzed as per chromatographic condition described. The calibration curves were prepared by plotting peak height versus concentration (ng/spot), and linearity (R2) was determined by regression analysis of the calibration graphs.
Accuracy (percentage of recovery)
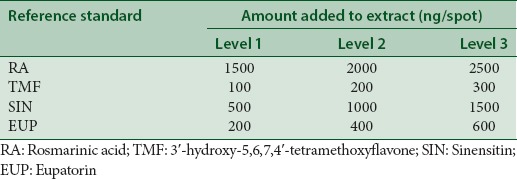
The accuracy of the method was determined by percentage recovery for each of reference standards (RA, TMF, SIN, and EUP) added to all extracts at concentration of 10 mg/mL for ethanol extract and 1 mg/mL for both 50% ethanol and water extract, respectively. An amount of a standard solution added to a prequantified extract solution was estimated by applying obtained values to the respective linear regression equation. The amount of standard references added to the extracts is as summarized in Table 1. The result is presented as average ± standard deviation (SD) (n = 3).
Table 1.
Amount of reference standard added to Orthosiphon stamineus extracts
Method precision (% repeatability)
The precision of the instrument was checked by repeatedly injecting (n = 6) solution of each reference standards without changing the parameters of the method. The results were reported in terms of relative SD (% RSD).
Intermediate precision (reproducibility)
The intraday and interday precision of the method were determined by estimating corresponding responses of 3 times on the same day and 3 different days over a week for different concentration of standard solutions, respectively. The results were then reported in terms of % RSD.
Limit of detection (LOD) and limit of quantification
The LOD and limit of quantification (LOQ) were calculated using the following equations as per ICH guidelines:[14]
Equation I: LOD = 3.3 × σ/S
Equation II: LOQ = 10× σ/S
where:
σ is the SD of the response
S is the slope of the calibration curve.
Specificity
The specificity of the method was obtained by analyzing the reference standards and the extract. The spots for RA, TMF, SIN, and EUP in the extracts were confirmed by comparing the Rf and the spectra of the spots in the extract with that of the standards.
Quantification of rosmarinic acid, 3'-hydroxy-5,6,7,4'-tetramethoxyflavone, sinensitin, and eupatorin amount in Orthosiphon stamineus extracts
O. stamineus extract solutions (5 µL of 10 mg/mL) were applied separately on TLC plates and subsequently developed as per chromatographic condition described. The amount of RA, TMF, SIN, and EUP present in the extracts was determined by fitting height values of the peak corresponding to the standards into their respective calibration curves. The results were presented in ng/spot, n = 3.
RESULTS AND DISCUSSION
Validation is the process of demonstrating or confirming the performance characteristics of a method of analysis and these performance characteristics meet the requirements for the intended analytical application.[15] The HPTLC method was validated as per ICH guidelines on validation of analytical procedures Q2(R1).[14] The proposed HPTLC method was validated in terms of linearity, precision, accuracy, LOD, and LOQ. The summary of the HPTLC validation parameters was presented in Table 2. The calibration curve was found to be linear over the concentration range 50–750 ng/spot for RA and 10–100 ng/spot for TMF, SIN, and EUP, standards, respectively. The proposed method showed good linearity represented by regression coefficient (R2) which was found in the range of 0.981–0.995.
Table 2.
Regression analysis data and summary of validation parameters for the proposed high-performance thin layer chromatography method

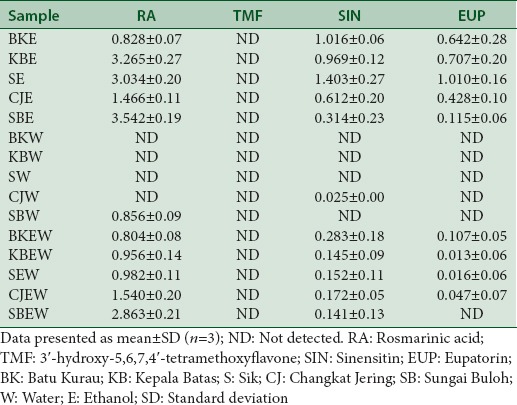
The HPTLC fingerprint revealed the presence of separated spots and four were identified as RA, TMF, SIN, and EUP as shown in Figure 2. After sprayed with NPEG reagent, the spots become more obvious when viewed at 254 nm and 366 nm wavelengths. The band for SIN and RA were clearly seen, and the higher intensity of the band was observed in ethanol extract followed by 50% ethanol and water extracts of O. stamineus, respectively. The amount of major compounds identified was quantified for all extract based on standard linear regression. The data were presented in Table 3. RA was found to be higher in ethanol and 50% ethanol extract. However, in water extract, the RA was invisibly detected. TMF was not detected in all types of extract. This may be due to the TMF amount in extracts is less than the quantification limit (LOQ = 131.45 ± 2.39) of the standard concentration plotted in the calibration curve.
Figure 2.
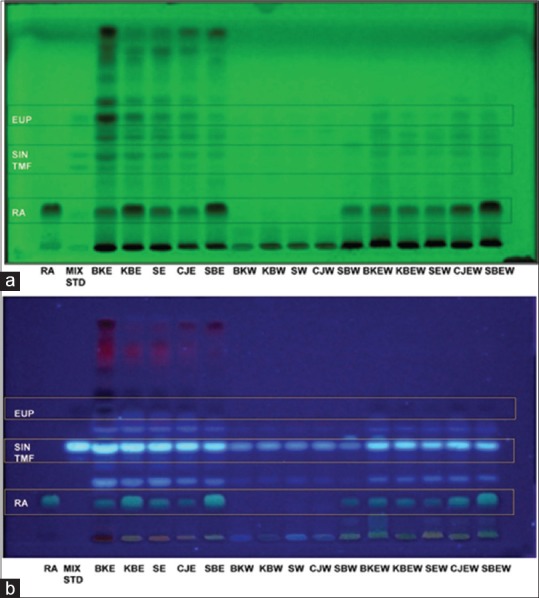
High-performance thin layer chromatography analysis of the extracts of Orthosiphon stamineus: (a) high-performance thin-layer chromatography fingerprint profile visualized under ultraviolet 254 nm and (b) high-performance thin-layer chromatography fingerprint profile visualized under 366 nm after derivatization with natural product reagent
Table 3.
The quantified amount (μg) of identified marker compounds (rosmarinic acid, 3’-hydroxy-5,6,7,4’-tetramethoxyflavone, sinensitin, and eupatorin) found in ethanol, water, and 50% ethanolic extract of Orthosiphon stamineus
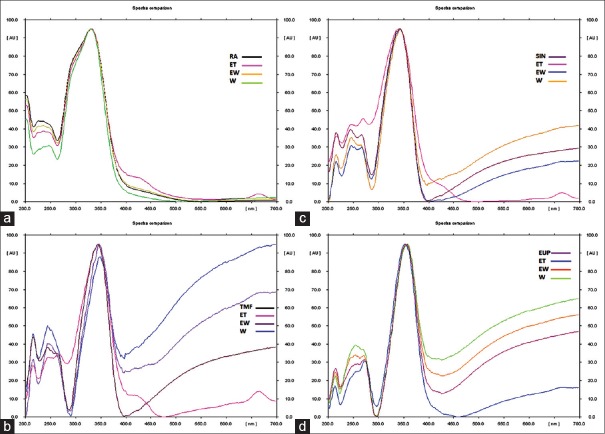
A suitable mobile phase equally plays a very crucial role in chromatographic methods. As far as, individual estimation of RA, TMF, SIN, and EUP by chromatographic methods is concerned, a number of HPTLC solvent systems have been reported.[16,17,18,19,20,21] In our study, HPTLC method was optimized with a view in developing an assay method for simultaneous estimation of RA, TMF, SIN, and EUP in a single solvent system. The mobile phase consisting mixture of toluene: ethyl acetate: formic acid (3:7:0.1) produced sharp and symmetrical peaks with the Rf value of 0.32 (RA), 0.52 (TMF), 0.56 (SIN), and 0.71 (EUP). A Three-dimensional chromatogram in Figure 3 showing peaks of four standard compounds in different types of O. stamineus extracts at 366 nm. It can be observed that the presence of the peaks in the extracts as at the same Rf value as the peak of the standards. The presence of RA, TMF, SIN, and EUP in all extracts was proven by comparison of the UV-visible spectra of the standard with that of standard compound [Figure 4].
Figure 3.
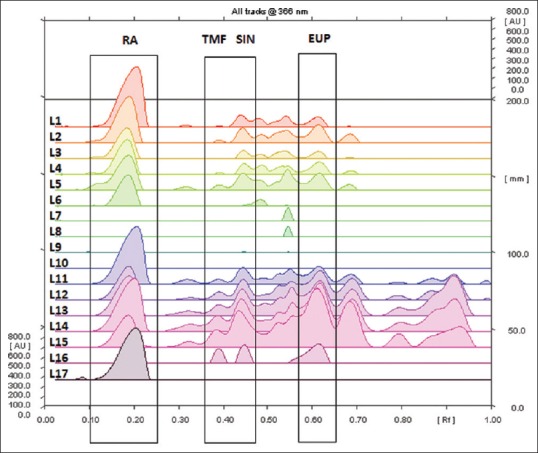
High-performance thin-layer chromatography chromatogram for Orthosiphon stamineus extracts with four identified compound; 3′hydroxy-5,6,7,4′tetramethoxyflavon, sinensitin, eupatorin and rosmarinic acid legend: L1: SBEW L2: CJEW L3: SEW L4: KBEW L5: BKEW L6: SBW L7: CJW L8: SW L9: KBW L10: BKW L11: SBE L12: CJE L13: SE L14: KBE L15: BKE L16: Mix standards; 3′hydroxy-5,6,7,4′tetramethoxyflavon, sinensitin and eupatorin L17: Rosmarinic acid
Figure 4.
Comparison of four identified spectra found in extracts of Orthosiphon stamineus with that of the standards: (a) rosmarinic acid standard spectra overlay with rosmarinic acid found in ET, EW and water extracts of Orthosiphon stamineus, (b) 3′hydroxy-5,6,7,4′tetramethoxyflavon standard spectra overlay with 3′hydroxy-5,6,7,4′tetramethoxyflavon found in ET, EW and W extracts of Orthosiphon stamineus, (c) sinensitin standard spectra overlay with sinensitin found in ET, EW and water extracts of Orthosiphon stamineus, and (d) eupatorin standard spectra overlay with eupatorin found in ET, EW, and W extracts of Orthosiphon stamineus
The concept of the limit of determination (LOD) is referring to the smallest amount or concentration of an analyte that can be detected but not necessarily quantitated as an exact value.[14,22] Whereas the LOQ is referring to the lowest amount of analyte in a sample which can be quantitatively determined with suitable precision and accuracy. The quantitation limit is a parameter of quantitative assays for low levels of compounds in sample matrices and is used particularly for the determination of impurities and/or degradation products.[14] Moreover, it is the indicator of the extraction.[22] The calculated LOD and LOQ in this study were found to be low for all four standards [Table 2], and this indicates the sensitivity of the method.
The precision of an analytical procedure expresses the closeness of agreement between a series of measurements obtained from multiple sampling of the same homogeneous sample under the prescribed conditions. Precision is commonly performed at three different levels, namely repeatability, intermediate precision, and reproducibility.[14,15] The precision was calculated in terms of % RSD of the peak height as the peak height was found to be more consistent than the peak area. The lower % RSD values for intraday and interday precision revealed that the method is precise.
Repeatability is termed as an intra-assay precision or the precision under the same operating conditions over a short interval of time.[14] The repeatability measurement of the standards was found to be <2% (% RSD) for all four standards. The RSD range from 1.07% to 1.44% indicates that this method is repeatable. This repeatability data provide information about the variation caused by the sample preparation and application as well as evaluation within one analytical run within a short period.[15] This support that the method is reproducible with less variation.
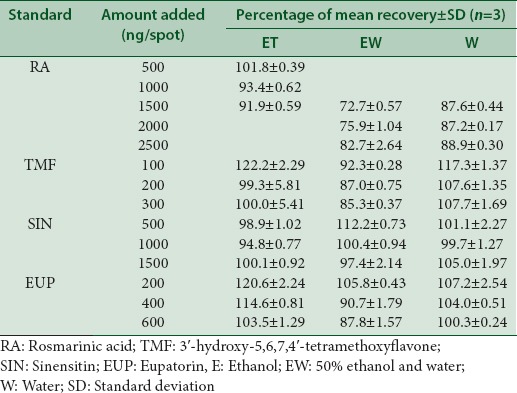
A recovery was performed at three concentration level for each standard compound to determine the accuracy of the proposed method.[23] The results showed that the average percentage recovery for all standards in different types of O. stamineus extracts fall in the range of 72.7% ± 0.57% to 122.2% ± 2.29% [Table 4], suggested that the method is accurate. The previous HPTLC method for O. stamineus extract has been developed by Hossain and Ismail using two standards; RA and caffeic acid.[17] However, this newly developed method has been improved in a way that it identifies four compounds in three different types of O. stamineus extracts. Lower values of SD indicate the suitability of the method for routine analysis of RA, TMF, SIN, and EUP in the plant extract applicable for commercially available natural product.
Table 4.
Recovery data of proposed high-performance thin layer chromatography method
CONCLUSION
Overall, the cumulative amount of RA, TMF, SIN, and EUP represents the contribution of higher phenolic and flavonoids compound found in O. stamineus that is essential for various pharmacological activities. In addition, HPTLC analysis can be a rapid tool for screening and identification of standard compound found in plant extract and play a role as a part of the routine quality control procedure. The HPTLC method for simultaneous estimation of four marker compounds (RA, TMF, SIN, and EUP) found in O. stamineus extracts was successfully developed. This established method was validated to be simple, sensitive, accurate, precise, and highly reproducible for rapid estimation of markers in O. stamineus extracts. In summary, this method is useful for an effective quality control method for rapid fingerprinting and assaying compounds in plant extracts containing RA, TMF, SIN, and EUP, especially in herbal industry.
Financial support and sponsorship
Financial support from Northern Corridor Implementation Authority, Malaysia, through the national program entitled “Plant Science and Tissue Culture Node” and Research University Team Grant (No: 1001/PFARMASI/851001) from Universiti Sains Malaysia.
Conflicts of interest
There are no conflicts of interest.
ABOUT AUTHOR

Amin Malik Shah Abdul Majid
Amin Malik Shah Abdul Majid, B.Sc (Auckland), M.Sc. and PhD. (New South Wales), Contract Research Laboratory in Cancer Drug Discovery at EMAN Testing & Research Laboratory.
Assoc. Prof. Dr. Amin Malik Shah Abdul Majid, serves as an Associate Professor of Department of Pharmacology at School of Pharmaceutical Sciences, Universiti Sains Malaysia. He specializes in drug discovery and development as well as product commercialization. He is involved in establishing a few startup ventures including a multinational pharmaceutical company.
REFERENCES
- 1.Ismail S, Hanapi NA, Ab Halim MR, Uchaipichat V, Mackenzie PI. Effects of Andrographis paniculata and Orthosiphon stamineus extracts on the glucuronidation of 4-methylumbelliferone in human UGT isoforms. Molecules. 2010;15:3578–92. doi: 10.3390/molecules15053578. [DOI] [PMC free article] [PubMed] [Google Scholar]
- 2.Basheer MA, Abdul Majid AM. Medicinal potentials of Orthosiphon stamineus Benth. Webmedcentral. 2010;1:12. [Google Scholar]
- 3.Hossain MA, Salehuddin SM, Ismail Z. Rosmarinic acid and methyl rosmarinate from Orthosiphon stamineus Benth. J Bangladesh Acad Sci. 2006;30:167–71. [Google Scholar]
- 4.Committee on Herbal Medicinal Products (HMPC) Assessment report on Orthosiphon stamineus Benth., folium. European Pharmacopeia, EMA/HMPC/135701/2009. European Medicines Agency. 2010:1–49. [Google Scholar]
- 5.Awale S, Tezuka Y, Banskota AH, Adnyana IK, Kadota S. Highly-oxygenated isopimarane-type diterpenes from Orthosiphon stamineus of Indonesia and their nitric oxide inhibitory activity. Chem Pharm Bull (Tokyo) 2003;51:268–75. doi: 10.1248/cpb.51.268. [DOI] [PubMed] [Google Scholar]
- 6.Tezuka Y, Stampoulis P, Banskota AH, Awale S, Tran KQ, Saiki I, et al. Constituents of the Vietnamese medicinal plant Orthosiphon stamineus. Chem Pharm Bull (Tokyo) 2000;48:1711–9. doi: 10.1248/cpb.48.1711. [DOI] [PubMed] [Google Scholar]
- 7.Sumaryono W, Proksch P, Wray V, Witte L, Hartmann T. Qualitative and quantitative analysis of the phenolic constituents from Orthosiphon aristatus. Planta Med. 1991;57:176–80. doi: 10.1055/s-2006-960060. [DOI] [PubMed] [Google Scholar]
- 8.Yam MF, Mohamed EA, Ang LF, Pei L, Darwis Y, Mahmud R, et al. A simple isocratic HPLC method for the simultaneous determination of sinensetin, eupatorin, and 3'-hydroxy-5,6,7,4'-tetramethoxyflavone in Orthosiphon stamineus extracts. J Acupunct Meridian Stud. 2012;5:176–82. doi: 10.1016/j.jams.2012.05.005. [DOI] [PubMed] [Google Scholar]
- 9.Loon YH, Wong JW, Yap SP, Yuen KH. Determination of flavonoids from Orthosiphon stamineus in plasma using a simple HPLC method with ultraviolet detection. J Chromatogr B Analyt Technol Biomed Life Sci. 2005;816:161–6. doi: 10.1016/j.jchromb.2004.11.021. [DOI] [PubMed] [Google Scholar]
- 10.Siddiqui MJ, Ismail Z. Simultaneous analysis of bioactive markers from Orthosiphon stamineus benth leaves extracts by reverse phase high performance liquid chromatography. Trop J Pharm Res. 2011;10:97–103. [Google Scholar]
- 11.Pietta P, Mauri P, Gardana C, Bruno A. High-performance liquid chromatography with diode-array ultraviolet detection of methoxylated flavones in Orthosiphon leaves. J Chromatogr A. 1991;547:439–42. [Google Scholar]
- 12.Saidan NH, Aisha AF, Hamil MS, Majid AM, Ismail Z. A novel reverse phase high-performance liquid chromatography method for standardization of Orthosiphon stamineus leaf extracts. Pharmacognosy Res. 2015;7:23–31. doi: 10.4103/0974-8490.147195. [DOI] [PMC free article] [PubMed] [Google Scholar]
- 13.Akowuah GA, Zhari I, Norhayati I, Sadikun A, Khamsah SM. Sinensetin, eupatorin, 3'-hydroxy-5, 6, 7, 4'-tetramethoxyflavone and rosmarinic acid contents and antioxidative effect of Orthosiphon stamineus from Malaysia. Food Chem. 2004;87:559–66. [Google Scholar]
- 14.ICH. Guidance for industry, Q2B: Validation of analytical procedures: Methodology. USA: International Conference on Harmonisation; 1997. [Google Scholar]
- 15.Rashmin P, Mrunali P, Nitin D, Nidhi D, Bharat P. HPTLC method development and validation: Strategy to minimize methodological failures. J Food Drug Anal. 2012;20:794–804. [Google Scholar]
- 16.Hossain MA, Ismail Z. Quantification and enrichment of sinensetin in the leaves of Orthosiphon stamineus. Arabian J Chem. 2012;2:1–4. [Google Scholar]
- 17.Hossain MA, Ismail Z. High performance thin layer chromatographic determination of caffeic acid and rosmarinic acid from the leaves of Orthosiphon stamineus. Indones J Chem. 2010;9:137–41. [Google Scholar]
- 18.Altan HB, Akaydin G, Kirmizibekmez H, Yesilada E. Validated HPTLC method for the quantitative analysis of rosmarinic acid in several Salvia Sp. Turk J Pharm Sci. 2014;11:245–54. [Google Scholar]
- 19.Yam MF, Lim V, Salman IM, Ameer OZ, Ang LF, Rosidah N, et al. HPLC and anti-inflammatory studies of the flavonoid rich chloroform extract fraction of Orthosiphon stamineus leaves. Molecules. 2010;15:4452–66. doi: 10.3390/molecules15064452. [DOI] [PMC free article] [PubMed] [Google Scholar]
- 20.Akowuah GA, Zhari I, Sadikun A, Norhayati I. HPTLC densitometric analysis of Orthosiphon stamineus leaf extracts and inhibitory effect on xanthine oxidase activity. Pharm Biol. 2006;44:65–70. [Google Scholar]
- 21.Hossain M, Salehuddin S. Simultaneous quantification of sinensetin and tetramethoxyflavone in misai kucing capsules using TLC-UV densitometric technique. J Sci Res. 2009;1:403–7. [Google Scholar]
- 22.Horwitz W. AOAC guidelines for single laboratory validation of chemical methods for dietary supplements and botanicals. Gaithersburg, MD, USA: AOAC International; 2002. pp. 12–9. [Google Scholar]
- 23.Betz JM, Brown PN, Roman MC. Accuracy, precision, and reliability of chemical measurements in natural products research. Fitoterapia. 2011;82:44–52. doi: 10.1016/j.fitote.2010.09.011. [DOI] [PMC free article] [PubMed] [Google Scholar]


