Abstract
IgA1 mesangial deposition is the hallmark of IgA nephropathy and Henoch–Schönlein purpura, the onset of which often follows infections. Deposited IgA has been reported as polymeric, J chain associated, and often, hypogalactosylated but with no information concerning the influence of the IgA repertoire or the link between immune stimuli and IgA structure. We explored these issues in the α1KI mouse model, which produces polyclonal human IgA1 prone to mesangial deposition. Compared with mice challenged by a conventional environment, mice in a specific pathogen–free environment had less IgA deposition. However, serum IgA of specific pathogen–free mice showed more galactosylation and much lower polymerization. Notably, wild-type, α1KI, and even J chain–deficient mice showed increased polymeric serum IgA on exposure to pathogens. Strict germfree conditions delayed but did not completely prevent deposition; mice housed in these conditions had very low serum IgA levels and produced essentially monomeric IgA. Finally, comparing monoclonal IgA1 that had different variable regions and mesangial deposition patterns indicated that, independently of glycosylation and polymerization, deposition might also depend on IgA carrying specific variable domains. Together with IgA quantities and constant region post–translational modifications, repertoire changes during immune responses might, thus, modulate IgA propensity to deposition. These IgA features are not associated with circulating immune complexes and C3 deposition and are more pertinent to an initial IgA deposition step preceding overt clinical symptoms in patients.
Keywords: IgA nephropathy, IgA deposition, IgA, transgenic mouse, Immunology and pathology
IgA nephropathy (IgAN) and Henoch–Schönlein purpura (HSP) constantly feature mesangial IgA deposition.1 Various inconsistent abnormalities of deposited IgA have been reported: antigen coprecipitation,2,3 negative electrostatic charge,4–6 and altered patterns of IgA glycosylation with hinge hypogalactosylation7 and increased exposition of N-acetylgalactosamine (GalNac).8 However, hypogalactosylation also occurs without IgAN.9 In blood from patients with IgAN, aberrantly glycosylated IgA1 can form complexes with IgG or IgA1 autoantibodies binding the hinge O-glycans.10 These autoantibodies also occur, albeit at lower levels, in sera from healthy individuals.11 The role of hinge hypogalactosylation is debatable, because mouse IgA occasionally yields deposits, despite normal hinge O-glycosylation,12,13 and because highly galactosylated monoclonal IgA can induce glomerular lesions.14 While modulating deposition and/or proinflammatory effects, variant glycosylation involves unknown regulatory systems and does not solely determine IgA pathogenicity. Additional characterization of nephritogenic IgA is needed for a clearer picture of the mechanisms underlying IgAN and HSP.
We previously studied both polyclonal and monoclonal IgA in α1KI mice producing human IgA1 instead of mouse Ig.15 We recently observed that IgA deposition occurs in these mice and leads to hematuria when deposits also include soluble CD89.16 We now examined whether responses to environmental antigenic challenges induce modifications influencing initial IgA deposition and whether primary structures from different monoclonal IgA could also participate in this process.
Results
α1KI Mice Spontaneously Develop Mesangial Deposits When Housed in a Conventional Environment
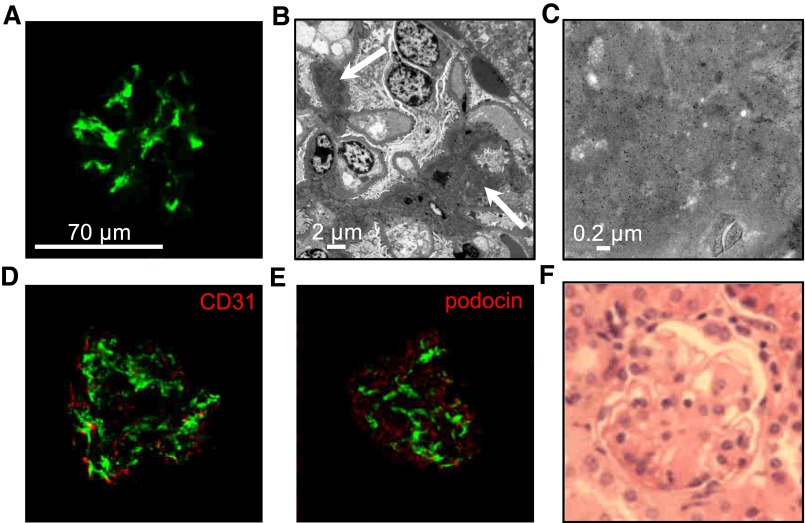
We analyzed mice bred in a conventional facility encountering endemic mouse pathogens providing conventional immune stimulation (CIS). Kidneys from animals in various genetic backgrounds (mixed 129×C57BL/6, backcrossed C57BL/6, or BALB/c animals) all readily showed heavy IgA1 deposits (Figure 1A). Consistent with previous observations in α1KI mice additionally transgenic for FcαRI, IgA1 deposits did not show additional staining for C3 or mouse IgG.16 Colocalization experiments with the mesangial markers desmin and PDGFRβ clearly showed that IgA deposits were located in the mesangium (Supplemental Figure 1). Deposits were observed in 2-week-old mice, whereas hematuria, proteinuria, or hypercreatininemia never occurred, even after a 1-year follow-up.
Figure 1.
IgA1 mesangial deposits in adult α1KI mice housed in CIS facilities. (A) Kidney section stained with FITC–conjugated anti–human IgA (green). (B) Electron microscopy of kidney section: white arrow points to IgA deposits. (C) Electron microscopy with immunogold labeling of human IgA. (D) Confocal microscopy after double immunofluorescence to detect human IgA in green and endothelial cells (CD31+ cells) in red. (E) Confocal microscopy of kidney section stained with FITC–conjugated anti–human IgA antibody (green) and AlexaFluor568–labeled antipodocin antibody (red). (F) Kidney section stained with hematoxylin and eosin. Pictures are representative of all of the glomeruli found in kidney sections of n>10 mice.
Electron microscopy (Figure 1B), immunogold staining for IgA1 (Figure 1C), the absence of IgA1 colocalization with the endothelial marker CD31 (Figure 1D), and the podocyte marker podocin (Figure 1E) showed widespread mesangial IgA deposition. In agreement with the absence of functional alterations, no signs of inflammation or mesangial cell proliferation were observed (Figure 1F).
Housing Conditions Modulate the Kinetics of IgA Deposition
We evaluated whether deprivation from immune stimulation could delay IgA deposition. Mice housed in a CIS environment were compared with animals raised in either a specific and opportunistic pathogen–free (SOPF) facility or germfree (GF) conditions after embryo transfer.
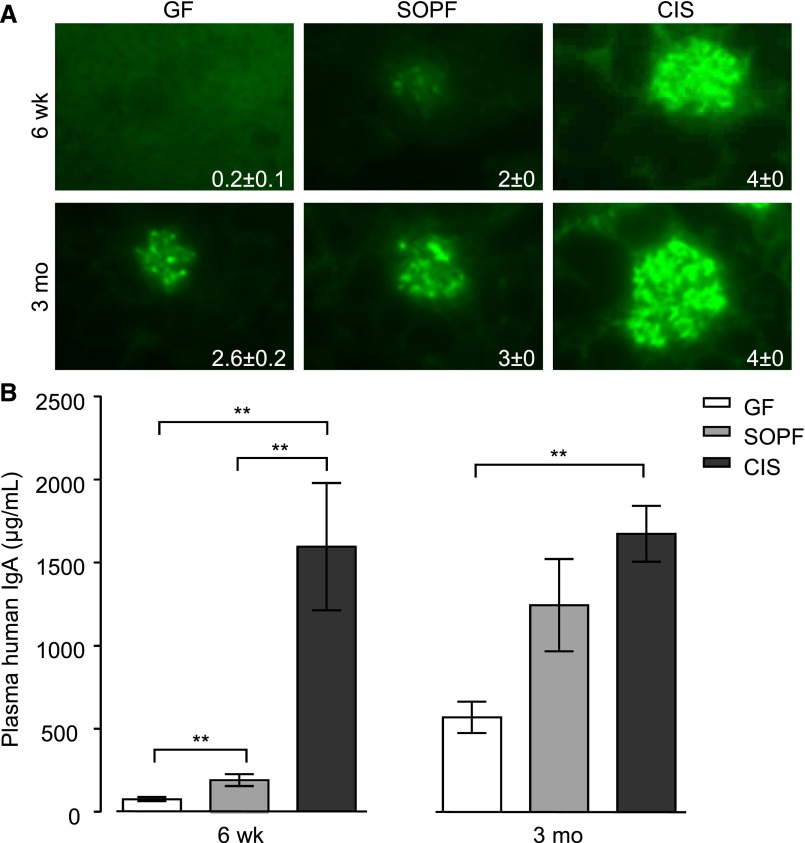
All mice showed deposits after 3 months but with intensities increasing from GF to SOPF and CIS mice. For younger (6-week-old) mice, the difference was more striking, and GF mice showed no (four mice) or very mild (two mice) deposits (Figure 2A). Mice showing the heaviest deposits also had the highest serum IgA levels: 6-week-old GF mice had approximately 2.5-fold lower serum IgA levels than SOPF animals (P<0.01). IgA levels were higher in CIS than SOPF conditions (P<0.01). We observed similar results for 3-month-old mice: plasma IgA was low in GF, medium in SOPF, and high in CIS mice (Figure 2B). Because it is well known in patients that occurrence or abundance of deposits is not correlated to serum IgA levels, we looked for additional qualitative variations in IgA produced by all three groups of mice.
Figure 2.
IgA production and deposition vary with housing conditions. Influence of environmental stimuli on (A) mesangial IgA deposition and (B) plasma IgA levels in 6-week-old and 3-month-old α1KI mice housed in GF, SOPF, or CIS facilities. Homogeneous groups of five to six age-matched mice housed in the same conditions were studied. Deposits were detected on kidney sections by fluorescence microscopy using FITC–conjugated anti–human IgA. Representative pictures are shown. IgA was measured in plasma by ELISA (mean±SEM; Kruskall–Wallis test followed by Bonferroni test). **P<0.01.
Immune Stimulation Promotes Polymeric IgA Production
Both GF and SOPF α1KI mice synthesized mostly monomeric serum IgA (mIgA; approximately 150 kD) and to a lesser extent, dimeric IgA (dIgA; approximately 300 kD). In contrast, CIS mice produced abundant high–molecular mass polymeric IgA (pIgA; >300 kD) (Figure 3A).
Figure 3.
Influence of environmental stimuli on the monomeric-to-polymeric ratio of circulating IgA in groups of young (6–8 weeks old) and adult (3–4 months old) mice housed in GF, SOPF, or CIS facilities. (A) Plasma proteins were separated under nonreducing conditions, blotted, and stained with HRP–linked anti–human IgA. (B) Blots from two α1KI and two α1KI J−/− mice were stained with anti–mouse J–chain antiserum. (C) Blots from α1KI J−/− mice housed in SOPF and CIS facilities. (D) Blots from wild-type (WT) mice housed in SOPF and CIS facilities. Molecular mass scale (Mr) is expressed in kilodaltons. Data are representative of multiple experiments (n=4–8).
Deposits in patients with IgAN include pIgA and J chain; it is unknown if J chain is a bystander or an actor of the process. We wished to evaluate whether J-chain deficiency might prevent deposition in the α1KI mice by breeding them with J−/− mice (Figure 3B). To study IgA polymerization, we compared serum IgA from α1KI (Figure 3A) and α1KI J−/− mice (Figure 3C) ages 6 weeks old and 3 months old in either an SOPF or CIS environment. Normal IgA from wild-type mice housed under similar conditions was also studied (Figure 3D). mIgA and dIgA were predominant in α1KI, α1KI J−/−, and wild-type mice in SOPF conditions. However, in both 6-week-old and 3-month-old animals, pIgA was predominant in CIS mice, with similar patterns in α1KI and α1KI J−/− mice for human IgA and wild-type animals for mouse IgA (Figure 3). Circulating immune complexes containing IgA plus IgG proved negative in all mouse plasma assayed (not shown).
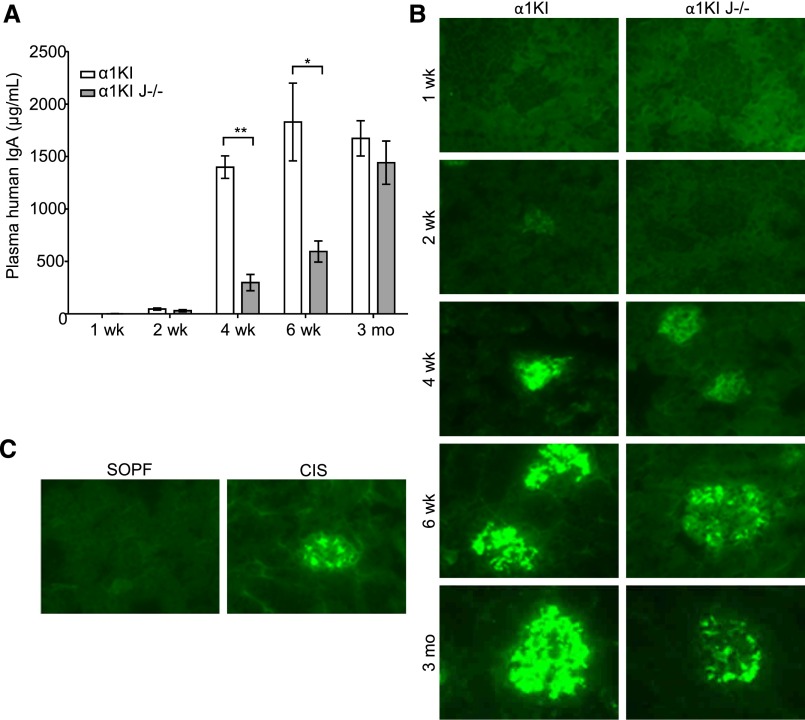
Finally, J chain–deficient α1KI animals only differed from J chain–sufficient mice by lower IgA1 levels than in age–matched, single–mutant α1KI animals (Figure 4A) but did not differ in the serum pIgA-to-mIgA ratio under CIS conditions. α1KI J−/− animals developed deposits in CIS conditions resembling those in α1KI mice, although with lighter staining patterns (Figure 4B). SOPF conditions delayed deposition in α1KI J−/− mice, which remained free of deposits at 6 weeks, for reasons that might combine the lack of J chain and lower serum IgA1 levels (595 μg/ml for CIS versus 47 μg/ml for SOPF) (Figure 4C). As mentioned above, SOPF mice from all genetic backgrounds also essentially produced mIgA and dIgA but virtually no pIgA.
Figure 4.
Kinetics of plasma IgA levels and IgA deposition in glomeruli of 1-week-old to 3-month-old α1KI and α1KI J−/− mice. (A) IgA was measured by ELISA in mice housed in CIS facilities (means±SEM of n=4–8 mice; Kruskall–Wallis test followed by Bonferroni test). *P<0.05; **P<0.01. (B) IgA deposits (green) by fluorescence microscopy on representative kidney sections from groups of four to eight mice housed in CIS facilities. (C) IgA kidney deposits compared on representative kidney sections from groups of 6-week-old α1KI J−/− mice housed under either SOPF or CIS conditions.
Altogether, the presence of pIgA correlated with housing under CIS conditions, independent of J-chain association, and was associated with faster deposition. However, with slower kinetics, deposition also occurred in our model in SOPF or GF conditions featuring the virtual absence of pIgA.
Analyses of IgA Glycosylation
MALDI-TOF-MS analysis showed roughly similar patterns of O-glycans in pIgA1 from both α1KI mice housed under CIS conditions and a healthy human control (Supplemental Figure 2). Influence of housing conditions on IgA glycosylation was evaluated by lectin binding assays using Maackia amurensis (MA) binding N-acetylneuraminic acid or Helix aspersa (HAA) binding GalNAc.
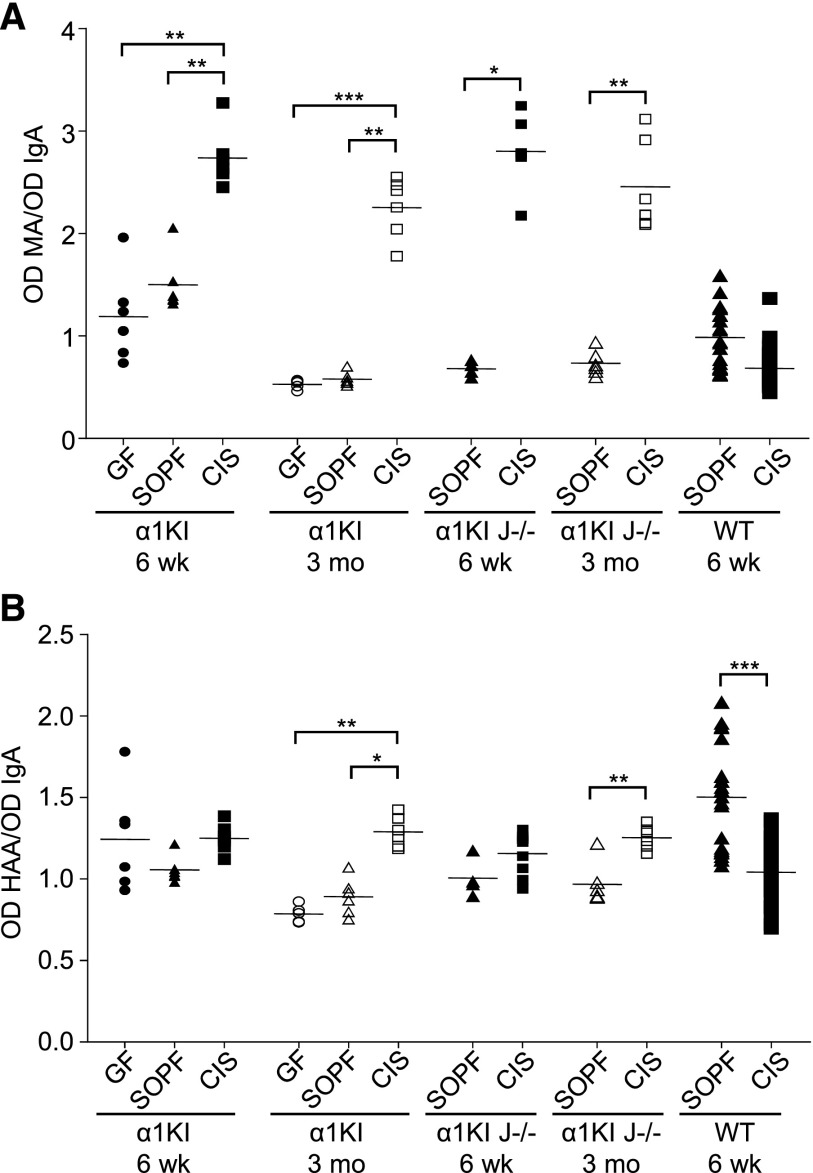
Both 6-week-old and 3-month-old α1KI mice under CIS conditions showed increased IgA sialylation as indicated by a significantly higher MA binding (approximately twofold) in CIS than in SOPF (or GF) conditions. Age–matched α1KI J−/− mice IgA also showed at least threefold higher MA binding in CIS than in SOPF conditions (Figure 5A).
Figure 5.
IgA glycosylation varies with housing conditions. Analysis of (A) N-acetylneuraminic acid and (B) exposed GalNac in plasma IgA from 6-week-old and 3-month-old α1KI, α1KI J−/−, and wild-type (WT) mice housed in GF, SOPF, or CIS conditions. Glycosylation was quantified by lectin assay using MA or HAA lectins. For each sample, OD of lectin assay was normalized using OD of IgA ELISA. Results are expressed as means±SEMs of n=4–9 α1KI or α1KI J−/− animals and n>10 WT mice (Mann–Whitney test or Kruskall–Wallis test followed by Bonferroni test). *P<0.05; **P<0.01; ***P<0.001.
Six-week-old animals showed no significant changes in IgA galactosylation/HAA binding when comparing mice from GF, SOPF, and CIS environments or when comparing α1KI J−/− mice from SOPF and CIS environments. In contrast, IgA1 from 3-month-old α1KI and α1KI J−/− mice showed stronger HAA binding in samples from CIS rather than SOPF (or GF), suggesting that CIS favored hypogalactosylation (Figure 5B). No hypogalactosylation/hypersialylation was observed for mouse IgA (which lacks an O-glycosylated hinge) in wild-type animals under CIS conditions.
Altogether, although glycosylation variations might influence IgA deposition, they do not seem to be mandatory.
In Vivo Experiments with IgA mAbs
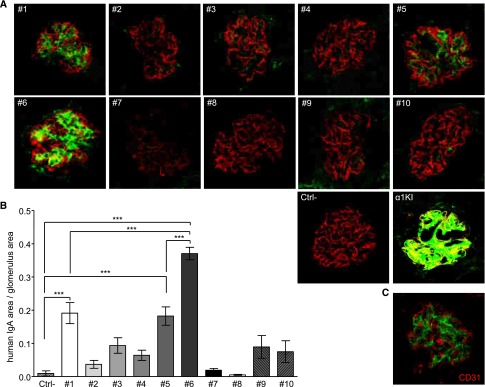
Because conditions assayed in mice induced both qualitative and quantitative variations in pIgA production, we looked for conditions where equal amounts of molecularly defined IgA could be compared and provide a random sample of the IgA repertoire. Purified IgA1 mAbs from 10 randomly chosen α1KI hybridomas were injected into immunodeficient mice and checked for deposition proclivity. Hybridomas were generated from immunized α1KI mice specific for exogenous antigens without known affinity for any mouse autoantigen. Despite the low-IgA concentration produced after injection of 0.4 mg IgA into a 25-g mouse, one (IgA1 mAb6) of 10 mAbs yielded heavy mesangial staining 2 hours after injection (Figure 6, A and B). Faint deposits appeared for mAb1 and mAb5. In contrast, no deposits occurred in these conditions with the remaining seven mAbs (Figure 6, A and B). Deposition in glomeruli after mAb injection resembled that in α1KI mice, also lacking colocalization with podocin and CD31 (Figure 6C).
Figure 6.
Analysis of IgA deposition in the kidney of immunodeficient mice 2 hours after injection of human IgA1 mAb. Clones 1–10 were injected in two mice each. Ctrl− is a negative control after injection of saline. (A) IgA deposits in kidney sections labeled with FITC–conjugated anti–human IgA (green) and AlexaFluor568-linked antipodocin (red). (B) Quantification of IgA staining by image analysis. Results are means±SEMs of n=20 glomeruli (Kruskall–Wallis test followed by Bonferroni test). ***P<0.001. (C) Confocal microscopy imaging of IgA (green) and endothelial CD31+ cells (red) in kidney sections from a mouse administered IgA1 mAb6. A and C are representative of all of the glomeruli analyzed in sections of n=2 mice.
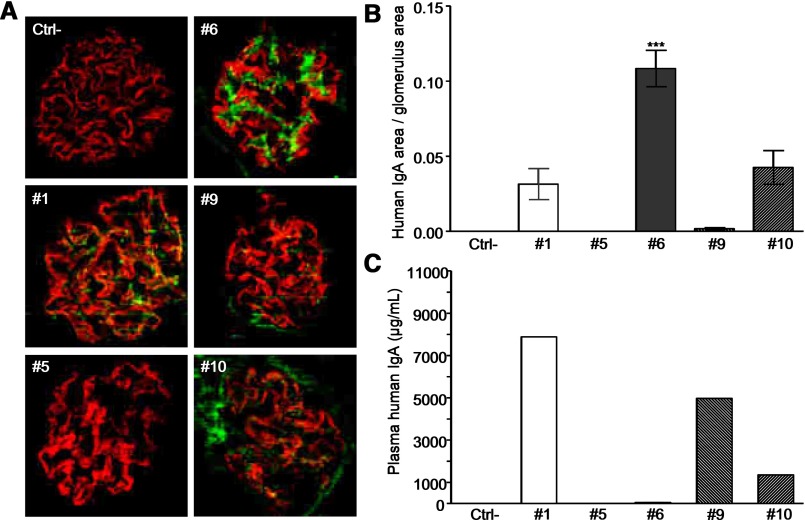
We then performed long-term engraftment of hybridomas 1, 5, and 6, from which secreted IgA had yielded immediate mesangial staining, and control hybridomas 9 and 10 without immediate mesangial staining. Only hybridoma 6 yielded heavy long–term deposits, whereas the remaining four showed poorly specific glomerular staining (Figure 7, A and B). Interestingly, serum IgA concentration was the lowest with hybridoma 6, ruling out that IgA deposition might merely be because of its abundance but inversely, suggesting that deposition might result in increased IgA clearance from serum (Figure 7C).
Figure 7.
In vivo deposited IgA in RAG-2/γc–deficient mice after intraperitoneal grafting of α1KI hybridomas 1, 5, 6, 9, and 10. Each hybridoma was injected in two mice, which were euthanized after tumor development. Ctrl− stands for negative control with ungrafted littermates. (A) Immunofluorescence microscopy on kidney sections stained with FITC–conjugated anti–human IgA (green) and AlexaFluor568-linked antipodocin (red). (B) Quantification of IgA staining by image analysis. Results are means±SEMs of n=10 glomeruli (Kruskall–Wallis test). ***P<0.001. (C) Plasma IgA was measured by ELISA.
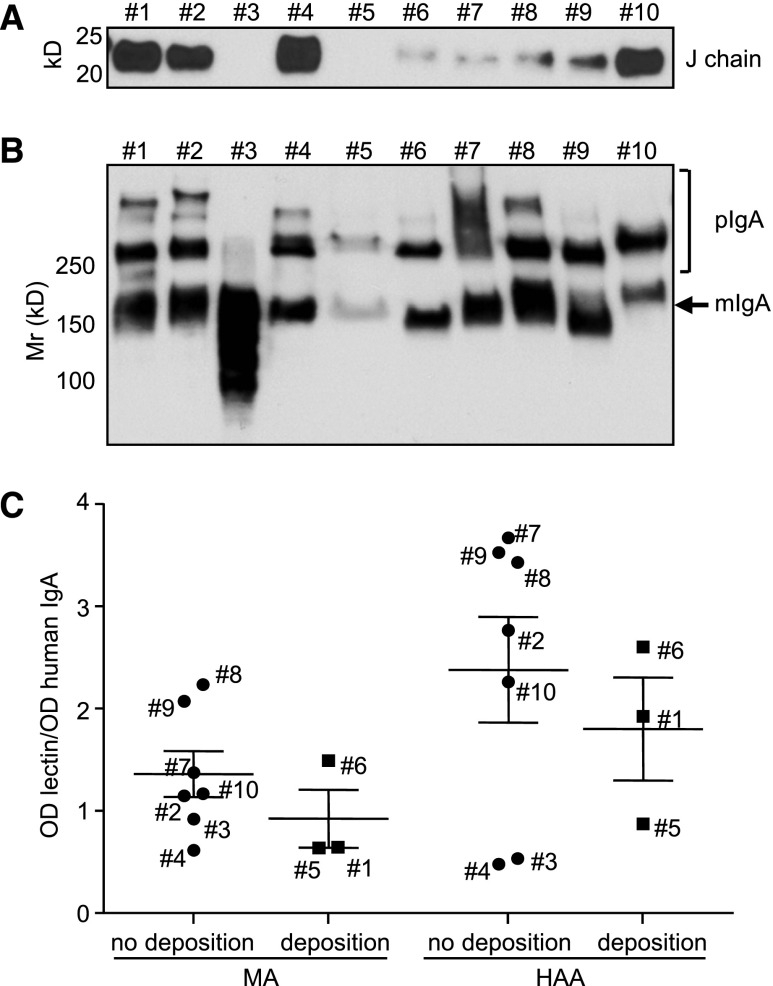
All 10 mAbs assayed contained a pIgA/mIgA mixture, with no correlation between deposits and pIgA amount or presence of J chains (Figure 8, A and B). Deposition-prone IgA1 mAb6 (as for IgA1 mAb5 with the faint short–term deposits) was only composed of mIgA and dIgA. Regarding lectin binding, IgA1 mAb6 did not differ from those mAbs which did not deposit and were not hypersialylated or hypogalactosylated. mAb1 and mAb5 gave mild short–term deposits and also, showed no specific glycosylation patterns (Figure 8C).
Figure 8.
Biochemical features of purified IgA1 mAbs. (A) Detection of J chain by Western blot. (B) Analysis of monomeric (mIgA) and polymeric (pIgA) forms by Western blot after SDS-PAGE in nonreducing conditions. (C) Glycosylation of IgA1 mAbs that deposit or do not deposit 2 hours after injection. Clones are identified with their number next to the corresponding data. N-acetylneuraminic acid and GalNac were analyzed using MA and HAA lectins, respectively. Results are expressed as means±SEMs of n=3–7 clones (Mann–Whitney test).
Comparison of CDR pI of Monoclonal IgA
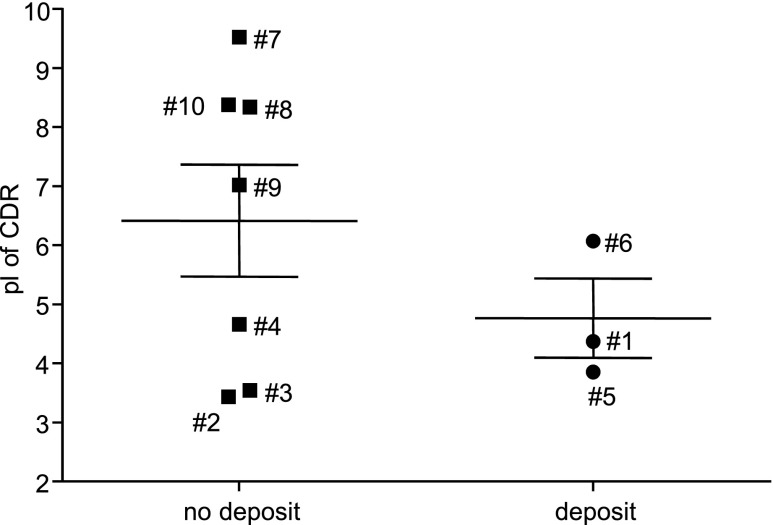
We sequenced VH and Vκ regions from all mAbs and calculated the mean theoretical isoelectric point (pI) of their combined CDR regions. All three IgA1 mAbs generating immediate deposits after injection were acidic (pIs: 4.37, 3.85, and 6.07), but other mAbs also featured acidic pIs (Figure 9), suggesting that acidic pI is not sufficient for deposition.
Figure 9.
Calculated pI of combined VH and Vκ CDR regions from α1KI IgA1 hybridomas. Amino acid sequences of VH and Vκ CDR from hybridomas 1–10 were combined to calculate pI; α1KI hybridomas yielding (circles) or not yielding (squares) IgA deposits are shown.
Biochemical and Structural Features of Monoclonal IgA
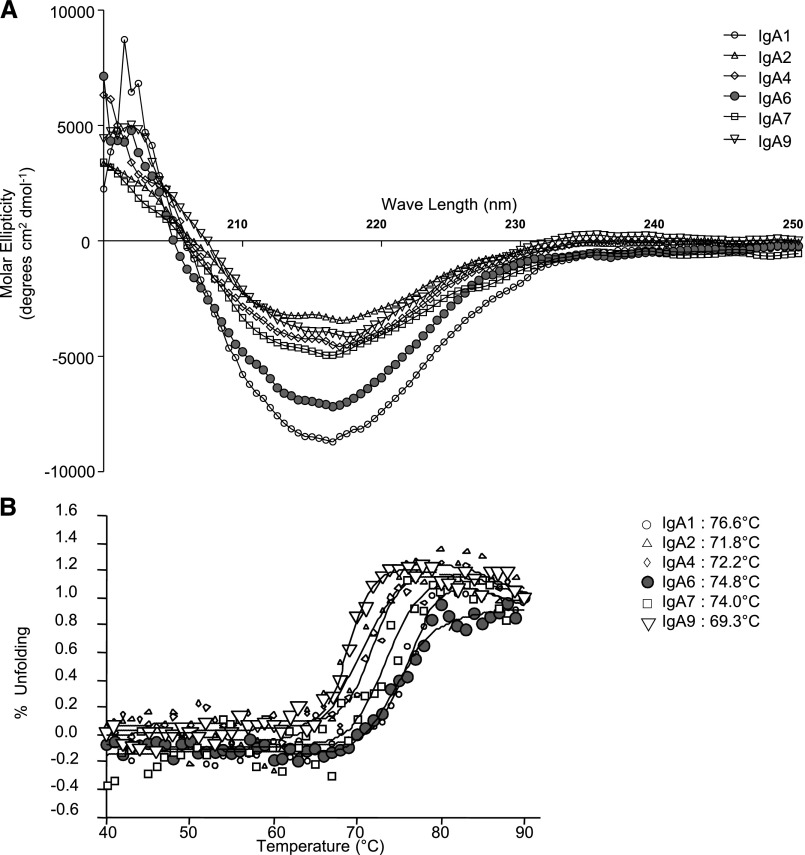
We explored the molecular structures of mAbs using dynamic light scattering and found them quite similar except for two, which had the most negative molecular ellipticity: IgA1 mAb1 and IgA1 mAb6 (with mild and heavy short–term deposits, respectively) (Figure 10A). Stability in solution was evaluated by following the β-pleated structure through circular dichroism and drawing heat denaturation curves. Unexpectedly, the most stable mAbs were the same two as above: mAb1 and mAb6 (heat denaturation temperatures at 76.6°C and 74.8°C, respectively) (Figure 10B).
Figure 10.
Circular dichroism analysis of IgA1 mAbs. (A) Far-ultraviolet spectra of six mAbs acquired at 20°C with a path length of 0.2 cm on a spectropolarimeter. IgA1 mAb1 and IgA1 mAb6 yield IgA deposition, and the others do not. (B) Thermal unfolding analysis of six IgA1 mAbs. Heat denaturation temperatures are indicated on the right.
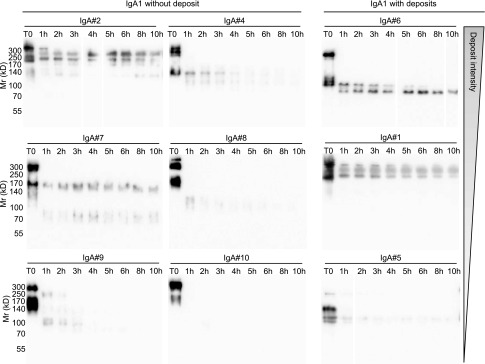
To further explore stability and resistance to proteolysis, we submitted mAbs to trypsin and checked the eventual persistence of some resistant peptides over time (Figure 11). IgA1 mAb6, prone to heavy deposits, belonged to a group of mAbs yielding resistant peptides after ≤10 hours of digestion. To a lesser extent, mAb1 and mAb5 with mild deposits also yielded stable tryptic peptides. IgA1 mAb4, IgA1 mAb8, IgA1 mAb9, and IgA1 mAb10 (no deposits) were completely sensitive to digestion within 4 hours, whereas IgA1 mAb2 and IgA1 mAb7 included some proteolysis-resistant peptides.
Figure 11.
Western blot analysis of trypsin digestion products. Nine IgA1 mAbs were submitted to 10% SDS-PAGE after various digestion times (0–10 hours) by trypsin. Western blot was performed to reveal IgA determinants using HRP–linked goat anti–human IgA. (Left panel) mAb2, mAb4, mAb7, mAb8, mAb9, and mAb10 yield no IgA deposits. (Right panel) mAb6, mAb1, and mAb5 yield deposits.
IgG Class Switching of IgA1 mAb6
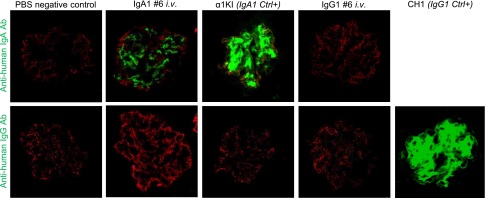
To check whether deposits obtained with IgA1 mAb6 involved a specific conformation of either the whole molecule or its variable domains (or the eventual binding of a mesangium antigen), we cloned its V domains and produced a human IgG1 carrying the same V regions. Its antigen specificity was confirmed by ELISA as identical to mAb6, indicating that the tridimensional structure of the V domains was unchanged. IgA1 mAb6 and its IgG1 variant were injected in parallel, and kidneys were examined 2 hours later. Deposits formed with IgA1 mAb6 but not with its IgG1 variant (only yielding faint background staining), whereas recently reported transgenic models with monoclonal IgG1 deposition provided a positive staining control17 (Figure 12).
Figure 12.
Role of mAb V regions in kidney deposition. IgA1 mAb6 or its IgG1 switched variant was injected in immunodeficient mice 2 hours before euthanasia. IgA1 and IgG1 were revealed on kidney sections with FITC-labeled (green) antisera against either (upper panel) human IgA or (lower panel) IgG. Staining was also with AlexaFluor568 anti–mouse podocin (red). Injection of saline provided a negative control; α1KI and CH1− mice provided controls for the glomerular deposition of human IgA and γ-chains, respectively. Pictures are representative of hundreds of glomeruli observed in kidney sections (two or more mice for each condition). Ab, antibody; Ctrl+, control; i.v., intravenous.
Discussion
Despite multiple studies in cohorts of patients and mouse models, IgA deposition in IgAN and HSP remains incompletely understood. Attention recently focused on hypogalactosylation18,19 and overexpression of GalNac by hinge O-linked oligosaccharides that may yield autoantibodies.10 Although more frequent in IgAN, these anomalies are not constant or specific. Mesangial IgA deposition also occurs in asymptomatic individuals with a frequency ranging from 2%20 to 16%.21 Additional peculiarities remain to be characterized in those IgAs resulting in deposits.
We explored the α1KI model, in which mouse Ig is replaced by IgA1 with human heavy chains and immune responses, thus, modulate the IgA repertoire. Human IgA metabolism in this model mimics that of normal mouse IgA and notably features transport of pIgA from the internal milieu toward mucosal secretions.15 Kidney dysfunction occurs in these mice when they additionally express the human FcαRI receptor.16 We show that, by itself, the α1KI model mimics an initial phase of amorphous IgA deposition without inflammation following kinetics in which immune stimuli by environmental antigens modulate the IgA repertoire and structure. On CIS, IgA1 deposits appeared in 2-week-old mice. Although persisting and increasing throughout life, these deposits never altered kidney function, regardless of housing conditions. No decrease in IgA deposition occurred in SOPF mice only challenged with commensal bacteria in the absence of any pathogen. However, this lowered serum IgA levels and pIgA production, while favoring production of less sialylated and more galactosylated mIgA1.
Finally, housing mice in a GF environment delayed the onset of deposition, showing that deposition proclivity increases with immune challenges. In GF animals, IgA production was minimal and again, featured mostly monomeric, poorly sialylated, and more highly galactosylated IgA. Other than the likely repertoire changes resulting from ongoing immune responses in non-GF versus GF mice, environmental conditions, thus, affected IgA production both quantitatively and qualitatively. Gut microbiota elicit innate and adaptive immune responses that cooperate to protect the host and maintain intestinal homeostasis.22,23 Gut–associated lymphoid tissue maturation and recruitment of IgA–secreting plasma cells to mucosae only occur after birth and rely on microbiota-derived signals.24 In immunocompetent mice, the gut microbiota also coordinate Th1, Th17, and regulatory T cell responses.25
In our study, IgA deposition occurred with roughly the same kinetics in CIS and SOPF mice, although the latter essentially produced mIgA without hypogalactosylation. Polymerization and hypogalactosylation are, thus, dispensable for deposition. In mice additionally lacking J chain, the main change was lower serum IgA concentration, whereas a fair proportion of IgA produced under CIS conditions was polymeric, similar to J chain–proficient mice. J chain–deficient mice developed IgA1 deposition under CIS conditions, whereas the process was delayed in SOPF conditions with still lower serum IgA levels.
Observing that neither polymerization nor hypogalactosylation were mandatory, we hypothesized that a major factor promoting deposition might be at the level of IgA variable domains. By comparing 10 IgA mAbs with different variable regions, we observed that one (IgA1 mAb6) readily yielded heavy deposits 2 hours after injection into mice, whereas two mAbs showed mild deposits; the remaining seven gave no deposition in the same conditions. Propensity to deposit was clearly not connected to the amount of pIgA, hypersialylation, or galactosylation, which was occasionally lower in some nondepositing than depositing mAbs. Altogether, this suggested that deposition might partly be an IgA variable domain disease. By grafting hybridomas for continual antibody synthesis (>4 weeks) to obtain infusion of the secreted mAb into mice, differences occurring between mAbs and IgA1 mAb6 again yielded heavy deposits, whereas some others showed faint and unspecific patterns. This confirmed that immediate deposition can predict IgA deposition over the long term. Obviously, not only the deposition kinetics but also, the clearance kinetics from the mesangium after deposition could coordinately modulate the balance of IgA accumulated in kidney. In that regard, it is striking that IgA1 mAb6, which yielded the heaviest deposits, also accumulated several specific biochemical features, with a strongly negative ellipticity value and increased resistance to heat denaturation and proteolysis.
In a previous study of a patient with IgA monoclonal mesangial deposits, we noticed that one peculiarity of the deposited IgA was acidic CDRs, leading to speculation that responses to some cationic epitopes might select anionic CDRs and potentially, promote binding to mesangium cationic structures.26 Monoclonal or polyclonal IgA in IgAN or HSP was, indeed, reported to often bind cationic polypeptides, such as lactoferrin, proteinase 3, or gliadin.26–30 In this study, the three IgA mAbs that deposited were again more acidic than other mAbs, but this difference was not statistically significant. All mAbs were raised against exogenous antigens and not expected to bind autoantigens. Although this deserves to be explored with a higher number of mAbs, our data suggest that, in addition to glycosylation anomalies, IgA pathogenicity might involve V–domain molecular peculiarities. This may include pIs, hydrophobicity, antigen specificity (notably for extracellular matrix components, such as fibronectin and type 4 collagen), or resistance to proteolytic clearance after initial deposition.31,32 In our study of mAbs, antigen specificity did not play any role, and an IgG1 class–switch variant of IgA1 mAb6 with identical antigen specificity lost deposition proclivity, indicating that deposition specifically needs the association of specific V domains with an IgA1-constant region.
Globally, our study shows in the α1KI model that immune stimuli induce major IgA1 post–translational modifications, including a strongly increased tendency to assemble into polymers. A similar change in the ratio of pIgA to mIgA occurs for endogenous IgA in wild-type animals in response to environmental stimulation. However, none of these modifications is mandatory for IgA deposition. Because they paralleled a quantitatively increased IgA production, they could not be considered as contributing by themselves to the increased IgA deposits affecting animals exposed to immune stimuli. The study of IgA mAbs obtained from the same mouse model strongly suggests that, in contrast to other Ig classes, such as IgG, the human IgA1 primary structure might, by itself, yield deposition-prone molecules on association with some particular variable domains; then, it would result in IgA precipitation/deposition, partly because of acidic CDRs and/or binding to some specific antigens or serum macromolecules and/or decreased proteolytic clearance after deposition has occurred. The IgA features documented in our model do not associate with circulating immune complexes and C3 deposition and are more likely involved in the step preceding overt clinical symptoms in patients. Because the initial mesangial deposition of IgA molecules remains functionally and clinically silent in many instances, it also needs to be clarified how deposited IgA can remain inert, be cleared by still unknown processes, or further promote inflammation and finally, result in glomerulopathy. Those molecules codeposited with IgA, such as antigens, soluble CD89, IgG autoantibodies, or other molecules still to be identified, could likely be inducers of the latter fate.16,32–34 Although the data obtained in mice could mimic the natural story of IgA deposition diseases affecting patients, especially if mice were missing any human clearance pathway of aggregated or deposited IgA1, we think that the α1KI mouse strain can provide useful molecular information about the initial phase of nonpathogenic IgA deposition. Beyond that phase, by allowing precise studies with molecularly defined IgA mAbs, this model might provide an ideal tool for determining the links between silent IgA deposition and the eventual recruitment of additional nephritogenic factors.
Concise Methods
Animals and Housing Conditions
Experiments with mice (males and females; 1 week old to 3 months old) followed European regulations (applied in France by decree no. 2013–118 of February 1, 2013 on the protection of animals used for science).
The α1KI mice15 feature insertion of the human Cα1 gene downstream of the endogenous JH region in the IgH locus, replacing IgM expression by IgA with human Cα1–constant regions. These animals were bred into a BALB/c background and compared with wild-type animals from similar backgrounds. J chain–deficient animals have been previously reported with a defect in IgA transport into secretions.35 The RAG-2/γc–deficient model was a gift from James di Santo. The CH1− mice feature expression and glomerular kidney deposition of a truncated human–γ1 Ig chain cloned in a patient with Randall–type glomerular Ig deposition disease.17
Three animal facilities were used. The conventional animal facility of the Limoges University, in which multiple pathogens were endemic (including Norovirus, murine hepatitis virus, Staphylococcus aureus, Pasteurella multocida, Syphacia obvelata, and multiple ectoparasites, etc.), thus, provided CIS. The Limoges University SOPF facility was, in contrast, devoid of any murine pathogen, so that mice were only challenged with benign commensal microorganisms. Finally, breeding in GF conditions was carried out after embryo transfer at the Gulbenkian Institute.
Kidney Processing
Kidneys were collected immediately after cervical dislocation and snap frozen in liquid nitrogen before storage at −80°C. Sections were cut in a cryostat, fixed in acetone, and frozen at −80°C before being thawed and labeled with different antibodies and examined by fluorescence or confocal microscopy.
In some experiments, kidneys were fixed in Dubosq–Brazil fixative before being processed for hematoxylin and eosin staining by the Anatomy-Histopathology Department, Hôpital Dupuytren, Pôle Biologie-Cancer, CHU Limoges.
Electron Microscopy
Glutaraldehyde-fixed kidneys were processed for electronic microscopy and immunogold with rabbit anti-IgA1 (Dako) followed by gold–labeled (10-nm) goat anti–rabbit IgG (Sigma-Aldrich, St. Louis, MO) by the staffs of Centre national de référence Amylose AL et autres maladies par dépôts d’immunoglobulines monoclonales, CHU Limoges, and CHU Poitiers. All kidney biopsy samples were examined under a JEOL JEM-1010 Electron Microscope (JEOL, Tokyo, Japan).36
Production of Human IgG and IgA mAbs
Purified IgA1 mAbs (mAb1–mAb10) and IgG1 mAb6 were purchased from B Cell Design (Limoges, France). IgA1 mAbs were obtained after immunization of α1KI mice with different nonmurine proteins, fusion of splenocytes with Sp2/0 cells, stabilization of clonal hybridomas by cell subcloning, and purification of IgA1 from culture supernatant by Sir22-affinity chromatography.37 Sequences coding V regions of light chains and heavy chains of IgA1 mAb6 were cloned into a eukaryotic expression vector. IgG1 mAb6 was purified by protein G–affinity chromatography from supernatants of a stably transfected human cell line. Avidities of IgA1 mAb6 and IgG1 mAb6 for their antigen were equal.
In Vivo Experiments
Swiss Nu/Nu mice (8 weeks old) were injected with 400 μg IgA1 or IgG1 mAb (two mice injected with each mAb) or 400 μl physiologic serum. Animals were euthanized 2 hours after injection.
Eight- or 9-week-old and pristane–treated immunodeficient RAG-2/γc–deficient mice were intraperitoneally injected with 4×10⁶ hybridoma cells (two mice per hybridoma) and euthanized after 6 weeks. Immunofluorescence was performed after euthanasia.
Immunofluorescence on Kidney Sections
Kidney sections were incubated for 45 minutes at room temperature with FITC–labeled goat F(ab′)2 anti–human IgA (SouthernBiotech), FITC–associated rabbit anti–human IgG (Dako), rabbit antipodocin (Sigma-Aldrich) previously linked to AlexaFluor568 using the AlexaFluor568 Labeling Kit (Invitrogen, Carlsbad, CA), goat anti–rat CD31 (clone MEC7.46; Novus Biologicals), rabbit anti–PDGF receptor–β linked to AlexaFluor647 (Abcam, Inc., Cambridge, MA), and rabbit antidesmin (Abcam, Inc.). CD31 and desmin were revealed using an AlexaFluor546–labeled goat anti–rat IgG secondary antibody (Invitrogen) and an AlexaFluor594–labeled goat anti–rabbit IgG secondary antibody (Invitrogen), respectively. Antibodies were diluted in PBS, and samples were washed in PBS. Before mounting in Mowiol 4–88 (Sigma-Aldrich) solution, nuclei were stained with DAPI.
Kidney sections were also incubated for 45 minutes at 37°C with IgA1 mAb1–mAb10 or human IgG1 mAb6 at 10 μg/ml in PBS and then, FITC anti–human IgA or AlexaFluor488 or FITC anti–human IgG.
Analyses of IgA Deposition
Kidney sections were observed using a fluorescent microscope, and the abundance of glomerular deposition was graded on a scale from zero to four.36 Pictures were taken with an AxioCAM HRm Camera (Carl Zeiss GmbH, Jena, Germany). In some experiments, sections were imaged on an LSM510 Confocal Microscope (Carl Zeiss GmbH) with three lasers set at 405, 488, and 543 nm to excite DAPI, FITC/AlexaFluor488, and AlexaFluor546/AlexaFluor568, respectively. Emitted light from DAPI, FITC/AlexaFluor488, and AlexaFluor546/AlexaFluor568 was collected between 420 and 480, between 505 and 530, and >560 nm, respectively. Glomeruli were randomly photographed at ×40 on the basis of podocin staining. To detect potential IgA and CD31 or IgA and podocin colocalization, 1-μm-thick optical sections of glomerulus were photographed with settings, such as no pixel, and saturated in channels 505–530 and >560 nm. For quantification of IgA deposits, ten glomeruli per mouse with ten 1-μm-thick optical sections per glomerulus were imaged. The optical section with the most podocin staining was analyzed. In this section, the glomerulus area (micrometer2), defined as the area with the longest perimeter of podocin (red) staining, and the area (micrometer2) of IgA deposition (green) were determined by image analysis using Volocity software (PerkinElmer, Waltham, MA). Results were then expressed as ratios of IgA area to glomerulus area.
Anti–Human IgA ELISA
To evaluate plasma IgA1 levels in mice, 96-well plates (Maxisorp; Nunc) were coated with goat anti–human IgA (Beckman Coulter, Inc., Brea, CA). Plates were washed with 0.1% Tween20/PBS buffer, and a blocking step was performed for 30 minutes at 37°C in 3% BSA/PBS buffer. Mouse plasma was diluted in 1% BSA/PBS, added to wells, and incubated for 2 hours at 37°C. After washing, wells were incubated 90 minutes at 37°C with AP–conjugated goat anti–human IgA (SouthernBiotech). After washing, AP activity was developed with 1 mg/ml substrate (SIGMAFAST p-Nitrophenyl Phosphate Tablets; Sigma-Aldrich) and blocked with 3 M NaOH. Optic density was measured at 405 nm.
Lectin Binding Assays
HAA (EY Laboratories) binding to terminal GalNAc residues and MA (Vector Laboratories, Burlingame, CA) binding to N-acetylneuraminic acid have previously been used to characterize IgA glycosylation in IgAN.38,39
For lectin assays, 96-well plates (Maxisorp; Nunc) were coated with anti-human IgA (Dako). Plates were washed with 0.1% Tween in PBS. Mouse sera containing 100 ng IgA or 100 ng purified IgA1 mAb diluted in PBS containing 0.2% gelatin were added to wells and incubated for 2 hours at 37°C. After washing, wells were incubated with biotinylated lectins (HAA, EY Laboratories and MA-II; Vector Laboratories) overnight at 4°C and then, ExtrAvidin coupled to alkaline phosphatase (Sigma-Aldrich) for 1 hour at room temperature. After washing, alkaline phosphatase activity was revealed with a specific substrate, and OD was read at 405 nm. OD of lectin assay was normalized by OD of the corresponding IgA ELISA, and results are expressed as OD HAA/OD IgA or OD MA/OD IgA.
Release, Preparation, and Mass Spectrometry Analyses of Glycans
Polyclonal IgA1 from a healthy donor and polyclonal IgA1 from an α1KI mouse were purified from serum using Sir22-affinity chromatography.37 IgA1s were then reduced and carboxyamidomethylated followed by sequential tryptic and peptide N-glycosidase F digestion and Sep-Pak purification as described.40 Putative O-glycopeptides remaining after PNGase F digestion of the tryptic glycopeptides were subjected to reductive elimination as described.41 Permethylation of glycans, sample cleanup, and MALDI-TOF-MS analysis of permethylated glycans were performed as described.42
Protein Electrophoresis and Western Blotting
For detection of mouse J chain, 1 μl plasma collected from α1KI and α1KI J−/− mice was prepared with 0.1 M dithiothreitol, heated to 100°C for 5 minutes, and fractionated on 10% polyacrylamide gels. Proteins were transferred to PVDF membranes. Mouse J chain was detected using rabbit anti–mouse J–chain antiserum (Santa Cruz Biotechnology, Santa Cruz, CA) followed by incubation with HRP–linked goat anti–rabbit antiserum (SouthernBiotech).
For detection of IgA forms, 1 μg plasma IgA or purified IgA mAbs were prepared without reducing agent and loaded on 10% polyacrylamide gels. Proteins were transferred to PVDF membranes. The human α-chain was detected using an HRP–linked goat anti–human IgA antibody (Beckman Coulter, Inc.), and the mouse α-chain was detected using a goat anti–mouse IgA antibody (Beckman Coulter, Inc.) and an HRP–linked rabbit anti–goat secondary antibody (Dako).
HRP activity was detected using a chemiluminescent substrate and revealed on autoradiography.
Calculation of the pI of the Antigen Binding Site of IgA1
Total RNA was extracted from α1KI hybridoma cells, and 2 μg were reverse transcribed using the High-Capacity cDNA Reverse Transcription Kit (Applied Biosystems, Foster City, CA). The rearranged Igh-VDJ cDNA was amplified using 12 different 5′ primers (MHVP1–MHVP12) hybridizing with Igh-V leader sequences43 and a 3′ primer complementary to exon CH1 of the human IGHCA1 gene (5′-GAAGACCTTGGGGCTGGT-3′). To amplify the rearranged Igk-VJ cDNA, we used 11 5′ primers (MkVP1–MkVP11) hybridizing to Igk-V leader sequences43 and MKC1, a 3′ primer complementary to the Igk-C sequence.44 This PCR was performed in the presence of molar excess of AbVK5′, a 5′ primer complementary to the CDR3 of the known aberrant Igk sequence coming from Sp2/0 cells.44 PCR used Phusion High-Fidelity DNA Polymerase (Finnzymes) with denaturation at 95°C for 45 seconds, annealing at 55°C (Igh-VDJ amplification) or 62°C (Igk-VJ amplification) for 1 minute, and elongation at 72°C for 45 seconds. Igk-VJ amplification differentiated two products: a short product (approximately 100 bp) from the aberrant mRNA and the functional full–length κ–chain cDNA (approximately 400 bp). PCR products from Igh-VDJ amplification and the amplified functional full–length κ–chain cDNA were gel purified and cloned into the pCR2.1-TOPO TA Cloning Vector (Invitrogen) before sequence determination. Sequences of rearranged Igh-VDJ and Igk-VH were translated into amino acid sequences. The peptide sequences of the six CDRs were combined for each IgA1 mAb to calculate the pI of the antigen binding site using the Compute pI/Mw tool of the free online server ExPASy.
Circular Dichroism Measurements
Circular dichroism spectra were acquired at 20°C with a path length of 0.2 cm on a Jasco J-715 or J-815 Spectropolarimeter (Jasco, Tokyo, Japan) equipped with Peltier devices for temperature control. From the molar ellipticity at 222 nm (θ222), the mean residue ellipticity (θ)MRW was calculated using the mean residue molar concentration of the proteins. The thermal unfolding of each construct was monitored by circular dichroism at 217 nm with temperature increasing 1° per minute from 15°C to 85°C. Circular dichroism signals were fitted to two states to the following equation45:
 |
(Equation 1) |
where y is the circular dichroism signal at 217 nm at temperature T; αN and αD are the intercepts of the native and denatured states, respectively; βN and βD are the slopes of the native and denatured states, respectively; ΔGUN is the free energy of unfolding; and R is the gas constant in calorie mole −1 Kelvin−1. As described previously,46 this equation can be rewritten as Equation 2 to facilitate nonlinear regression analysis by SigmaPlot 10.0 in Windows:
 |
(Equation 2) |
where Tm is the melting temperature, and ΔT is the width of the unfolding transition.
Proteolytic Cleavage
Digestion by trypsin (Gibco, Carlsbad, CA) was performed at 37°C in saline buffer on purified IgA (5 μg) with an enzyme-to-substrate ratio of 1/50 (wt/wt).47 After various incubation times from 1 to 10 hours, the reaction was stopped by the addition of 0.1 M glycine (pH 3). Digestion products were then frozen until analysis of IgA forms and proteolytic products by Western blotting (as above).
Statistical Analyses
Data, expressed as means±SEMs of the indicated number of values, were analyzed using Prism software (GraphPad Software, La Jolla, CA). Significance was calculated with a nonparametric Mann–Whitney test or a Kruskall–Wallis test followed by Bonferroni to compare two groups of values and more than two groups, respectively.
Disclosures
None.
Supplementary Material
Acknowledgments
We thank Prof. Guy Touchard and Corinne Lacombe for expert help with electronic microscopy and immunogold analysis, Claire Carrion for expert help with confocal microscopy and image analysis, and Karin Tarte and Jeanne Cook-Moreau for critical reading of the manuscript.
This work was supported by grants from Agence Nationale de la Recherche, Ligue Nationale contre le Cancer, and Conseil Régional du Limousin. The Mass Spectrometry Facility used in this study was funded by the European Community (Fonds Européens de Développement Régional), the Région Nord-Pas de Calais (France), and the Université des Sciences et Technologies de Lille 1.
Footnotes
Published online ahead of print. Publication date available at www.jasn.org.
This article contains supplemental material online at http://jasn.asnjournals.org/lookup/suppl/doi:10.1681/ASN.2015080911/-/DCSupplemental.
References
- 1.Donadio JV, Grande JP: IgA nephropathy. N Engl J Med 347: 738–748, 2002 [DOI] [PubMed] [Google Scholar]
- 2.Koyama A, Sharmin S, Sakurai H, Shimizu Y, Hirayama K, Usui J, Nagata M, Yoh K, Yamagata K, Muro K, Kobayashi M, Ohtani K, Shimizu T, Shimizu T: Staphylococcus aureus cell envelope antigen is a new candidate for the induction of IgA nephropathy. Kidney Int 66: 121–132, 2004 [DOI] [PubMed] [Google Scholar]
- 3.O’Donoghue DJ, Darvill A, Ballardie FW: Mesangial cell autoantigens in immunoglobulin A nephropathy and Henoch-Schönlein purpura. J Clin Invest 88: 1522–1530, 1991 [DOI] [PMC free article] [PubMed] [Google Scholar]
- 4.Lai KN, Chui SH, Lewis WH, Poon AS, Lam CW: Charge distribution of IgA-lambda in IgA nephropathy. Nephron 66: 38–44, 1994 [DOI] [PubMed] [Google Scholar]
- 5.Leung JC, Tang SC, Lam MF, Chan TM, Lai KN: Charge-dependent binding of polymeric IgA1 to human mesangial cells in IgA nephropathy. Kidney Int 59: 277–285, 2001 [DOI] [PubMed] [Google Scholar]
- 6.Suen KK, Lewis WH, Lai KN: Analysis of charge distribution of lambda- and kappa-IgA in IgA nephropathy by focused antigen capture immunoassay. Scand J Urol Nephrol 31: 289–293, 1997 [DOI] [PubMed] [Google Scholar]
- 7.Coppo R, Feehally J, Glassock RJ: IgA nephropathy at two score and one. Kidney Int 77: 181–186, 2010 [DOI] [PubMed] [Google Scholar]
- 8.Moldoveanu Z, Wyatt RJ, Lee JY, Tomana M, Julian BA, Mestecky J, Huang W-Q, Anreddy SR, Hall S, Hastings MC, Lau KK, Cook WJ, Novak J: Patients with IgA nephropathy have increased serum galactose-deficient IgA1 levels. Kidney Int 71: 1148–1154, 2007 [DOI] [PubMed] [Google Scholar]
- 9.Gharavi AG, Moldoveanu Z, Wyatt RJ, Barker CV, Woodford SY, Lifton RP, Mestecky J, Novak J, Julian BA: Aberrant IgA1 glycosylation is inherited in familial and sporadic IgA nephropathy. J Am Soc Nephrol 19: 1008–1014, 2008 [DOI] [PMC free article] [PubMed] [Google Scholar]
- 10.Tomana M, Novak J, Julian BA, Matousovic K, Konecny K, Mestecky J: Circulating immune complexes in IgA nephropathy consist of IgA1 with galactose-deficient hinge region and antiglycan antibodies. J Clin Invest 104: 73–81, 1999 [DOI] [PMC free article] [PubMed] [Google Scholar]
- 11.Suzuki H, Fan R, Zhang Z, Brown R, Hall S, Julian BA, Chatham WW, Suzuki Y, Wyatt RJ, Moldoveanu Z, Lee JY, Robinson J, Tomana M, Tomino Y, Mestecky J, Novak J: Aberrantly glycosylated IgA1 in IgA nephropathy patients is recognized by IgG antibodies with restricted heterogeneity. J Clin Invest 119: 1668–1677, 2009 [DOI] [PMC free article] [PubMed] [Google Scholar]
- 12.Imai H, Nakamoto Y, Asakura K, Miki K, Yasuda T, Miura AB: Spontaneous glomerular IgA deposition in ddY mice: An animal model of IgA nephritis. Kidney Int 27: 756–761, 1985 [DOI] [PubMed] [Google Scholar]
- 13.Launay P, Grossetête B, Arcos-Fajardo M, Gaudin E, Torres SP, Beaudoin L, Patey-Mariaud de Serre N, Lehuen A, Monteiro RC: Fcalpha receptor (CD89) mediates the development of immunoglobulin A (IgA) nephropathy (Berger’s disease). Evidence for pathogenic soluble receptor-Iga complexes in patients and CD89 transgenic mice. J Exp Med 191: 1999–2009, 2000 [DOI] [PMC free article] [PubMed] [Google Scholar]
- 14.Otani M, Nakata J, Kihara M, Leroy V, Moll S, Wada Y, Izui S: O-glycosylated IgA rheumatoid factor induces IgA deposits and glomerulonephritis. J Am Soc Nephrol 23: 438–446, 2012 [DOI] [PMC free article] [PubMed] [Google Scholar]
- 15.Duchez S, Amin R, Cogné N, Delpy L, Sirac C, Pascal V, Corthésy B, Cogné M: Premature replacement of mu with alpha immunoglobulin chains impairs lymphopoiesis and mucosal homing but promotes plasma cell maturation. Proc Natl Acad Sci U S A 107: 3064–3069, 2010 [DOI] [PMC free article] [PubMed] [Google Scholar]
- 16.Berthelot L, Papista C, Maciel TT, Biarnes-Pelicot M, Tissandie E, Wang PHM, Tamouza H, Jamin A, Bex-Coudrat J, Gestin A, Boumediene A, Arcos-Fajardo M, England P, Pillebout E, Walker F, Daugas E, Vrtosvnik F, Flamant M, Benhamou M, Cogné M, Moura IC, Monteiro RC: Transglutaminase is essential for IgA nephropathy development acting through IgA receptors. J Exp Med 209: 793–806, 2012 [DOI] [PMC free article] [PubMed] [Google Scholar]
- 17.Bonaud A, Bender S, Touchard G, Lacombe C, Srour N, Delpy L, Oblet C, Druilhe A, Quellard N, Javaugue V, Cogné M, Bridoux F, Sirac C: A mouse model recapitulating human monoclonal heavy chain deposition disease evidences the relevance of proteasome inhibitor therapy. Blood 126: 757–765, 2015 [DOI] [PubMed] [Google Scholar]
- 18.Allen AC, Bailey EM, Brenchley PE, Buck KS, Barratt J, Feehally J: Mesangial IgA1 in IgA nephropathy exhibits aberrant O-glycosylation: Observations in three patients. Kidney Int 60: 969–973, 2001 [DOI] [PubMed] [Google Scholar]
- 19.Hiki Y, Odani H, Takahashi M, Yasuda Y, Nishimoto A, Iwase H, Shinzato T, Kobayashi Y, Maeda K: Mass spectrometry proves under-O-glycosylation of glomerular IgA1 in IgA nephropathy. Kidney Int 59: 1077–1085, 2001 [DOI] [PubMed] [Google Scholar]
- 20.Varis J, Rantala I, Pasternack A, Oksa H, Jäntti M, Paunu ES, Pirhonen R: Immunoglobulin and complement deposition in glomeruli of 756 subjects who had committed suicide or met with a violent death. J Clin Pathol 46: 607–610, 1993 [DOI] [PMC free article] [PubMed] [Google Scholar]
- 21.Suzuki K, Honda K, Tanabe K, Toma H, Nihei H, Yamaguchi Y: Incidence of latent mesangial IgA deposition in renal allograft donors in Japan. Kidney Int 63: 2286–2294, 2003 [DOI] [PubMed] [Google Scholar]
- 22.Garrett WS, Gordon JI, Glimcher LH: Homeostasis and inflammation in the intestine. Cell 140: 859–870, 2010 [DOI] [PMC free article] [PubMed] [Google Scholar]
- 23.Hooper LV, Macpherson AJ: Immune adaptations that maintain homeostasis with the intestinal microbiota. Nat Rev Immunol 10: 159–169, 2010 [DOI] [PubMed] [Google Scholar]
- 24.Rescigno M, Di Sabatino A: Dendritic cells in intestinal homeostasis and disease. J Clin Invest 119: 2441–2450, 2009 [DOI] [PMC free article] [PubMed] [Google Scholar]
- 25.Gaboriau-Routhiau V, Rakotobe S, Lécuyer E, Mulder I, Lan A, Bridonneau C, Rochet V, Pisi A, De Paepe M, Brandi G, Eberl G, Snel J, Kelly D, Cerf-Bensussan N: The key role of segmented filamentous bacteria in the coordinated maturation of gut helper T cell responses. Immunity 31: 677–689, 2009 [DOI] [PubMed] [Google Scholar]
- 26.Boumediene A, Oblet C, Oruc Z, Duchez S, Morelle W, Huynh A, Pourrat J, Aldigier JC, Cogné M: Gammopathy with IgA mesangial deposition provides a monoclonal model of IgA nephritogenicity and offers new insights into its molecular mechanisms. Nephrol Dial Transplant 26: 3930–3937, 2011 [DOI] [PubMed] [Google Scholar]
- 27.Monteiro RC, Chevailler A, Noel LH, Lesavre P: Serum IgA preferentially binds to cationic polypeptides in IgA nephropathy. Clin Exp Immunol 73: 300–306, 1988 [PMC free article] [PubMed] [Google Scholar]
- 28.Zickerman AM, Allen AC, Talwar V, Olczak SA, Brownlee A, Holland M, Furness PN, Brunskill NJ, Feehally J: IgA myeloma presenting as Henoch-Schönlein purpura with nephritis. Am J Kidney Dis 36: E19, 2000 [DOI] [PubMed] [Google Scholar]
- 29.Coppo R, Amore A, Roccatello D: Dietary antigens and primary immunoglobulin A nephropathy. J Am Soc Nephrol 2[Suppl]: S173–S180, 1992 [DOI] [PubMed] [Google Scholar]
- 30.Sategna-Guidetti C, Ferfoglia G, Bruno M, Pulitano R, Roccatello D, Amore A, Coppo R: Do IgA antigliadin and IgA antiendomysium antibodies show there is latent coeliac disease in primary IgA nephropathy? Gut 33: 476–478, 1992 [DOI] [PMC free article] [PubMed] [Google Scholar]
- 31.Coppo R, Amore A, Gianoglio B, Reyna A, Peruzzi L, Roccatello D, Alessi D, Sena LM: Serum IgA and macromolecular IgA reacting with mesangial matrix components. Contrib Nephrol 104: 162–171, 1993 [DOI] [PubMed] [Google Scholar]
- 32.Novak J, Tomana M, Matousovic K, Brown R, Hall S, Novak L, Julian BA, Wyatt RJ, Mestecky J: IgA1-containing immune complexes in IgA nephropathy differentially affect proliferation of mesangial cells. Kidney Int 67: 504–513, 2005 [DOI] [PubMed] [Google Scholar]
- 33.Novak J: Induction of IgA deposits and glomerulonephritis by IgA rheumatoid factor. J Am Soc Nephrol 23: 371–373, 2012 [DOI] [PMC free article] [PubMed] [Google Scholar]
- 34.Novak J, Julian BA, Mestecky J, Renfrow MB: Glycosylation of IgA1 and pathogenesis of IgA nephropathy. Semin Immunopathol 34: 365–382, 2012 [DOI] [PubMed] [Google Scholar]
- 35.Erlandsson L, Andersson K, Sigvardsson M, Lycke N, Leanderson T: Mice with an inactivated joining chain locus have perturbed IgM secretion. Eur J Immunol 28: 2355–2365, 1998 [DOI] [PubMed] [Google Scholar]
- 36.Bridoux F, Desport E, Frémeaux-Bacchi V, Chong CF, Gombert J-M, Lacombe C, Quellard N, Touchard G: Glomerulonephritis with isolated C3 deposits and monoclonal gammopathy: A fortuitous association? Clin J Am Soc Nephrol 6: 2165–2174, 2011 [DOI] [PMC free article] [PubMed] [Google Scholar]
- 37.Sandin C, Linse S, Areschoug T, Woof JM, Reinholdt J, Lindahl G: Isolation and detection of human IgA using a streptococcal IgA-binding peptide. J Immunol 169: 1357–1364, 2002 [DOI] [PubMed] [Google Scholar]
- 38.Allen AC, Harper SJ, Feehally J: Galactosylation of N- and O-linked carbohydrate moieties of IgA1 and IgG in IgA nephropathy. Clin Exp Immunol 100: 470–474, 1995 [DOI] [PMC free article] [PubMed] [Google Scholar]
- 39.Tomana M, Matousovic K, Julian BA, Radl J, Konecny K, Mestecky J: Galactose-deficient IgA1 in sera of IgA nephropathy patients is present in complexes with IgG. Kidney Int 52: 509–516, 1997 [DOI] [PubMed] [Google Scholar]
- 40.Morelle W, Michalski J-C: Analysis of protein glycosylation by mass spectrometry. Nat Protoc 2: 1585–1602, 2007 [DOI] [PubMed] [Google Scholar]
- 41.Faid V, Evjen G, Tollersrud O-K, Michalski J-C, Morelle W: Site-specific glycosylation analysis of the bovine lysosomal alpha-mannosidase. Glycobiology 16: 440–461, 2006 [DOI] [PubMed] [Google Scholar]
- 42.Morelle W, Faid V, Chirat F, Michalski J-C: Analysis of N- and O-linked glycans from glycoproteins using MALDI-TOF mass spectrometry. Methods Mol Biol 534: 5–21, 2009 [DOI] [PubMed] [Google Scholar]
- 43.Nam CH, Moutel S, Teillaud J-L: Generation of murine scFv intrabodies from B-cell hybridomas. Methods Mol Biol 193: 301–327, 2002 [DOI] [PubMed] [Google Scholar]
- 44.Yuan X, Gubbins MJ, Berry JD: A simple and rapid protocol for the sequence determination of functional kappa light chain cDNAs from aberrant-chain-positive murine hybridomas. J Immunol Methods 294: 199–207, 2004 [DOI] [PubMed] [Google Scholar]
- 45.Legardinier S, Legrand B, Raguénès-Nicol C, Bondon A, Hardy S, Tascon C, Le Rumeur E, Hubert J-F: A two-amino acid mutation encountered in Duchenne muscular dystrophy decreases stability of the rod domain 23 (R23) spectrin-like repeat of dystrophin. J Biol Chem 284: 8822–8832, 2009 [DOI] [PMC free article] [PubMed] [Google Scholar]
- 46.Kusunoki H, Minasov G, Macdonald RI, Mondragón A: Independent movement, dimerization and stability of tandem repeats of chicken brain alpha-spectrin. J Mol Biol 344: 495–511, 2004 [DOI] [PubMed] [Google Scholar]
- 47.Aucouturier P, Bauwens M, Khamlichi AA, Denoroy L, Spinelli S, Touchard G, Preud’homme JL, Cogné M: Monoclonal Ig L chain and L chain V domain fragment crystallization in myeloma-associated Fanconi’s syndrome. J Immunol 150: 3561–3568, 1993 [PubMed] [Google Scholar]
Associated Data
This section collects any data citations, data availability statements, or supplementary materials included in this article.


