ABSTRACT
Cancer stem cells (CSC) are tumorigenic and resistant to chemotherapy. In colorectal cancer (CRC), CSCs have been identified by the expression of specific markers, including CD44, Bmi1 and Nanog. Although p21-activated kinase 1 (PAK1), acting downstream of Ras, stimulates Wnt/β-catenin signaling and is known to play an important role in CRC development and progression, the role of PAK1 in the expression of CSC markers has not previously been investigated. The effect of PAK1 over-expression, knockdown or inhibition on the expression or alteration (in the case of CD44) of CSC markers in human CRC cell lines was measured by immunofluorescence and Western blotting. The effect of PAK1 modulation on tumorigenesis, and on resistance to treatment with 5-fluorouracil (5-FU), was measured by sphere formation in vitro and by growth of xenografted tumors in vivo. The results show that PAK1 activity correlated with the expression of CSC markers and the CD44 isoform profile, and with tumor growth both in vitro and in vivo. Furthermore PAK overexpression partially overcame the inhibition of CRC growth by 5-FU, and PAK inhibition was synergistic with 5-FU treatment. Our findings lay the foundation for a combination therapy in which PAK1 inhibitors targeting CSCs may be combined with conventional 5-FU-based chemotherapy for the treatment of CRC.
KEYWORDS: Cancer stem cell markers, colorectal cancer, PAK1, 5-FU
Introduction
Cancers contain heterogeneous populations of cells. Cancer stem cells (CSCs) are defined as cells that are endowed with the capacity to both self-renew and to differentiate into the various cell lineages within a tumor.1 These characteristics of CSCs contribute to tumor recurrence and resistance to treatment. Accumulating evidence shows the existence of CSC in colorectal cancer (CRC).2 5-fluorouracil (5-FU), a potent inhibitor of thymidylate synthase, is widely used in the treatment of a variety of solid tumors, particularly in CRC.2 Resistance to treatment, which leads to tumor recurrence and metastasis, is thought to be mediated by the continuing activity of CSC. In CRC, several stem cell markers, including CD44, Bmi1 and Nanog, have been identified. These markers not only play significant roles in colony formation in vitro and in tumor initiation in xenografts in vivo, but are also associated with metastasis, poor prognosis and decreased survival of patients.3
CD44, a cell adhesion and signaling molecule, is expressed in intestinal stem cells (SCs)4,5 and is involved in the initiation and progression of intestinal tumors.6 Prominent expression of CD44 is a hallmark of highly tumorigenic CRC cells,7 and is part of an intestinal SC gene signature, which is associated with CRC cells with high-tumor initiating potential and long-term self-renewal capacity, and which therefore predicts disease relapse in CRC patients.8 The different isoforms of CD44, generated by alternative splicing, have distinct roles in CRC progression.9,10 In particular upregulation of high molecular-weight CD44 isoforms and down-regulation of low molecular weight CD44 isoforms are associated with transformation of colonic mucosa to carcinoma.9 Bmi1 (B lymphoma Mo-MLV insertion region 1 homolog) marks mouse intestinal SCs and is important for crypt maintenance.11 Bmi1 is overexpressed in CRC, and its expression is associated with increased risk of metastasis and with higher grade tumors.12-14 A recent study has proposed a role for Bmi1 in CRC initiating cells (CICs) and self-renewal by showing that Bmi1 is required for CIC function in colorectal tumors, and that small-molecule-mediated Bmi1 inhibition reduces tumor burden in primary human CRC xenograft models.15 Nanog, a SC transcription factor, is essential for embryonic development, for reprogramming normal adult cells, and for malignant transformation and progression. Nanog knockdown inhibited proliferation, colony formation, and tumorigenicity in vivo, but increased the sensitivity of CRC cells to 5-FU.16 Overexpression of Nanog promoted proliferation, motility and migration of human CRC cells, and was strongly correlated with poor prognosis, lymph node metastasis and higher grade tumors.17
The tumorigenicity of colorectal cancer (CRC) is largely determined by the heterogeneous intracellular distribution of Wnt/β-catenin activity, which in turn is regulated by signaling molecules in response to the tumor microenvironment.18 Mutations in KRas are positively correlated with the expression levels of CSC markers including CD44, as well as with an increase in the nuclear localization of β-catenin in CRC patients.19,20 P21-activated kinase 1 (PAK1), activated by Ras, stimulates CRC metastasis by ERK-dependent phosphorylation of FAK.21 Conversely inhibition of PAK1 by shRNA knockdown decreases cell proliferation, migration and survival through suppression of ERK and AKT in CRC cells harbouring mutations of both APC and KRas.22 PAK1 associates with β-catenin in CRC cells, and PAK1 knockdown inhibits β-catenin activation and abrogates growth and metastasis of CRC cell lines in xenograft and liver metastasis models in mice.23 PAK1, acting downstream of Ras, stimulates Wnt/β-catenin activation, and is critical for CRC growth and metastasis. Thus PAK1 may function as a key molecule affecting tumorigenesis, which in turn may contribute to therapeutic resistance of CRC. In this study, we have investigated the effects of PAK1 on the expression of CSC markers and tumorigenesis of CRC and its impact on resistance to therapy with 5-FU.
Results
PAK1 stimulated tumorigenesis of CRC cells by up-regulation of the expression of CSC markers
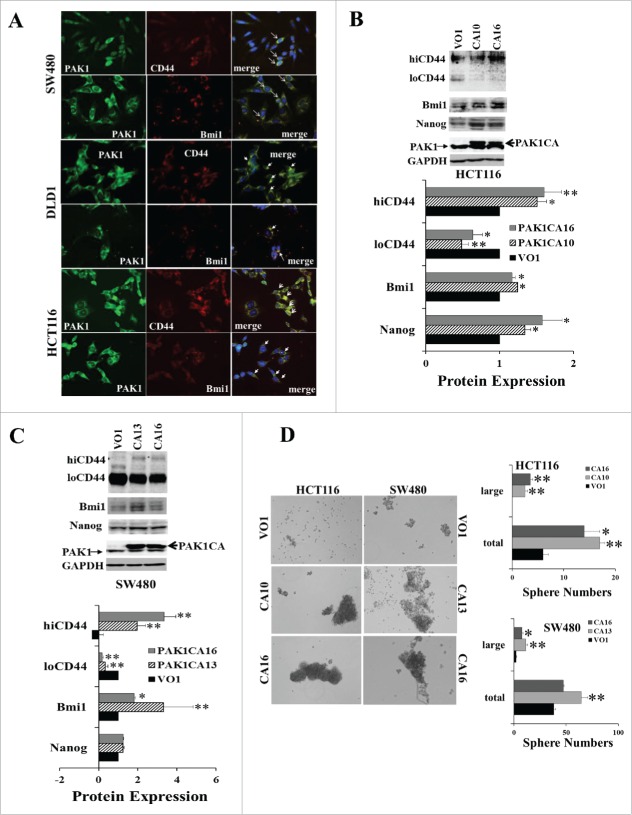
In the human CRC cell lines SW480, DLD1 and HCT116, PAK1 expression was detected in all cells, although the intensity of PAK1 staining was greater in cells that were co-stained for the CSC markers CD44 or Bmi1 (Fig. 1A). The effect of PAK1 on the expression of the CSC markers CD44, Nanog and Bmi1 was measured in clones with either reduced PAK1 expression (generated by shRNA knockdown (KD)) or enhanced PAK1 expression (generated by transfection with a plasmid encoding a constitutively active (CA) PAK1). PAK1 expression in PAK1 KD clones was reduced by more than 90%22; in contrast there was no change in the expression of PAK2 (Fig. S1). PAK3 expression was not detected in the parent CRC cell lines.
Figure 1.
Increased PAK1 activity upregulated the expression of CSC markers and stimulated sphere formation by CRC cells. (A) The human CRC cell lines DLD1, HCT116 and SW480 were stained with antibodies against PAK1, or the CSC markers CD44 or Bmi1, or with the nuclear marker DAPI (blue). The intensity of PAK1 staining was greater in cells stained with CD44 or Bmi1. The arrows indicate doubly stained cells. (B, C) Sphere formation by HCT116 or SW480 cells transfected with constitutively active (CA) PAK1 or vector only 26 was assayed as described in Material and Methods by counting after 9 d. The expression of the CSC markers CD44 (with high (hiCD44) or low (loCD44) molecular weights), Bmi1 and Nanog was determined by Western blot. PAK1 CA stimulated the expression of hiCD44, Bmi1 and Nanog, but decreased the expression of loCD44 in HCT116 (B) and SW480 (C) cells. (D) The numbers of spheres formed were increased in PAK1 CA cells. Spheres containing more than 100 cells were classified as large. *, p < 0.05, **, p < 0.01 compared to the values for VO cells.
Overexpression of CA PAK1 resulted in significant increases in expression of CSC markers. In both HCT116 and SW480 cells with over-expression of PAK1 CA, the loCD44 proteins were significantly reduced while the hiCD44 increased (Fig. 1B, C). The shift of CD44 from low (loCD44) to high (hiCD44) molecular weight has been associated with malignant transformation of CRC.9 Bmi1 was significantly increased in both HCT116 and SW480 cells over-expressing PAK1 CA (Fig. 1B, C). Nanog was also significantly increased in HCT116 PAK1 CA cells, but not in SW480 PAK1 CA cells (Fig. 1B, C). Sphere formation, which is a measure of tumorigenesis, was significantly increased in HCT116 and SW480 cells expressing PAK1 CA (Fig. 1D).
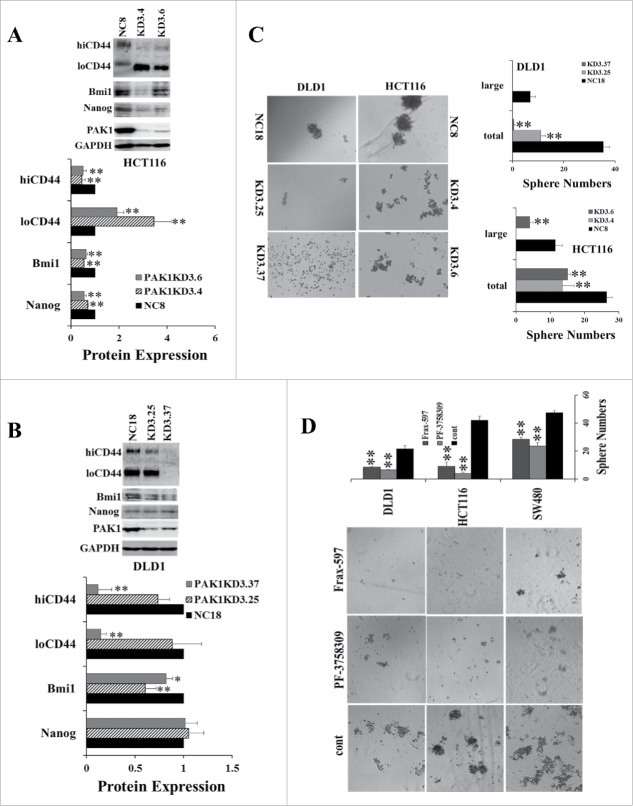
In contrast, when PAK1 was knocked down, loCD44 was increased in HCT116 PAK1 KD cells while hiCD44 was significantly reduced. However both loCD44 and hiCD44 were decreased in DLD1 PAK1 KD cells (Fig. 2A, B). Both Bmi1 and Nanog were decreased in HCT116 PAK1 KD cells, and Bmi1 was also decreased in DLD1 PAK1 KD cells (Fig. 2A, B). Consistent with the changes in the expression of these CSC markers, the numbers of spheres formed in both HCT116 and DLD1 PAK1 KD cells were decreased significantly (Fig. 2C). Similarly the numbers of spheres formed in wild type DLD1, HCT116 and SW480 cells were suppressed by treatment with either the inhibitor Frax-597 (selective for group 1 PAKs, and inactive against group 2 PAKs24) or the inhibitor PF-3758309 (selective for PAK1 and PAK425) (Fig. 2D). As the affinity of PF-3758309 for PAK2 is greater than 10 times lower than its affinity for PAK1,25 and PAK3 was not detected in the colorectal cell lines used here, the effect of PF-3758309 must be via inhibition of PAK1, not PAK2 or PAK3. The fact that both Frax-597 and PF-3758309 suppressed the growth of these colorectal cells suggested that PAK1 is the target of these inhibitors here. Together these results indicate that PAK1 is required for the expression of CSC markers, and that activation of PAK1 stimulates tumorigenesis of CRC via upregulation of CSC markers.
Figure 2.
Inhibition of PAK1 suppressed the expression of CSC markers and sphere formation by CRC cells. (A, B) The expression of the CSC markers hiCD44, loCD44, Bmi1 and Nanog was determined in PAK1 knockdown (KD) clones of HCT116 (A) and DLD1 (B) cells by Western blot. (C) Sphere formation by negative control cells (NC, transfected with a scrambled sequence) or PAK1 KD cells was assayed as described in Material and Methods, by counting after 15 d. (D) Sphere formation by wild type cells was assayed with or without the PAK1 inhibitors Frax-597 (1 μM) or PF-3758309 (50 nM for DLD1 and HCT116, 100 nM for SW480) by the same method. Spheres containing more than 100 cells were classified as large. *, p < 0.05, **, p < 0.01 compared to the values from NC cells (C) or control (cont, D).
Increased expression of CSC markers was associated with increased PAK1 activity in 5-FU-resistant tumor xenografts
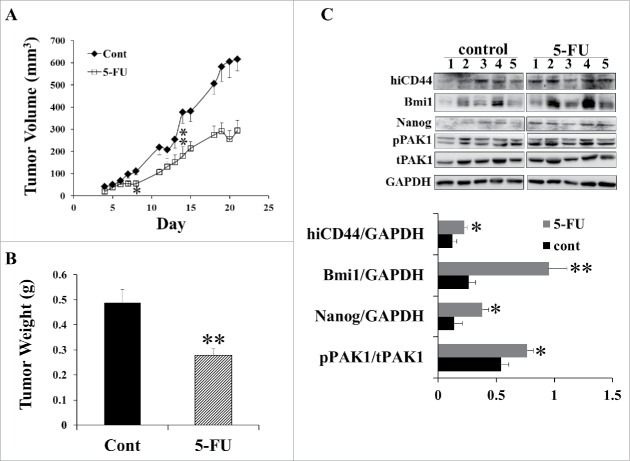
The above data suggest that PAK1 modulates the expression of CSC markers in human CRC cell lines, and contributes to tumorigenesis. To investigate the effect of PAK1 on CRC drug resistance, HCT116 cells were subcutaneously injected into the flanks of SCID mice, and the animals were treated with 5-FU via peritoneal injection as described in Materials and Methods. 5-FU inhibited the growth of xenografted tumors from day 9 onward, and by day 21, the tumor volume and weight were reduced by 50% (Fig. 3A) and 43% (Fig. 3B), respectively. Importantly, Western blots of the proteins extracted from control and 5-FU-treated tumors demonstrated that the expression of the CSC markers hiCD44, Bmi1 and Nanog was significantly greater in 5-FU-treated tumors (Fig. 3C). In fact loCD44 was undetectable in HCT116 xenografted tumors. These changes were associated with greater PAK1 activity, as assessed by measurement of the active phosphorylated form of PAK1 (Fig. 3C). However the total PAK1 level was not changed. This result suggests that increased PAK1 activity up-regulated the expression of CSC markers in these tumors, which in turn contributed to 5-FU-resistant growth of the tumors.
Figure 3.
Greater PAK1 activity was associated with increased expression of CSC markers in 5-FU-treated CRC xenografts. HCT116 cells (2 × 10⁶/100 ul) were subcutaneously injected into the flanks of 6-week-old Scid mice, which were divided into 2 groups (n = 5): control, 23 ip with 5% DMSO saline, and 5-FU, 30 mg/Kg, ip every other day from day 4 to day 21. (A) Tumor volumes were measured with calipers, and (B) tumors were weighed at the end of the experiment. (C) The concentrations of the CSC markers hiCD44, Bmi1 and Nanog, and of phosphorylated and active PAK1 (pPAK1), total PAK1 (tPAK1) and GAPDH, were measured by Western blotting. *, p < 0.05, **, p < 0.01 compared to the values for control tumors.
Inhibition of PAK1 decreased expression of CSC markers and suppressed tumor growth
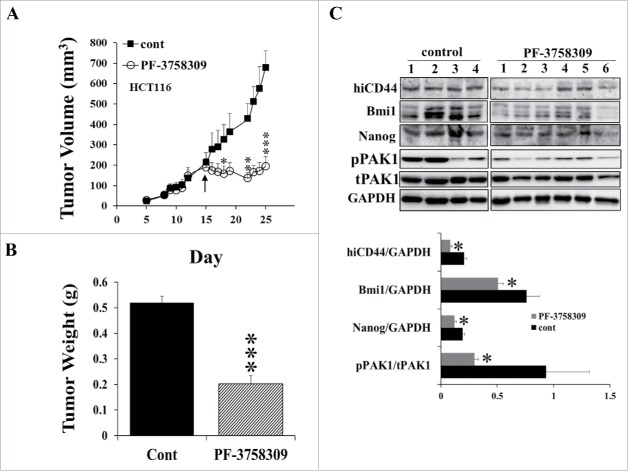
Since increased PAK1 activity was associated with increased expression of CSC markers in 5-FU-resistant tumors, treatment with a PAK1 inhibitor would be expected to suppress growth by downregulation of the expression of CSC markers. To test this hypothesis, mice with xenografted tumors were treated with the PAK inhibitor PF-3758309, starting from either day 4 when the tumor began to grow or day 15 when tumor size was at least 200 mm3. PF-3758309 given from day 4 completely blocked the growth of xenografted tumors from 2 CRC cell lines (HCT116 and HT29, Fig. S2). Similarly PF-3758309 given from day 15 stopped further tumor growth during 2 weeks of treatment (Fig. 4A), and reduced the tumor weight to 38% of control (Fig. 4B). In parallel, the expression of the CSC markers hiCD44, Bmi1 and Nanog was significantly reduced in PF-3758309-treated tumors (Fig. 4C). PAK1 activity (pPAK1/tPAK1) was decreased while the level of total PAK1 was not affected by PF-3758309 (Fig. 4C). These data indicate that inhibition of PAK1 suppressed the expression of CSC markers, and this suppression was associated with cessation of tumor growth.
Figure 4.
Inhibition of PAK1 by PF-3758309 decreased the expression of CSC markers in CRC xenografts and blocked tumor growth. HCT116 cells (2 × 10⁶/100 ul) were subcutaneously injected into the flank of 6-week-old Scid mice, which were divided into 2 groups: control (cont, n = 4), ip with 5% DMSO saline, and PF-3758309 (n = 6), 10 mg/Kg, ip. Daily PF-3758309 treatment was started at day 15 as indicated by the arrow, and continued for 2 weeks. (A) Tumor volumes were measured with calipers, and (B) tumors were weighed at the end of the experiment. (C) The concentrations of the CSC markers hiCD44, Bmi1 and Nanog, and of phosphorylated and active PAK1 (pPAK1), total PAK1 (tPAK1) and GAPDH in tumor extracts were measured by Western blotting. *, p < 0.05, **, p < 0.01, ***, p < 0.001, compared to the values for control tumors.
Overexpression of constitutively active PAK1 increased the expression of CSC markers and partially overcame the inhibition of tumor growth by 5-FU
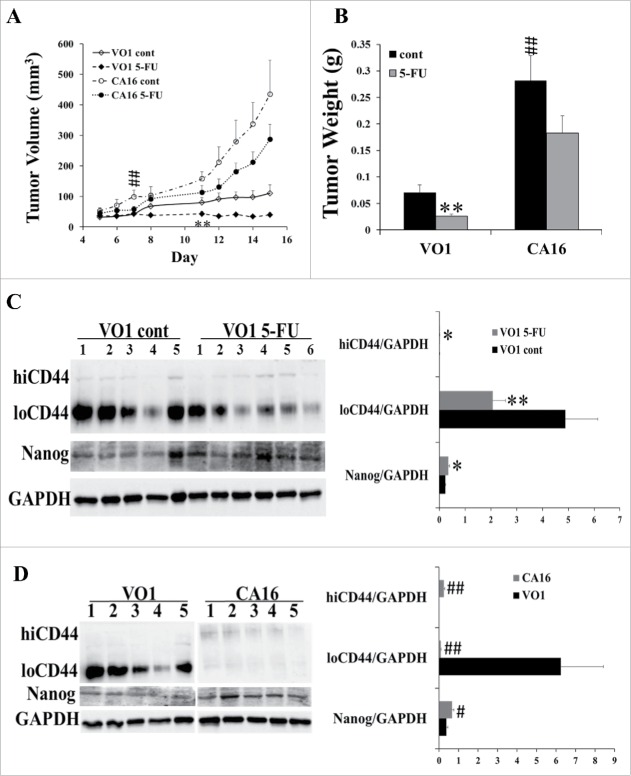
To further examine the relationship between PAK1 activity, expression of CSC markers and tumor growth in the presence of 5-FU, SW480 cells transfected either with constitutively active (CA) PAK1 or with vector only26 were injected into SCID mice and the animals were treated with 5-FU. In the control mice the PAK1 CA tumors grew significantly faster than the VO tumors, while 5-FU significantly inhibited the growth of VO tumors but not PAK1 CA tumors (Fig. 5A, B). Although a slight reduction was apparent in the tumor volume (Fig. 5A) or weight (Fig. 5B) of 5-FU-treated PAK1 CA tumors compared to non 5-FU treated, these changes did not reach statistical significance (Fig. 5A and B). SW480 VO tumors treated with 5-FU had greater amounts of hiCD44 and Nanog, and reduced amounts of loCD44 (Fig. 5C). As with the in vitro results obtained from SW480 PAK1 CA cells (Fig. 1), PAK1 CA tumors had greater expression of hiCD44 and Nanog with significantly reduced loCD44 (Fig. 5D). These results suggest that high PAK1 activity stimulated the expression of CSC markers, which in turn partially overcame the inhibition of tumor growth by 5-FU.
Figure 5.
Activation of PAK1 blocked the inhibition of CRC growth by 5-FU via up-regulation of CSC markers. SW480 cells transfected with constitutively active (CA) PAK1 or vector only (VO) 26 were subcutaneously injected into the flanks of 6-week-old Scid mice at 3 × 10⁶ cells/100 ul. The mice were divided into 4 groups: VO1 control (cont, n = 5), VO1 5-FU (n = 6), CA16 control (cont, n = 5) and CA16 5-FU (n = 6). 5-FU, 30 mg/Kg, was given by ip every other day from day 5 to day 15. Control mice were given 5% DMSO in saline. The tumor volume (A) and weight (B) were measured as described in Material and Methods. (C, D) The concentrations of the CSC markers hiCD44, loCD44, and Nanog, and of GAPDH in tumor extracts were measured by Western blotting. *, p < 0.05, **, p < 0.01, VO1 5-FU vs VO1 cont; #, p < 0.05, ##, p < 0.01, CA16 cont vs VO1 cont. The labels VO1 or CA16 in D represent the data obtained the VO1 or CA16 control mice treated with 5% DMSO.
The activity of PAK1 was critical for the response of CRC cells to 5-FU treatment
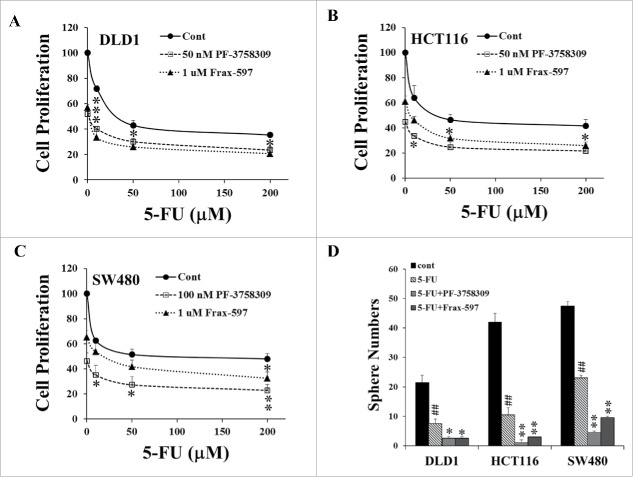
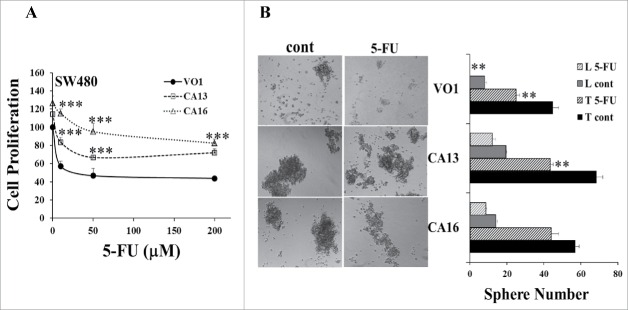
The in vivo experiments described above demonstrated that 5-FU-resistant tumors had increased PAK1 activity, which was associated with increased expression of CSC markers (Fig. 3), and that stimulation of PAK1 enhanced the expression of CSC markers and 5-FU-resistant tumor growth (Fig. 5). To determine the effect of PAK1 activity on the response of CRC cells to 5-FU in vitro, wild type (Fig. 6) and PAK1 CA (Fig. 7) cells were pre-treated with the PAK1 inhibitors PF-3758309 or Frax-597, and then cultured with 5-FU at the indicated concentrations. Pre-treatment with either PAK1 inhibitor enhanced the inhibition of cell proliferation by 5-FU (Fig. 6A-C), while over-expression of CA PAK1 in CRC cells reduced the inhibitory effect of 5-FU on these cells (Fig. 7A). Similarly co-treatment of cells with 5-FU plus either PF-3758309 or Frax-597 further increased the inhibition of sphere formation by 5-FU (Fig. 6D, E), while PAK1 CA reduced or blocked the inhibition of sphere formation by 5-FU (Fig. 7B). These results indicate that the activity of PAK1 is critical for the response of CRC cells to 5-FU.
Figure 6.
Inhibition of PAK1 enhanced the inhibitory effects of 5-FU on CRC cells. (A-C) After pre-treatment with PF-3758309 or Frax-597, DLD1 (A), HCT116 (B) or SW480 (C) cells were treated with 5-FU for 24 h, and cell proliferation was determined by cell counting. Inhibition of PAK1 enhanced the inhibition of proliferation by 5-FU in all 3 CRC cell lines. (D) In the sphere formation assay, 3 CRC cell lines were treated with 5-FU (50 μM) plus or minus Frax-597 (1 μM) or PF-3758309 (50 nM for DLD1 and HCT116, 100 nM for SW480), and sphere numbers were counted after 15 d. *, p < 0.05, **, p < 0.01, ***, p < 0.001, compared to the values of 5-FU-treated only. ##, p < 0.01, compared to control (cont, D).
Figure 7.
Activation of PAK1 reduced the inhibitory effects of 5-FU on CRC cells. SW480 cells transfected with constitutively active (CA) PAK1 or vector only 26 were cultured with 5-FU. (A) Cell proliferation was determined by cell counting. (B) In the sphere formation assay, VO and CA cells were treated with 5-FU (50 μM), and sphere numbers were counted after 10 d. Spheres containing more than 100 cells were classified as large. L: large, T: total, *, p < 0.05, **, p < 0.01, ***, p < 0.001, compared to the values from VO1 cells (A) or control (cont, B).
Discussion
In this paper, we have examined the role of PAK1 in the expression of CSC markers by human CRC cell lines and the impact of modulation of PAK1 activity on tumorigenesis and drug resistance. Overexpression of constitutively active PAK1 stimulated tumorigenesis of CRC both in vitro (sphere formation) and in vivo (growth of xenografted tumors) by enhancing the expression of CSC markers. Furthermore, the up-regulation of the expression of CSC markers and the stimulation of tumorigenesis by PAK1 were associated with 5-FU-resistant growth of CRC.
Our data indicate that PAK1 up-regulates the expression of CSC markers in the human CRC cell lines DLD1, HCT116 and SW480. Firstly, PAK1 co-localized with CSC markers in all 3 cell lines, and the intensity of PAK1 staining was greater in those cells which co-stained for CSC markers (Fig. 1A). Secondly, the expression of CSC markers correlated with PAK1 status. For example, cells with high PAK1 activity as a result of over-expression of constitutively active PAK1 (CA PAK1) showed enhanced expression of the CSC markers Bmi1, Nanog and high molecular weight CD44 (hiCD44) (Fig. 1B, C). In contrast, inhibition of PAK1 by shRNA knockdown reduced the expression of these CSC markers (Fig. 2A, B).
PAK1 also altered the isoform profile of CD44. Malignant transformation is frequently associated with alterations in CD44 mRNA splicing.26,27 In the case of CRC, the transformation of normal colonic mucosa to carcinoma is associated with a shift from CD44 from low (loCD44) to high (hiCD44) molecular weight isoforms.9,28 The data presented here demonstrates that the shift from loCD44 to hiCD44 is regulated by PAK1 in 3 CRC cell lines in vitro and in xenografts in vivo.
Our findings are consistent with the proposal that the upregulation of the expression of CSC markers in response to PAK1 results in an increase in tumorigenesis. For example, overexpression of CA PAK1 stimulated the tumorigenesis of CRC cells, as measured by increased sphere numbers in vitro (Fig. 1D) and more rapid tumor growth in a xenograft mouse model (Fig. 5A, B), and these increments were associated with up-regulation of CSC markers. In contrast, inhibition of PAK1 by shRNA knockdown or by chemical inhibitors suppressed the tumorigenesis of CRC cells with decreased sphere numbers and tumor growth in xenografts. These decrements were associated with down-regulation of CSC markers.
The stimulation of tumorigenesis by overexpression of constitutively active PAK1 is also associated with increased resistance to 5-FU treatment. CA PAK1-transfected CRC cells not only grew more rapidly in the xenograft mouse model, but were also resistant to 5-FU treatment (Fig. 5A, B). The higher levels of CSC markers in 5-FU-treated xenografted tumors were associated with greater amounts of the active, phosphorylated form of PAK1 (Fig. 3C), while inhibition of PAK1 by PF-3758309 suppressed CSC markers and reduced tumor growth (Fig. 4 & Fig. S1). Similarly the in vitro data showed that inhibition of cell proliferation and sphere formation by 5-FU was reduced in CA PAK1 cells (Fig. 7), but enhanced in CRC cells treated with PAK1 inhibitors (Fig. 6). Although 5-FU-based chemotherapy is routinely given to the majority of CRC patients, chemo-resistance becomes a major obstacle for CRC treatment, and 50% of metastatic CRC patients are resistant to 5-FU-based chemotherapy.29-31 Our discovery of a role for PAK1 in 5-FU-resistant CRC growth may stimulate the development of a combination therapy that utilises both PAK1 inhibitors and 5-FU to overcome resistance and improve response rates of CRC patients.
This paper reveals for the first time a role for PAK1 in regulation of the expression of CSC markers in human CRC cell lines. Our findings that PAK1 up-regulates the expression of CSC markers and contributes to 5-FU resistance lay the foundation for a combination therapy in which PAK1 inhibitors targeting CSCs may be combined with conventional 5-FU-based chemotherapy for the treatment of CRC.
Materials and methods
Cells and transfection
The human CRC cell lines DLD1, HCT116, SW480 and HT29 were obtained from the ATCC and cultured in Dulbecco's Modified Eagle's medium (DMEM) containing 5% fetal bovine serum (FBS). The PAK1 knockdown (KD) clones of DLD1 and HCT116 cells were generated by transfection with plasmid DNAs encoding either shRNA sequences (SABioscience, Frederick, MD) to silence the PAK1 gene specifically or with a scrambled sequence as a negative control using Lipofectin Reagent (Invitrogen, Melbourne, Australia) as described previously.22 The constitutively active (CA) PAK1 constructs (generously provided by Dr. Gary Bokoch, The Scripps Research Institute, La Jolla, CA) were sub-cloned into the pCDNA3.1 vector (Invitrogen, Melbourne, Australia). CA PAK1 plasmid DNA was sequenced to confirm the CA mutation site and then transfected into SW480 and HCT116 cells using Lipofectin Reagent (Invitrogen) as described previously.32
Cell proliferation assay
Cell proliferation was measured by cell count. Cells were seeded in a 96-well plate at 10 × 103 cells/well in DMEM containing 5% FBS. The wild type DLD1, HCT116, and SW480 cells were pre-incubated with the PAK inhibitors PF-3758309 (Active Biochemical Co. Maplewood, NJ) or Frax-597 (SYNthesis, Parkville, Australia) at the indicated concentrations for 18 h. The medium was then removed, and the cells were washed once and treated with the concentrations of 5-FU (Sigma-Aldrich, Castle Hill, Australia) indicated in the text. The CA PAK1 transfected SW480 cells were treated directly with 5-FU at the indicated concentrations without any pre-treatment with PAK inhibitors. After 24 h 5-FU treatment, the cells were counted with a haemocytometer under a microscope.
Immunofluorescent stain
The immunofluorescent staining of CRC cells with antibodies specific for PAK1 or CSC markers was performed according to previous methods.33 The cells were grown on a glass slide, and fixed with cold methanol and permeabilized with 0.2% Triton-X 100 in PBS. After blocking with 0.2% gelatin in PBS at room temperature for 30 min, the cells were incubated with antibodies against PAK1 (1:100, Cell Signaling, Danvers, MA), Bmi1 (1:100, Santa Cruz Biotechnology, Santa Cruz, CA) or CD44 (1:100, Cell Signaling) at 4°C overnight, followed by incubation with secondary Alexa Fluor 546-conjugated anti-mouse or Alexa Fluor 488-conjugated anti-rabbit antibodies (Invitrogen, Melbourne, Australia) at room temperature for 1 h. The cells were then washed 3 times and incubated in 300 nM DAPI (4′,6-diamidino-2-phenylindole dihydrochloride, Life Technologies, Scoresby, Australia) in PBS for 5 min. The samples were observed and photographed using an Evos cell image system (Life Technologies).
Sphere formation assay
The sphere formation was assayed according to a published method.34 5,000 or 10,000 cells were planted in 24-well ultralow attachment plates (Sigma-Aldrich) in serum free DME containing 10 ng/ml bFGF, 10 μg/ml human insulin, 100 μg/ml human transferrin and 100 μg/ml bovine serum Albumin (BSA) (Sigma-Aldrich). The cells were incubated with or without 5-FU plus or minus Frax-597 or PF-3758309 at 37°C with 5% CO2 for 9 or 15 d. The numbers of spheres formed were counted under a microscope with 10x or 20x magnification. Images were taken with an Evos cell image system (Life Technologies).
Mouse xenograft study
The mouse experiments were conducted at the Austin Bioresources Center, Austin Health (Melbourne, Australia) with ethics approval (permit number: A2010/04016) from the Austin Health Animal Ethics Committee. SCID mice were purchased from the Animal Resource Center (Perth, Australia). HCT116 and HT29 cells (2.5 × 10⁶ cells/100μl/site) were injected subcutaneously into the flanks of 6 week old SCID mice. On day 4 after subcutaneous injection of the cells, PF-3758309 (25 mg/kg, dissolved in 5% DMSO in saline) was given by intra-peritoneal injection, every day from Monday to Friday for 3 weeks. Alternatively, on day 15 after subcutaneous injection, when HCT116 xenograft tumor sizes were bigger than 200 mm3, PF-3758309 (25 mg/kg, dissolved in 5% DMSO in saline) was given by intra-peritoneal injection, every day from Monday to Friday for 2 weeks.
In mice with HCT116 xenografts, 5-FU (30 mg/kg, dissolved in 5% DMSO in saline) was given by intra-peritoneal injection from day 4 of cell injection, every other day from Monday to Friday for 3 weeks. The control mice were given 5% DMSO in saline.
To determine whether PAK1 altered the sensitivity to 5-FU treatment, SW480 VO1 (vector only) and CA16 (PAK1 CA) cells (3 × 10⁶ cells/100μl/site) were injected subcutaneously into the flanks of 6 week old SCID mice. On day 5 after subcutaneous injection, 5-FU (30 mg/kg, dissolved in 5% DMSO in saline) was given by intra-peritoneal injection, every other day from Monday to Friday for 10 d. Tumor dimensions were measured with a caliper, and tumor volumes calculated as ½ L (length) × w2 (width).
At the end of each of the experiments, mice were sacrificed, and the tumors excised, weighed and frozen for protein extraction and Western blot.
Western blots
Cells were lysed in SDS sample buffer. The proteins in cell lysates were resolved by SDS-polyacrylamide gel (SDS-PAGE), and detected with antibodies against Bim1 (Gene Tex, Irvine, CA), Nanog (Santa Cruz Biotechnology, Santa Cruz, CA), CD44, PAK1 or GAPDH (Cell Signaling). Bound antibodies were visualized using ECL reagents (GE Healthcare, Amersham, UK), and the density of each band was analyzed using Multi-gauge computer software (Berthold, Bundoora, Australia).
50 mg samples of frozen xenografted tumors were homogenized using an ultra Turrax T25 homogenizer (Janke and Kunkel, Staufen, Germany) in 500 µl tissue lysis buffer (150 mM NaCl, pH 7.5, 50 mM HEPES, 10 mM EDTA, 10 mM Na4P2O7, 100 mM NaF, protease inhibitor cocktail (Roche)) as described before.32 The lysates were then centrifuged at 13,000 rpm for 10 minutes at 4°C, and supernatants were collected. Proteins were separated by SDS-PAGE. Protein expression was determined with the antibodies indicated in the text.
Statistical analysis
All values are expressed as means + standard error. Results were analyzed by one-way analysis of variance or t-test as appropriate with the program Sigma Stat (Systat Software Inc., San Jose, CA). Differences between 2 means with p < 0.05 were considered significant.
Supplementary Material
Disclosure of potential conflicts of interest
No potential conflicts of interest were disclosed.
Funding
This work was supported by grants from the National Health and Medical Research Council of Australia (1041831, GB/AS; 1020983, GB), and the Austin Medical Research Foundation (He2013, He2015).
Author contributions
AS, GSB and HH conceived and designed the study; NH and HH acquired, analyzed and interpreted the data; HH drafted the manuscript; NH, AS, GSB and HH reviewed and revised the manuscript.
References
- 1.Vermeulen L, Sprick MR, Kemper K, Stassi G, Medema JP. Cancer stem cells–old concepts, new insights. Cell Death Differ 2008; 15:947-58; PMID:18259194; http://dx.doi.org/ 10.1038/cdd.2008.20 [DOI] [PubMed] [Google Scholar]
- 2.Kozovska Z, Gabrisova V, Kucerova L. Colon cancer: cancer stem cells markers, drug resistance and treatment. Biomed Pharmacother = Biomed Pharmacother 2014; 68:911-6; PMID:25458789; http://dx.doi.org/ 10.1016/j.biopha.2014.10.019 [DOI] [PubMed] [Google Scholar]
- 3.Vaiopoulos AG, Kostakis ID, Koutsilieris M, Papavassiliou AG. Colorectal cancer stem cells. Stem Cells 2012; 30:363-71; PMID:22232074; http://dx.doi.org/ 10.1002/stem.1031 [DOI] [PubMed] [Google Scholar]
- 4.Wielenga VJ, Smits R, Korinek V, Smit L, Kielman M, Fodde R, Clevers H, Pals ST. Expression of CD44 in Apc and Tcf mutant mice implies regulation by the WNT pathway. Am J Pathol 1999; 154:515-23; PMID:10027409; http://dx.doi.org/ 10.1016/S0002-9440(10)65297-2 [DOI] [PMC free article] [PubMed] [Google Scholar]
- 5.Zeilstra J, Joosten SP, Dokter M, Verwiel E, Spaargaren M, Pals ST. Deletion of the WNT target and cancer stem cell marker CD44 in Apc(Min/+) mice attenuates intestinal tumorigenesis. Cancer Res 2008; 68:3655-61; PMID:18483247; http://dx.doi.org/ 10.1158/0008-5472.CAN-07-2940 [DOI] [PubMed] [Google Scholar]
- 6.Zoller M. CD44: can a cancer-initiating cell profit from an abundantly expressed molecule? Nat Rev Cancer 2011; 11:254-67; PMID:21390059; http://dx.doi.org/ 10.1038/nrc3023 [DOI] [PubMed] [Google Scholar]
- 7.Dalerba P, Dylla SJ, Park IK, Liu R, Wang X, Cho RW, Hoey T, Gurney A, Huang EH, Simeone DM, et al.. Phenotypic characterization of human colorectal cancer stem cells. Proc Natl Acad Sci U S A 2007; 104:10158-63; PMID:17548814; http://dx.doi.org/ 10.1073/pnas.0703478104 [DOI] [PMC free article] [PubMed] [Google Scholar]
- 8.Merlos-Suarez A, Barriga FM, Jung P, Iglesias M, Cespedes MV, Rossell D, Sevillano M, Hernando-Momblona X, da Silva-Diz V, Muñoz P, et al.. The intestinal stem cell signature identifies colorectal cancer stem cells and predicts disease relapse. Cell Stem Cell 2011; 8:511-24; PMID:21419747; http://dx.doi.org/ 10.1016/j.stem.2011.02.020 [DOI] [PubMed] [Google Scholar]
- 9.Choi SH, Takahashi K, Eto H, Yoon SS, Tanabe KK. CD44s expression in human colon carcinomas influences growth of liver metastases. Int J Cancer J Int du Cancer 2000; 85:523-6; PMID:10699925; http://dx.doi.org/ 10.1002/(SICI)1097-0215(20000215)85:4%3c523::AID-IJC13%3e3.0.CO;2-6 [DOI] [PubMed] [Google Scholar]
- 10.Saito S, Okabe H, Watanabe M, Ishimoto T, Iwatsuki M, Baba Y, Tanaka Y, Kurashige J, Miyamoto Y, Baba H. CD44v6 expression is related to mesenchymal phenotype and poor prognosis in patients with colorectal cancer. Oncol Rep 2013; 29:1570-8; PMID:23404221 [DOI] [PubMed] [Google Scholar]
- 11.Sangiorgi E, Capecchi MR. Bmi1 is expressed in vivo in intestinal stem cells. Nat Genet 2008; 40:915-20; PMID:18536716; http://dx.doi.org/ 10.1038/ng.165 [DOI] [PMC free article] [PubMed] [Google Scholar]
- 12.Kim JH, Yoon SY, Kim CN, Joo JH, Moon SK, Choe IS, Choe YK, Kim JW. The Bmi-1 oncoprotein is overexpressed in human colorectal cancer and correlates with the reduced p16INK4a/p14ARF proteins. Cancer Lett 2004; 203:217-24; PMID:14732230; http://dx.doi.org/ 10.1016/j.canlet.2003.07.009 [DOI] [PubMed] [Google Scholar]
- 13.Li DW, Tang HM, Fan JW, Yan DW, Zhou CZ, Li SX, Wang XL, Peng ZH. Expression level of Bmi-1 oncoprotein is associated with progression and prognosis in colon cancer. J Cancer Res Clin Oncol 2010; 136:997-1006; PMID:20024662; http://dx.doi.org/ 10.1007/s00432-009-0745-7 [DOI] [PubMed] [Google Scholar]
- 14.Du J, Li Y, Li J, Zheng J. Polycomb group protein Bmi1 expression in colon cancers predicts the survival. Med Oncol 2010; 27:1273-6; PMID:19957112; http://dx.doi.org/ 10.1007/s12032-009-9373-y [DOI] [PubMed] [Google Scholar]
- 15.Kreso A, van Galen P, Pedley NM, Lima-Fernandes E, Frelin C, Davis T, Cao L, Baiazitov R, Du W, Sydorenko N, et al.. Self-renewal as a therapeutic target in human colorectal cancer. Nat Med 2014; 20:29-36; PMID:24292392; http://dx.doi.org/ 10.1038/nm.3418 [DOI] [PubMed] [Google Scholar]
- 16.Shi Z, Bai R, Fu ZX, Zhu YL, Wang RF, Zheng S. Induced pluripotent stem cell-related genes influence biological behavior and 5-fluorouracil sensitivity of colorectal cancer cells. J Zhejiang University Sci B 2012; 13:11-9; PMID:22205615; http://dx.doi.org/ 10.1631/jzus.B1100154 [DOI] [PMC free article] [PubMed] [Google Scholar]
- 17.Meng HM, Zheng P, Wang XY, Liu C, Sui HM, Wu SJ, Zhou J, Ding YQ, Li J. Over-expression of Nanog predicts tumor progression and poor prognosis in colorectal cancer. Cancer Biol Ther 2010; 9:295-302; PMID:20026903; http://dx.doi.org/ 10.4161/cbt.9.4.10666 [DOI] [PubMed] [Google Scholar]
- 18.Monteiro J, Fodde R. Cancer stemness and metastasis: therapeutic consequences and perspectives. Eur J Cancer 2010; 46:1198-203; PMID:20303259; http://dx.doi.org/ 10.1016/j.ejca.2010.02.030 [DOI] [PubMed] [Google Scholar]
- 19.Kemper K, Versloot M, Cameron K, Colak S, de Sousa e Melo F, de Jong JH, Bleackley J, Vermeulen L, Versteeg R, Koster J, et al.. Mutations in the Ras-Raf Axis underlie the prognostic value of CD133 in colorectal cancer. Clin Cancer Res: Off J Am Assoc Cancer Res 2012; 18:3132-41; PMID:22496204; http://dx.doi.org/ 10.1158/1078-0432.CCR-11-3066 [DOI] [PubMed] [Google Scholar]
- 20.Moon BS, Jeong WJ, Park J, Kim TI, Min do S, Choi KY. Role of oncogenic K-Ras in cancer stem cell activation by aberrant Wnt/beta-catenin signaling. J Natl Cancer Inst 2014; 106:djt373; PMID:24491301 [DOI] [PubMed] [Google Scholar]
- 21.Li LH, Zheng MH, Luo Q, Ye Q, Feng B, Lu AG, Wang ML, Chen XH, Su LP, Liu BY. P21-activated protein kinase 1 induces colorectal cancer metastasis involving ERK activation and phosphorylation of FAK at Ser-910. Int J Oncol 2010; 37:951-62; PMID:20811717 [PubMed] [Google Scholar]
- 22.Huynh N, Liu KH, Baldwin GS, He H. P21-activated kinase 1 stimulates colon cancer cell growth and migration/invasion via ERK- and AKT-dependent pathways. Biochimica et Biophysica Acta 2010; 1803:1106-13; PMID:20595063; http://dx.doi.org/ 10.1016/j.bbamcr.2010.05.007 [DOI] [PubMed] [Google Scholar]
- 23.He H, Huynh N, Liu KH, Malcontenti-Wilson C, Zhu J, Christophi C, Shulkes A, Baldwin GS. P-21 activated kinase 1 knockdown inhibits beta-catenin signalling and blocks colorectal cancer growth. Cancer Lett 2012; 317:65-71; PMID:22100495; http://dx.doi.org/ 10.1016/j.canlet.2011.11.014 [DOI] [PubMed] [Google Scholar]
- 24.Licciulli S, Maksimoska J, Zhou C, Troutman S, Kota S, Liu Q, Duron S, Campbell D, Chernoff J, Field J, et al.. FRAX597, a small molecule inhibitor of the p21-activated kinases, inhibits tumorigenesis of neurofibromatosis type 2 (NF2)-associated Schwannomas. J Biol Chem 2013; 288:29105-14; PMID:23960073; http://dx.doi.org/ 10.1074/jbc.M113.510933 [DOI] [PMC free article] [PubMed] [Google Scholar]
- 25.Murray BW, Guo C, Piraino J, Westwick JK, Zhang C, Lamerdin J, Dagostino E, Knighton D, Loi CM, Zager M, et al.. Small-molecule p21-activated kinase inhibitor PF-3758309 is a potent inhibitor of oncogenic signaling and tumor growth. Proc Natl Acad Sci U S A 2010; 107:9446-51; PMID:20439741; http://dx.doi.org/ 10.1073/pnas.0911863107 [DOI] [PMC free article] [PubMed] [Google Scholar]
- 26.Dall P, Heider KH, Hekele A, von Minckwitz G, Kaufmann M, Ponta H, Herrlich P. Surface protein expression and messenger RNA-splicing analysis of CD44 in uterine cervical cancer and normal cervical epithelium. Cancer Res 1994; 54:3337-41; PMID:7516819 [PubMed] [Google Scholar]
- 27.Tanabe KK, Ellis LM, Saya H. Expression of CD44R1 adhesion molecule in colon carcinomas and metastases. Lancet 1993; 341:725-6; PMID:8095628; http://dx.doi.org/ 10.1016/0140-6736(93)90490-8 [DOI] [PubMed] [Google Scholar]
- 28.Tanabe KK, Stamenkovic I, Cutler M, Takahashi K. Restoration of CD44H expression in colon carcinomas reduces tumorigenicity. Ann Surg 1995; 222:493-501; discussion -3; PMID:7574929; http://dx.doi.org/ 10.1097/00000658-199510000-00007 [DOI] [PMC free article] [PubMed] [Google Scholar]
- 29.Alhopuro P, Alazzouzi H, Sammalkorpi H, Davalos V, Salovaara R, Hemminki A, Järvinen H, Mecklin JP, Schwartz S Jr, Aaltonen LA, et al.. SMAD4 levels and response to 5-fluorouracil in colorectal cancer. Clin Cancer Res: Off J Am Assoc Cancer Res 2005; 11:6311-6; PMID:16144935; http://dx.doi.org/ 10.1158/1078-0432.CCR-05-0244 [DOI] [PubMed] [Google Scholar]
- 30.Douillard JY, Cunningham D, Roth AD, Navarro M, James RD, Karasek P, Jandik P, Iveson T, Carmichael J, Alakl M, et al.. Author information et al. Irinotecan combined with fluorouracil compared with fluorouracil alone as first-line treatment for metastatic colorectal cancer: a multicentre randomised trial. Lancet 2000; 355:1041-7; PMID:10744089; http://dx.doi.org/ 10.1016/S0140-6736(00)02034-1 [DOI] [PubMed] [Google Scholar]
- 31.Giacchetti S, Perpoint B, Zidani R, Le Bail N, Faggiuolo R, Focan C, Chollet P, Llory JF, Letourneau Y, Coudert B, et al.. Phase III multicenter randomized trial of oxaliplatin added to chronomodulated fluorouracil-leucovorin as first-line treatment of metastatic colorectal cancer. J Clin Oncol: Off J Am Soc Clin Oncol 2000; 18:136-47; PMID:10623704 [DOI] [PubMed] [Google Scholar]
- 32.Liu KH, Huynh N, Patel O, Shulkes A, Baldwin G, He H. P21-activated kinase 1 promotes colorectal cancer survival by up-regulation of hypoxia-inducible factor-1alpha. Cancer Lett 2013; 340:22-9; PMID:23811286; http://dx.doi.org/ 10.1016/j.canlet.2013.06.024 [DOI] [PubMed] [Google Scholar]
- 33.He H, Shulkes A, Baldwin GS. PAK1 interacts with beta-catenin and is required for the regulation of the beta-catenin signalling pathway by gastrins. Biochimica et Biophysica Acta 2008; 1783:1943-54; PMID:18515095; http://dx.doi.org/ 10.1016/j.bbamcr.2008.04.016 [DOI] [PubMed] [Google Scholar]
- 34.Oshima N, Yamada Y, Nagayama S, Kawada K, Hasegawa S, Okabe H, Sakai Y, Aoi T. Induction of cancer stem cell properties in colon cancer cells by defined factors. PloS One 2014; 9:e101735; PMID:25006808; http://dx.doi.org/ 10.1371/journal.pone.0101735 [DOI] [PMC free article] [PubMed] [Google Scholar]
Associated Data
This section collects any data citations, data availability statements, or supplementary materials included in this article.


