Abstract
Exploring and exploiting a rich visual environment requires perceiving, attending, and remembering multiple objects simultaneously. Recent studies have suggested that this mental “juggling” of multiple objects may depend on oscillatory neural dynamics. We recorded local field potentials from the lateral intraparietal area, frontal eye fields, and lateral prefrontal cortex while monkeys maintained variable numbers of visual stimuli in working memory. Behavior suggested independent processing of stimuli in each hemifield. During stimulus presentation, higher-frequency power (50–100 Hz) increased with the number of stimuli (load) in the contralateral hemifield, whereas lower-frequency power (8–50 Hz) decreased with the total number of stimuli in both hemifields. During the memory delay, lower-frequency power increased with contralateral load. Load effects on higher frequencies during stimulus encoding and lower frequencies during the memory delay were stronger when neural activity also signaled the location of the stimuli. Like power, higher-frequency synchrony increased with load, but beta synchrony (16–30 Hz) showed the opposite effect, increasing when power decreased (stimulus presentation) and decreasing when power increased (memory delay). Our results suggest roles for lower-frequency oscillations in top-down processing and higher-frequency oscillations in bottom-up processing.
Keywords: frontal eye fields, lateral intraparietal area, power, prefrontal cortex, synchrony, working memory
Introduction
While a wealth of studies have investigated how humans and animals remember single objects, less is known about how we remember multiple objects simultaneously. It is well known that human capacity for multiple items is severely limited: The average adult human can only hold 3–4 objects in mind (working memory) simultaneously (Luck and Vogel 1997; Vogel et al. 2001). fMRI signals from a variety of brain areas are modulated by the number of remembered stimuli (stimulus load) (Linden et al. 2003; Todd and Marois 2004). Similarly, EEG event-related potentials scale with stimulus load, saturate when behavioral capacity is exceeded, and reflect individual differences in working memory capacity (Vogel and Machizawa 2004; Vogel et al. 2005; McCollough et al. 2007; Ikkai et al. 2010; Luria and Vogel 2011). However, multiple-item working memory processes are much less studied in animals, where we can assess neural activity with greater temporal and spatial precision.
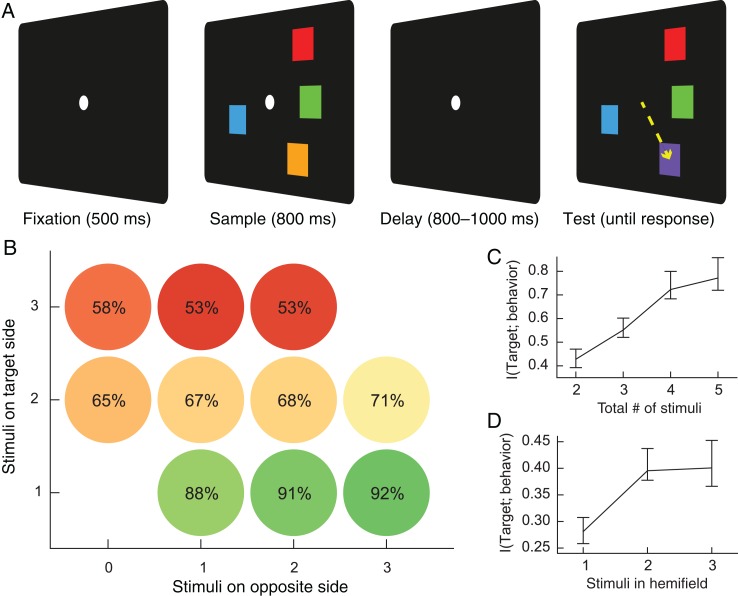
We previously reported correlates of multiple-item working memory in individual neurons in frontal and parietal cortex (Buschman et al. 2011). Monkeys performed a human test of capacity (Fig. 1). Two arrays of 2–5 colored squares were separated by a memory delay. The color of a random square was changed. Monkeys were trained to saccade to this change. Multiple electrodes were implanted in lateral prefrontal cortex (lPFC), frontal eye fields (FEF), and lateral intraparietal area (LIP). These regions are critical for short-term memory (Passingham 1975; Kowalska et al. 1991; Sawaguchi and Goldman-Rakic 1991; Li et al. 1999), and human studies implicate them in capacity limitations (Linden et al. 2003; Todd and Marois 2004, 2005; Vogel and Machizawa 2004; Palva et al. 2010; Voytek and Knight 2010). On the neuron level, we found capacity limitations were bottom-up (appearing in parietal before frontal cortex), neural information about the target stimulus decreased with stimulus load even when these stimuli was correctly remembered, and neural information was present but reduced in trials in which the animal failed to select the correct target (Buschman et al. 2011).
Figure 1.
(A) Change localization task. After fixating for 500 ms, animals saw an array of colored squares for 800 ms. These squares then disappeared, and subjects were required to maintain the colors of these squares in memory for a variable delay of 800–1000 ms. The array then reappeared with a change to the color of one square. The animal was rewarded for saccading to the changed square. (B) Average behavioral performance according to the number of squares on the same side as the changed stimulus (“target side”) and the number of squares on the opposite side. Performance depended on the number of squares on the target side, not the total number of squares. (C) Mutual information between the location of the target stimulus and the animal's choice given the display for total loads 2 through 5. (D) Mutual information between the location of the target stimulus and the animal's choice given the display for loads 1, 2, and 3 in the target hemifield. Error bars reflect 95% confidence intervals based on nonparametric bootstrapping across sessions.
Here, we use these data to examine effects of stimulus load on oscillations of local field potentials (LFPs). There is increasing evidence that oscillations play a role in cognition. Different oscillatory frequencies may mediate feedforward versus feedback processing (Engel et al. 2001; Buschman and Miller 2007; Engel and Fries 2010; Arnal and Giraud 2012; Bastos et al. 2015) and dynamically link neurons into ensembles (Gray et al. 1989; Buschman et al. 2012; Salazar et al. 2012). Capacity limits have been hypothesized to arise from coding of different stimuli at different oscillatory phases (Lisman and Idiart 1995; Siegel et al. 2008; Lundqvist et al. 2011). The few human EEG studies investigating oscillatory activity showed that power and synchrony increase with stimulus load across a range of frequencies (Jensen and Tesche 2002; Howard et al. 2003; Meltzer et al. 2008; Palva et al. 2010, 2011). But, the link between oscillations and multiple-item working memory is not well-studied and thus far from understood.
Materials and Methods
Behavioral Task
One adult male rhesus macaque (Macaca mulatta) and 1 adult male cynomolgus macaque (Macaca fascicularis) were trained to perform a change localization task. All procedures followed the guidelines of the Massachusetts Institute of Technology Committee on Animal Care and the National Institutes of Health. Animals fixated for 500 ms to initiate a trial. After this fixation period, an array of 2–5 colored squares (1–3 per hemifield) appeared for 800 ms. The stimuli then disappeared. After an 800- to 1000-ms memory delay period, the array reappeared with a change to the color of a random square. The animal received a juice reward for making a direct saccade to the changed square. From the start of the trial until the presentation of the second array of colored squares, the animal was required to fixate within 1.75 degrees of a central fixation point.
The location of the target was randomized for each trial. However, in order to permit inspection of neural encoding of visual information during the delay period, square locations were chosen from 6 positions (3 per hemifield) in any single session, and only 2 colors could be present at any single position. Additionally, given our behavioral evidence for the independence of working memory representations in each hemifield, in each trial, we manipulated the number of stimuli in each hemifield rather than the total number of stimuli in the display, while constraining the total number of stimuli to between 2 and 5. In order to maintain behavioral performance and to acquire a sufficient number of trials with low total load, trials with fewer stimuli in a given hemifield were presented at higher probability than trials with greater numbers of stimuli. This trial selection procedure was uninformative about the location of the target and did not provide any additional information that could assist in the performance of any given trial.
New stimulus locations and colors were randomly selected before each recording session. Stimulus locations were selected to be within 75 degrees of visual angle from the horizontal meridian and between 4 and 6 degrees of visual angle from the central fixation point, and colors were manually inspected to ensure sufficient discriminability. All 12 possible colors in a given session were unique. An infrared video eye-tracking system recorded eye positions at 240 Hz. A computer running the MonkeyLogic software (Asaad and Eskandar 2008) controlled the stimulus display and behavioral reward.
Electrophysiological Recording
Epoxy-coated dura-piercing tungsten electrodes (FHC) were lowered into each region using a custom-built grid and microdrive assembly that lowered electrodes in pairs using a single screw. Recordings were performed using a Plexon Multichannel Acquisition Processor. All signals were referenced to ground. Local field potentials were filtered with hardware filters between 3.3 and 88 Hz prior to amplification and sampled at 1000 Hz. Two-pole notch filters at 60 Hz (line noise frequency), 85 Hz (monitor refresh rate), and 120 Hz (line noise harmonic) were applied prior to data analysis.
We restricted our analyses to electrodes from which we recorded at least one single unit. Only parietal electrodes whose units showed a spatially selective response in a delayed saccade task (P < 0.05, permutation test of ω2) were included in further analyses. Electrodes in FEF and lPFC were differentiated using microstimulation. Out of 1125 recorded electrodes, 546 electrodes fit our criteria (13–28 per session, mean 19.5, interquartile range 18–21.25). Of these channels, 142 were in LIP (1–9 per session, mean 5.1, interquartile range 3.75–7.25), 155 were in FEF (1–12 per session, mean 5.5, interquartile range 4.75–6), and 249 were in lPFC (5–15 per session, mean 8.9, interquartile range 7–10.25).
Estimation of Behavioral Capacity
Our procedure for estimating behavioral capacity by mutual information is described in detail in Buschman et al. (2011). To determine mutual information for the entire display, for each load, we computed the conditional mutual information between the animal's choice and the target given the stimulus display. We dissociated the amount of mutual information in each hemifield using linear regression. Full details are provided in the Supplementary Methods.
Data Analysis
All analyses were performed using the Julia programing language (http://www.julialang.org/). Evoked potentials were removed prior to analysis. Spectrograms and coherograms in Figures 2, 3, 8 and Supplementary Figure S2 were computed by continuous wavelet transform with Morlet wavelets. Bar and line graphs in Figures 4–7, 9 and Supplementary Figures S1, S3, and S4 were computed using multitaper time-frequency transforms. Confidence intervals and significance tests were computed using parametric bootstrapping (see Supplementary Methods).
Figure 2.
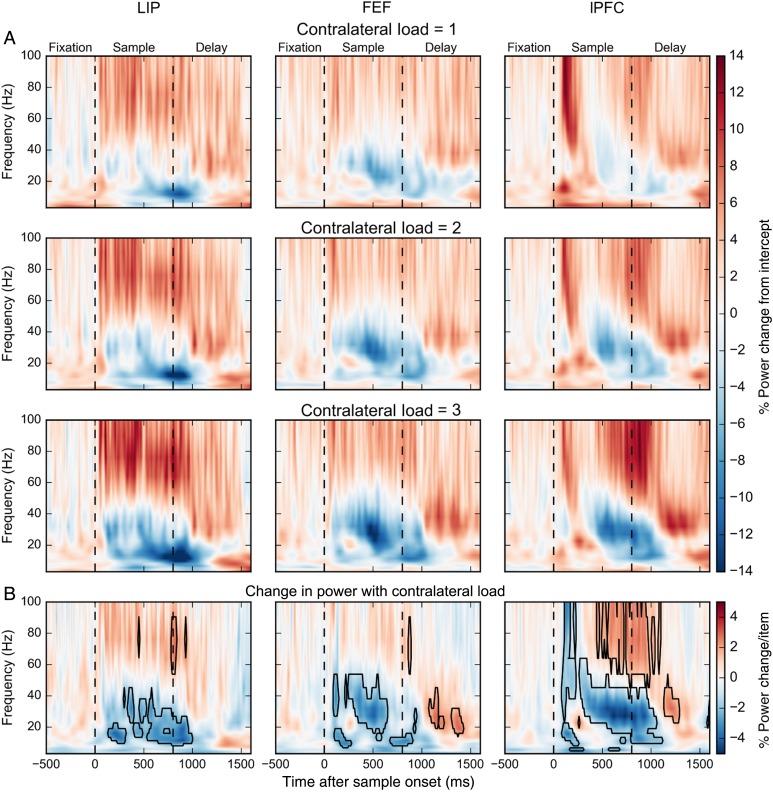
(A) Percent power change for contralateral loads 1, 2, and 3 relative to the model intercept across frequencies and time. First dashed line indicates time of sample onset. Second dashed line indicates time of sample offset. (B) Percent power change per contralateral stimulus. Boxes indicate significant modulations (bootstrap Z-test, P < 0.05, Holm corrected for 22 frequencies × 211 time points).
Figure 3.
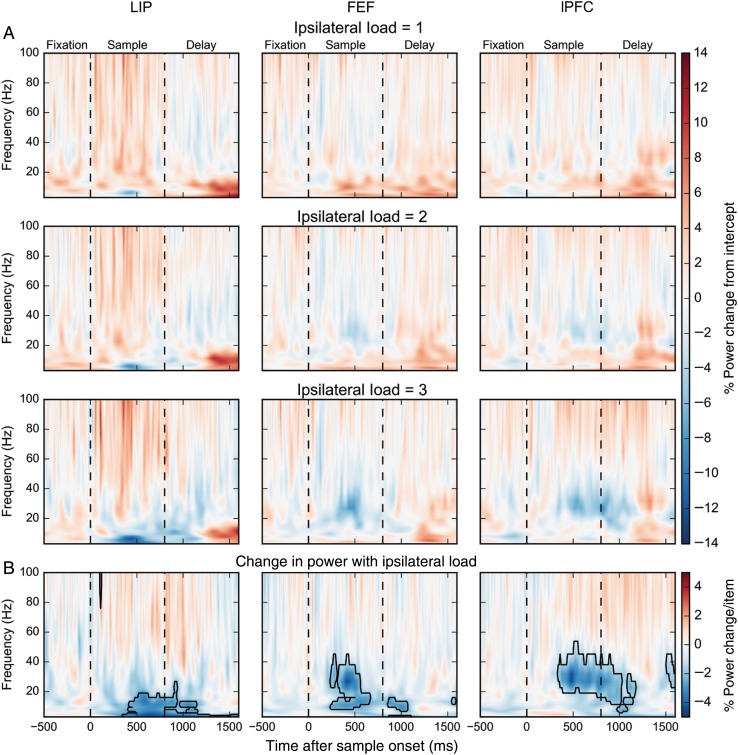
(A) Percent power change for ipsilateral loads 1, 2, and 3 relative to the model intercept across frequencies and time. (B) Percent power change per ipsilateral stimulus. Boxes indicate significant modulations (bootstrap Z-test, P < 0.05, Holm corrected for 22 frequencies × 211 time points).
Figure 8.
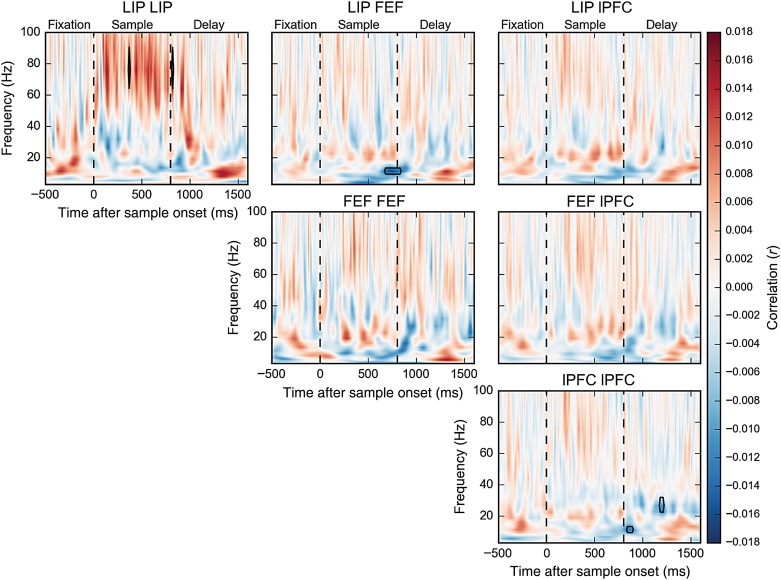
Correlation of single-trial coherence surrogates with contralateral load. Boxes indicate significant modulations (bootstrap Z-test, P < 0.05, Holm corrected for 22 frequencies × 211 time points). The same analysis for ipsilateral load is shown in Supplementary Figure S2.
Figure 4.
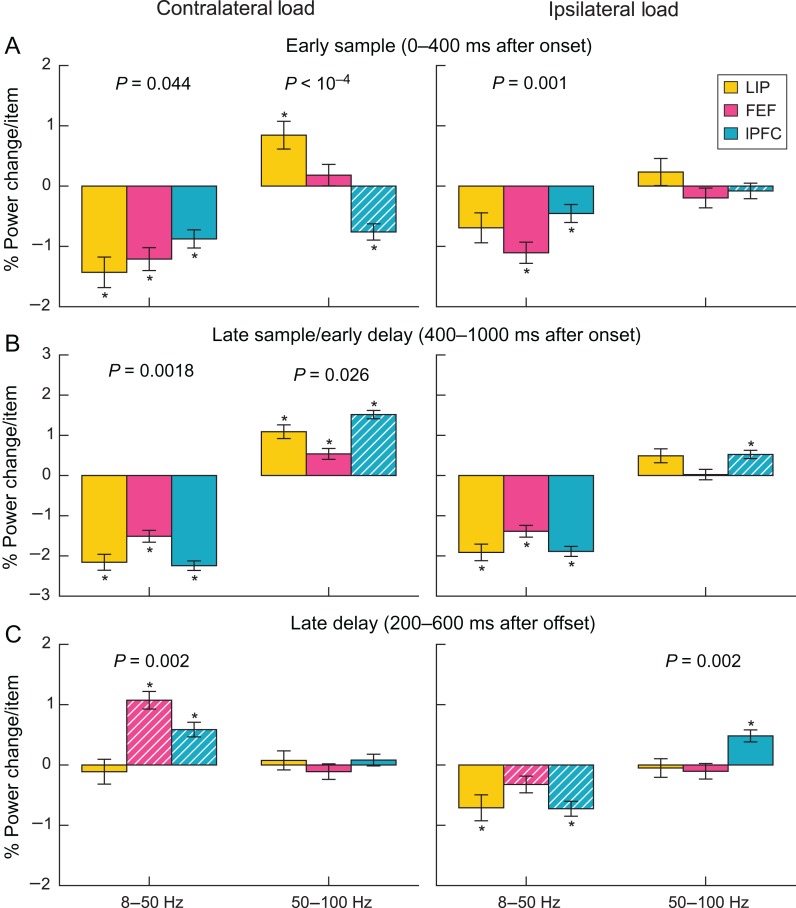
Percent power change per contralateral (left) and ipsilateral (right) item by region, grouped by lower frequencies (left bar group) and higher frequencies (right bar group) during the early sample (A), late sample/early delay (B), and late delay (C). Error bars are standard error of the mean. Asterisks indicate significant differences (bootstrap Z-test, P < 0.05, Holm corrected for 2 bands × 3 epochs × 3 regions). White hatching indicates significant differences in modulation by ipsilateral and contralateral load (bootstrap Z-test, P < 0.05, Holm corrected). P-values above bars indicate significant differences between regions (F-test, P < 0.05).
Figure 7.
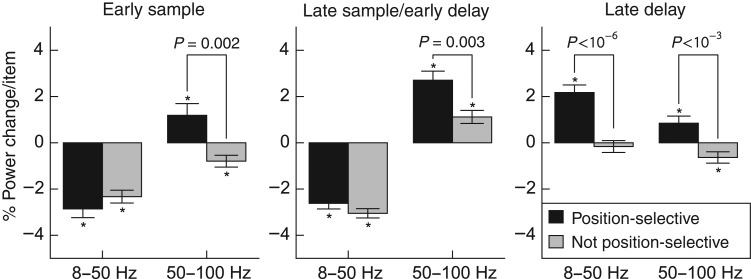
Percent power change per contralateral item for position-selective and nonposition-selective electrodes. Asterisks indicate significant modulation by load (one-sample t-test, P < 0.05, Holm corrected for 2 bands × 3 epochs). P-values above bars indicate significant differences between position-selective and nonposition-selective electrodes (unequal variance t-test, P < 0.05, Holm corrected).
Figure 9.
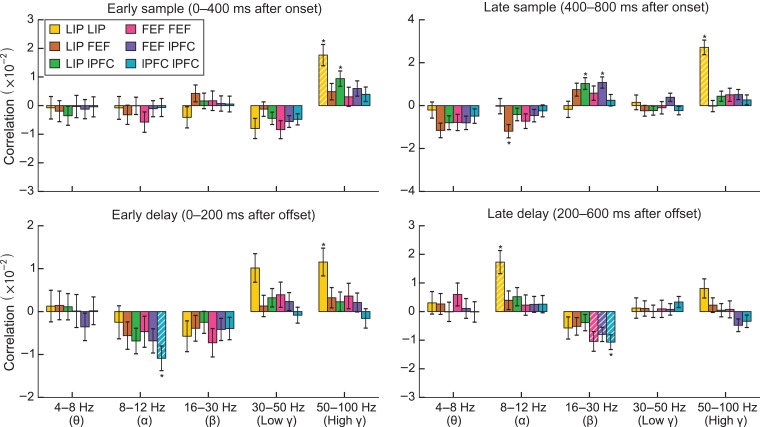
Correlation of single-trial coherence surrogates with contralateral load for frequency bands and epochs. Asterisks indicate significant differences (bootstrap Z-test, P < 0.05, Holm corrected for 5 bands × 4 epochs × 6 region pairs). White hatching indicates significant differences in modulation by ipsilateral and contralateral load (bootstrap Z-test, P < 0.05, Holm corrected). The same analysis for ipsilateral load is shown in Supplementary Figure S3.
We fit spectral power using a generalized linear model with a Gamma likelihood function and a logarithmic link function, which yielded a better fit to the data than an ordinary least squares fit. To assess information present in power, we computed adjusted R2 for the gamma model fit, as described in Mittlböck and Heinzl (2002). Further details are provided in the Supplementary Methods.
To determine the relationship between synchrony and load (Figs 8, 9, Supplementary Figs S2 and S3), for each electrodes pair, time point, and frequency, we first computed surrogate coherence values with each individual trial removed, yielding an estimate of the contribution of that trial to coherence (Womelsdorf et al. 2006; Hipp et al. 2011; Richter et al. 2015). We then computed the correlation between these surrogates and load (see Supplementary Methods). To compute synchrony statistics for individual load conditions (Supplementary Fig. S4), we used the pairwise phase consistency, an estimator of the squared mean resultant length that is not biased by the number of trials (Vinck et al. 2010).
Results
Monkeys Maintain Multiple Items in Working Memory
Our change localization task and behavioral results are described in detail in Buschman et al. (2011). Animals saw a sample array of 2 to 5 colored squares for 800 ms (Fig. 1A). After an 800- to 1000-ms delay period, the array reappeared with a change to the color of one of the squares. Animals had to saccade to the changed square to receive a juice reward. The “target” was defined as the stimulus that changed between the 2 array presentations. The monkey was not cued to (and could not predict) which stimulus would be the target.
As Buschman et al. (2011) reported and others have confirmed (Matsushima and Tanaka 2014), the right and left visual hemifields seemed to process stimuli separately. There were independent capacities on the right and left for the number of stimuli that could be processed/remembered: A stimulus in the same hemifield as the target degraded both the ability of the animal to detect its change and the neural information present about that stimulus. In contrast, a stimulus in the opposite hemifield had little or no effect. Indeed, task performance showed a strong dependence on the number of stimuli in the same hemifield as the target (P < 10−10, ANOVA; Fig. 1B) but no significant dependence on the number of stimuli in the opposite hemifield from the target (P = 0.23, ANOVA). To determine the animal's behavioral capacity, we measured mutual information between the animals' choices and the target position (Fig. 1C). Mutual information between the target and response plateaued at 4 items in the display, consistent with reports of working memory capacity of 3 to 4 items in humans (Luck and Vogel 1997; Vogel et al. 2001). Because the behavioral analysis above suggested that the hemifields had independent working memory capacities, we used linear regression to separate information in each hemifield (see Materials and Methods). Information increased when a second stimulus was added to the target hemifield (P < 10−15, bootstrap Z-test; Fig. 1D) but showed no change when a third stimulus was added (P = 0.94). Thus, behavioral capacity appears to saturate between 1 and 2 stimuli per hemifield.
Oscillatory Power Correlates with Contralateral and Ipsilateral Stimulus Load
We tested the effects of contralateral stimulus load on LFP power using a generalized linear model. After removing evoked potentials, we regressed the instantaneous power at each frequency band and each time point in the trial (see Materials and Methods). We estimated the multiplicative contribution over the model intercept, which corresponds to the power in the absence of any stimuli. Figure 2A shows the percent power change for each contralateral stimulus load condition. Figure 2B plots the percent change in LFP power for each added contralateral stimulus, as estimated based on observed power at loads 1 to 3. The black polygons indicate time-frequency “zones” of significant changes in power with increasing load (see Materials and Methods). Figure 3 shows the same analysis for ipsilateral stimulus loads. We first consider the effects of contralateral loads. We saw the effects of contralateral load in 2 broad bands, 8–50 Hz (“lower frequencies,” including theta, alpha, beta, and lower gamma) and 50–100 Hz (“higher frequencies” or high gamma). We will summarize the main effects. Then, we will go into details such as temporal dynamics of the effects.
During sample array presentation, higher-frequency LFP power increased with increased contralateral stimulus load (positive correlations, warm colors) whereas lower-frequency LFP power decreased with increased contralateral stimulus load (negative correlations, cool colors). During the memory delay (especially late in the delay), there was no effect of contralateral load on higher frequencies and the effects at lower frequencies inverted (Fig. 2).
Figure 3 shows the effect of ipsilateral stimulus load on LFP power. Like contralateral load, ipsilateral load inversely correlated with lower-frequency LFP power during stimulus presentation. But in contrast to contralateral load, effects of ipsilateral load at higher frequencies were weaker. Additionally, the positive correlation between memory delay lower-frequency lPFC power and contralateral load was not observed for ipsilateral loads. Thus, the independence between the 2 visual hemifields seen in behavior was reflected in positive, but not the negative, correlations between load and power. As Figures 2 and 3 illustrate, the changes in LFP with stimulus load was more complex than this summary; there were differences in the temporal dynamics in effects between brain areas. Next, we quantify these effects and consider them in more detail.
Differences in Effects of Stimulus Load by Time and Frequency Band
As Figures 2 and 3 indicate, the main effects of stimulus load were seen across 2 broad frequency bands (lower: 8–50 Hz and higher: 50–100 Hz). When we separated the lower frequencies into standard-frequency bands (theta, 4–8 Hz; alpha, 8–12 Hz; beta, 16–30 Hz; low gamma, 30–50 Hz), the pattern of effects in the narrow bands mirrored the broadband effects (i.e., negative correlations in theta through low gamma, positive correlations in high gamma, see Supplementary Fig. S1). Thus, for simplicity, we report statistics computed across the broad bands using the multitaper method (see Materials and Methods).
Figures 2 and 3 suggest that different load effects were grouped themselves into 3 distinct time periods, especially in the lPFC. There was an early sample epoch (0–400 ms after sample onset), a late sample/early delay epoch (400–1000 ms after sample onset), and a late delay epoch (1000–1800 ms after sample onset). We therefore computed the power across each of these epochs separately. Figure 4 plots the average percent change in LFP power per added stimulus for the 2 broad frequency bands and in each of the 3 epochs for each brain area. The asterisks indicate a significant change in power with increasing load. The hatched bars indicate when a given measure in a given brain area showed a significant difference between the effects of contralateral versus ipsilateral load. Next, we consider the effects in each epoch.
Early Sample Epoch
All 3 brain areas showed a decrease in low-frequency power with increased contralateral stimulus load (LIP: −1.4%/item, P < 10−6; FEF: −1.2%/item, P < 10−8; lPFC: −0.9%/item, P < 10−6) (Figure 4A). The effects of contralateral load on higher-frequency power were mixed. LIP showed a significant positive correlation (0.8%/item, P = 0.004), and lPFC showed a significant negative correlation with contralateral load (−0.8%/item, P < 10−6). For ipsilateral loads, there were numerically negative correlations with lower frequencies, but only the FEF and lPFC showed a significant negative correlation with lower-frequency power (FEF: −1.1%/item, P < 10−6; lPFC: −0.5%/item, P = 0.03). The differences in correlations for contralateral versus ipsilateral stimulus loads did not reach significance for the lower frequencies (no bars corresponding to lower frequencies in Fig. 4A are hatched, indicating no difference between contralateral and ipsilateral loads for each area). In contrast to contralateral loads, none of the areas showed a significant correlation between higher frequencies and ipsilateral load. This difference between the effects of contralateral and ipsilateral load on higher frequencies was significant for the lPFC (P = 0.007; hatched bars, Fig. 4A). In this way, the higher-frequency power was similar to our previously reported single-neuron results (Buschman et al. 2011).
Late Sample/Early Delay Epoch
Contralateral stimulus load had different effects on lower versus higher frequencies in all 3 areas (Figure 4B). All 3 areas showed a significant negative correlation with contralateral load at lower frequencies (LIP: −2.2%/item, P < 10−25; FEF: −1.5%/item, P < 10−22; lPFC: −2.2%/item, P < 10−79; see Fig. 4B) and a significant positive correlation at higher frequencies (LIP: 1.1%/item, P < 10−8; FEF: 0.5%/item, P = 0.001; lPFC: 1.5%/item, P < 10−45). As in the early sample epoch, lower-frequency power decreased with ipsilateral load in all 3 areas (LIP: −1.9%/item, P < 10−18; FEF: −1.4%/item, P < 10−19; lPFC: −1.9%/item, P < 10−50), with weak or no effect on higher frequencies. Only the lPFC showed a small, but significant positive correlation between higher-frequency power and ipsilateral load (0.5%/item, P < 10−5), and it was significantly weaker than the correlation between lPFC higher-frequency power and contralateral load (hatched bar in Fig. 4B; P < 10−9).
Late Delay Epoch
Later in the memory delay, the effects of contralateral load on lower-frequency power in the FEF and lPFC reversed relative to earlier in the trial (Figure 4C). They showed a significant positive (as opposed to negative) correlation between lower-frequency power and contralateral load (FEF: 1.1%/item, P < 10−11; lPFC: 0.6%/item, P < 10−4). In contrast, there was no effect of contralateral load on higher-frequency power. Increased ipsilateral stimulus load continued to produce negative correlations with lower-frequency power in LIP (−0.7%/item, P = 0.02) and lPFC (−0.7%/item, P < 10−7). This difference between the effects of contralateral and ipsilateral load at lower frequencies was significant for the FEF and lPFC (hatched bars, Fig. 4C; FEF: P < 10−9; lPFC: P < 10−11). Ipsilateral load effects on higher-frequency power remained weak; only the lPFC showed a positive correlation (0.5%/item, P < 0.0001).
Do Load Effects Saturate at Behavioral Capacity?
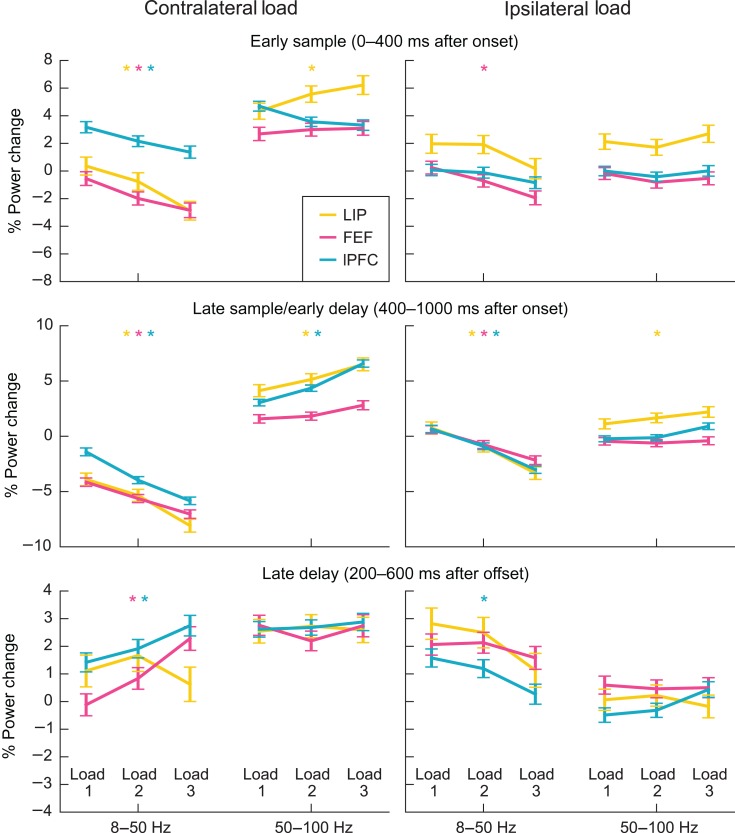
Above, we cataloged whether increased stimulus load increased or decreased LFP power. These effects could reflect a strictly monotonic relationship (every added stimulus changes LFP power to a certain degree). Alternatively, there could be a step-like, or threshold, relationship. For example, power could have been constant below a specific load and then increased above it. To test this, we computed the average change from baseline (i.e., no stimulation) for each contralateral and ipsilateral load from 1 to 3 stimuli. This is plotted in Figure 5 for each area and for contralateral and ipsilateral loads. As can be seen, the relationship between stimulus load and power seems mostly monotonic. Each added stimulus produces a similar degree of change in oscillatory power. Note that, even though the animals' performance dropped off beyond 2 stimuli, adding a third stimulus to the load resulted in further changes in power. The asterisks in Figure 5 indicate which brain areas showed a strictly monotonic relationship between power and load, that is, the smallest observed difference in power of any pair of load conditions was larger than would be expected by chance (see Supplementary Methods). In most bands, epochs, and regions where we observed significant modulation of power by load, the effect was strictly monotonic. This was true for all observed low-frequency power decreases with contralateral or ipsilateral load in the early sample and late sample/early delay periods, as well as high-frequency power increases with contralateral load in LIP during the early sample and in LIP and lPFC during the late sample and early delay. Crucially, in FEF and lPFC, strictly monotonic and seemingly linear effects were present even in the late delay period.
Figure 5.
Percent power change for contralateral loads (left) and ipsilateral loads (right) 1, 2, and 3 relative to load 0, for epochs and frequency bands. Asterisks indicate significance of all pairwise differences for the band, region, and epoch (permutation test, P < 0.05, Holm corrected for 2 bands × 3 epochs × 3 regions).
Relationship between LFP Position and Load Information
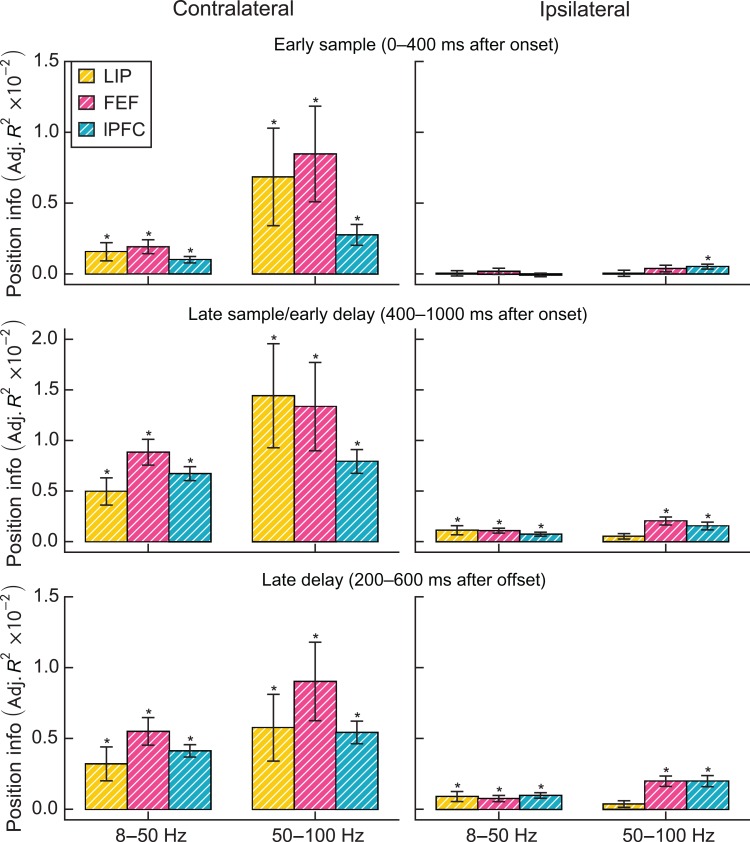
In addition to information about stimulus load, LFPs also carried information about stimulus positions. Similar to above, we fit generalized linear models to each electrode, band, and epoch incorporating either load alone or both load and stimulus positions in either the contralateral or ipsilateral hemifields. Based on the difference in these 2 models, we computed adjusted R2, a debiased measure of the additional information captured by the model that included stimulus positions similar to ω2 in linear ANOVA (see Supplementary Methods).
In all bands, epochs, and regions, significant information about stimulus position was present in LFP power (all P < 0.0003, nonparametric bootstrap test, Holm corrected; Fig. 6). Additionally, a small amount of information about ipsilaterally presented stimuli was present in low-frequency power in the late sample/early delay period and late delay periods in all regions and at high-frequency power in FEF and lPFC. However, the amount of information about contralaterally presented stimuli was substantially greater in all bands, frequencies, and epochs (all P < 0.005, paired nonparametric bootstrap test, Holm corrected).
Figure 6.
Comparison of position information (adjusted R2) for contralateral and ipsilateral stimuli. Error bars are standard error of the mean. Asterisks indicate significant information (nonparametric bootstrap test, P < 0.05, Holm corrected for 2 bands × 3 epochs × 3 regions). White hatching indicates significant differences in modulation by ipsilateral and contralateral load (nonparametric paired bootstrap test, P < 0.05, Holm corrected).
The modulation of power by load reported above could reflect either position-specific or position-invariant effects. If power in a given electrode increased or decreased when a stimulus was presented a specific location, then power might also increase or decrease with load, since any given stimulus is more likely to be present at higher loads than at lower loads. Alternatively, the load effects may reflect global changes in power, that is, even electrodes that do not carry position information might nonetheless show modulation by load. To distinguish these possibilities, for each frequency band and epoch, we separately computed the average percent power change per contralateral stimulus for electrodes with and without significant effects of contralateral stimulus position in that epoch and band (F-test, P < 0.05). To minimize confounds from nonposition selective electrodes with low statistical power, we excluded electrodes where neither load nor stimulus position explained any significant variation. Because previous analyses showed similar trends across recorded regions, we pooled electrodes across regions to increase statistical power. Applying the analysis to only frontal (FEF and lPFC) electrodes yielded an identical pattern of significance, as did a test for a significant main effect of position selectivity in a 2 × 3 ANOVA. There were no significant interactions between the effect of position selectivity and region (all P > 0.15, Holm corrected F-test). The results of this analysis are shown in Figure 7.
In the early sample and late sample/early delay period, lower-frequency power decreased with contralateral load in both position-selective and nonselective electrodes (all P < 10−9, t-test), but the strength of the modulation did not differ (early sample: P = 0.34 [0.26 uncorrected]; late sample: P = 0.34 [0.17 uncorrected]; unequal variance t-test with Holm correction). Differences were present at higher frequencies. In the early sample period, power in position-selective electrodes increased with contralateral load (1.2%/item, P = 0.04, one-sample t-test with Holm correction), whereas power in nonposition-selective electrodes decreased with load (−0.8%/item, P = 0.01; difference: P = 0.002, unequal variance t-test with Holm correction).
In the late sample/early delay period, higher-frequency power in both position-selective and nonposition-selective electrodes increased with load (position-selective: 2.7%/item, P < 10−10; nonposition-selective: 1.1%/item, P = 0.0004), but position-selective electrodes showed a stronger average modulation (P = 0.003). Thus, while the mean decrease in lower-frequency power with load in the sample period is independent of position selectivity, the mean increase in higher-frequency power with load appears to be driven largely by position-selective electrodes.
In the late delay period, lower-frequency power in position-selective electrodes increased with load (2.2%/item, P < 10−9). Nonposition-selective electrodes showed no average modulation (−0.16%/item, P = 0.5; difference: P < 10−6). Since these electrodes were selected on the basis of the presence of power or load effects, we conjecture that the individual channel effects average to zero over the recorded population. Thus, like the increase in higher-frequency power during the sample period, the mean increase in lower-frequency power with load in the late delay period appears to be due to position-selective electrodes. Higher-frequency power increased with load for position-selective electrodes (0.9%/item, P = 0.02) and decreased with load for nonposition-selective electrodes (−0.6%/item, P = 0.03; difference: P < 10−3). This relationship between load and stimulus position effects suggests that the effects of load mostly occur in neuron populations that process bottom-up information about the stimuli (see Discussion).
Effects of Stimulus Load on LFP Synchrony
The above-mentioned analyses focused on changes in oscillatory power with stimulus load. We next examine whether stimulus load affected the synchrony of LFP signals between electrodes within and across brain areas. We computed total coherence values across all trials and constructed single-trial surrogate coherence values for each trial as the difference between these total coherence values and coherence values based on all trials except the trial of interest. We then measured the correlation between LFP synchrony and load as the correlation between these single-trial coherence surrogates and contralateral or ipsilateral load in that trial (see Materials and Methods).
Figure 8 shows the correlation between LFP synchrony and contralateral stimulus load as a function of frequency and time during the trial (see Materials and Methods). There was little, if any, change in synchrony with ipsilateral load (Supplementary Figs. S2 and S3). Figure 9 shows the effects of load on synchrony for the standard frequency bands (theta, alpha, beta, and low and high gamma). Here, we summarize the significant effects using the same higher-/lower-frequency classifications we used for LFP power.
During sample presentation and shortly after, increases in contralateral load increased higher-frequency LFP synchrony within LIP (early sample: r = 0.017, P = 0.0002, bootstrap Z-test, Holm corrected; late sample: r = 0.023, P < 10−12; early delay: r = 0.012, P = 0.04; Figs. 8 and 9) and between LIP and lPFC (only in the early sample, r = 0.009, P = 0.049). In the late sample epoch, increased contralateral load significantly increased beta synchrony between LIP and lPFC (r = 0.010, P = 0.02) and between the FEF and lPFC (r = 0.011, P = 0.004) (while these cross-region effects did not achieve significance in the time-localized analysis in Fig. 8, they are apparent in the epoched analysis in Fig. 9). In the late delay, beta synchrony within the lPFC instead decreased with contralateral load (r = −0.011, P = 0.004). Additionally, there were significant decreases in alpha synchrony with contralateral load between LIP and FEF in the late sample (r = −0.012, P = 0.02) and within the lPFC in the early delay (r = −0.011, P = 0.02), and an increase in alpha synchrony with contralateral load within LIP in the late delay (r = 0.017, P = 0.002). As noted earlier, there were few changes in synchrony with ipsilateral load. There was only a decrease in alpha synchrony in the late sample period (r = −0.012, P = 0.009, see Supplementary Figs. S2 and S3).
Synchrony effects were generally fewer and smaller than the effects of load on LFP power. Nonetheless, we were able to detect that the effects of contralateral load on LFP synchrony in the sample period had a monotonically increasing relationship with contralateral load. Supplementary Figure S4 shows the difference in pairwise phase consistency between trials with contralateral loads 1, 2, and 3 and zero contralateral load trials for each region pair, band, and epoch. We determined significance using the same permutation test as in the test for monotonicity of power changes above. Synchrony within LIP increased monotonically with load in the higher frequencies in the early and late sample periods. Synchrony between LIP and lPFC increased monotonically with contralateral load in the beta band in the late sample period. We did not see significant monotonic effects in other bands after the multiple comparison correction.
Discussion
We tested the effects of different stimulus loads in 3 brain areas known to be important for visual attention and working memory, the lateral prefrontal cortex (lPFC), the FEF, and the LIP. Previously, we reported the single-neuron correlates of stimulus load (Buschman et al. 2011). Here, we report the effects of load on oscillatory dynamics (power and synchrony) of LFPs.
During stimulus presentation, there were decreases in lower-frequency (8–50 Hz) LFP power with increases in contralateral and ipsilateral stimulus load. However, higher-frequency (50–100 Hz) LFP power increased only with contralateral stimulus load. Contralateral load also (briefly) increased lower-frequency (16–50 Hz, encompassing beta and low gamma) power in the middle of the memory delay. This is relevant because our monkeys showed behavioral evidence of separate visual working memory capacities in each hemifield. This predicts that the neural effects of load tied most directly to behavior would be limited to the contralateral field. Synchrony measures are naturally noisier than measures of power but the effects of load on synchrony generally matched effects on power. The exceptions were in the beta band where there was an inverse relationship between stimulus load and synchrony. Beta synchrony (16–30 Hz) increased with stimulus load during the sample presentation (when beta power decreased) and decreased during the delay (when beta power increased). Finally, we found that even after the monkeys' behavioral capacity had been reached, increases in stimulus load continued to affect oscillatory power.
Our results coincide with previous reports of changes in LFP power in multiple-item working memory tasks. Lara and Wallis (2014) also found that in the lPFC, high gamma power increased and beta power decreased during stimulus presentation, whereas beta power increased during a memory delay. While they did not explicitly compare power in one-item and two-item trials, the effects appear to be stronger in the two-item trials, consistent with our findings that power in these bands and epochs scales with load. Palva et al. (2011) analyzed MEG and EEG power during a multiple-item working memory task in humans. They reported increases in delay period beta and low gamma power with load that did not saturate at behavioral capacity. However, the same authors report that power increases were associated with strengthened interareal synchrony (Palva et al. 2010), which we also observed during sample presentation, but not in the memory delay. Mitchell and Cusack (2011) showed bilateral decreases in induced alpha power immediately following sample presentation in human MEG data, consistent with our findings during the sample presentation.
Increases in high-frequency power accompanied by decreases in lower-frequency power have also been reported from a variety of visual attention and perception tasks. Monkey studies of V4 and FEF LFPs have shown that attention toward a stimulus increases higher-frequency power and decreases lower-frequency power (Fries et al. 2008; Gregoriou et al. 2009, 2014). Human EEG and MEG studies report similar results across a wide range of cortical regions (Siegel et al. 2008; Hipp et al. 2011). Our findings add important details. We found a dissociation between the effects of load on lower- versus higher-frequency power and their relationship to behavior. During sample presentation, lower-frequency power was modulated by both contralateral and ipsilateral load, whereas higher-frequency power was modulated more by contralateral load. This reflects the strong contralateral bias in visual cortical processing. It suggests that the effects of load on higher frequencies are more strongly associated with bottom-up processing of visual stimulus information per se. Indeed, we found stronger higher-frequency power changes in electrodes that showed selectivity for stimulus location (whereas lower-frequency power changes were similar in all electrodes.).
This may be due to previously observed associations between lower- and higher-frequency oscillations and top-down and bottom-up cortical processing, respectively (Engel et al. 2001; Buschman and Miller 2007; Engel and Fries 2010; Arnal and Giraud 2012; Bastos et al. 2015). Lower-frequency (beta) oscillations have been linked to maintaining the existing cognitive set (Engel and Fries 2010; Buschman et al. 2012) and may help to stabilize working memory representations against disruption during memory delays (Pereira and Wang 2014). Our data support these hypotheses. During sample presentation, higher-frequency power increased with contralateral load, especially in electrodes with bottom-up information about stimulus location. The difference in modulation between position-selective and nonposition-selective electrodes suggests that higher-frequency oscillations reflect bottom-up input from sensory areas. However, since nonposition-selective electrodes were also modulated by contralateral load during the late sample/early delay period, albeit more weakly, these oscillations could additionally reflect top-down modulation of cortical areas processing contralateral stimuli. Lower-frequency power decreased with load during sample presentation and in all electrodes. This suggests a more global state change such as a broader focusing of attention across more locations. In contrast, during the late delay, lower-frequency power instead increased only with contralateral load and only in electrodes with information about stimulus location. Thus, during memory maintenance, beta oscillations may stabilize the working memories in the circuits that carry information about the stimuli.
Note that while beta power decreased during stimulus array presentation, beta synchrony increased. Beta synchrony has been linked to shifts of attention between multiple stimuli (Buschman and Miller 2009). Thus, the increase in beta synchrony with stimulus load may reflect an increased number of attentional shifts. One possible source for beta signals is the pulvinar, which projects to both prefrontal and parietal cortex (Asanuma et al. 1985), contains units with both ipsilateral and contralateral receptive fields (Bender 1981), and has recently been shown to modulate low-frequency oscillations and synchrony in extrastriate visual cortex during attention (Saalmann et al. 2012).
Our results put some constraints on models of how cognitive capacity arises. According to “slot” models, capacity is limited by an individual's specific number of memory slots. Once they are filled, capacity is reached (Luck and Vogel 1997, 2013; Vogel et al. 2001; Ma et al. 2014). Any further increase in stimulus load should have no effect on neural activity; once all the slots are filled no more information can be encoded. In contrast, in flexible resource models, information is a like a pool. Increasing stimulus load uses more and more of this pool. Once the pool becomes too thin, behavior can no longer be supported and effective capacity is reached, but increasing load beyond behavioral capacity will continue to draw from the pool and thus continue to affect neural activity (Bays and Husain 2008; Luck and Vogel 2013; Ma et al. 2014). Our subjects had a behavioral capacity of between 1 and 2 in each hemifield. However, we observed increases in LFP power with stimulus load between 2 and 3 stimuli, indicating that the animals processed information about stimuli above behavioral capacity. While the absence of saturation at capacity during stimulus presentation might relate to purely visual processes, the absence of saturation during the late delay period is more surprising and more difficult to explain with a slot model. Nonetheless, it is possible that the power increase reflects maintenance of more spatial locations, but the capacity bottleneck arises in maintaining color per se. Thus, our results are consistent with either a resource model or a modified slot model in which information is maintained about positions of unremembered stimuli, but a fixed number of slots are available for object identity information.
In sum, we found increases in high gamma oscillations with increased stimulus load may reflect changes in feedforward (bottom-up) sensory processing. Decreases in lower-frequency oscillations may instead reflect top-down processes such as the allocation of attention and working memory maintenance.
Supplementary Material
Supplementary Material can be found at http://www.cercor.oxfordjournals.org/ online.
Funding
This work was supported by an NIMH grant 5R01MH091174-05, The MIT Picower Innovation Fund, and an NSF Graduate Research Fellowship to S.K.
Supplementary Material
Notes
We thank A.M. Bastos, S.L. Brincat R. Loonis, M. Lundqvist, and A.S. Widge for comments on the manuscript. Conflict of interest: E.K.M. and T.J.B. have a patent pending for applied use of visual capacity. Based on this patent, E.K.M. is co-founder and chief science officer of SpitSage, Inc.; T.J.B. is a scientific advisor for SplitSage. The authors state that these commercial interests did not influence the study design, data collection, results, or interpretation.
References
- Arnal LH, Giraud A-L. 2012. Cortical oscillations and sensory predictions. Trends Cogn Sci. 16:390–398. [DOI] [PubMed] [Google Scholar]
- Asaad WF, Eskandar EN. 2008. A flexible software tool for temporally-precise behavioral control in Matlab. J Neurosci Methods. 174:245–258. [DOI] [PMC free article] [PubMed] [Google Scholar]
- Asanuma C, Andersen RA, Cowan WM. 1985. The thalamic relations of the caudal inferior parietal lobule and the lateral prefrontal cortex in monkeys: divergent cortical projections from cell clusters in the medial pulvinar nucleus. J Comp Neurol. 241:357–381. [DOI] [PubMed] [Google Scholar]
- Bastos AM, Vezoli J, Bosman CA, Schoffelen J-M, Oostenveld R, Dowdall JR, De Weerd P, Kennedy H, Fries P. 2015. Visual areas exert feedforward and feedback influences through distinct frequency channels. Neuron. 85:390–401. [DOI] [PubMed] [Google Scholar]
- Bays PM, Husain Richter M. 2008. Dynamic shifts of limited working memory resources in human vision. Science. 321:851–854. [DOI] [PMC free article] [PubMed] [Google Scholar]
- Bender DB. 1981. Retinotopic organization of macaque pulvinar. J Neurophysiol. 46:672–693. [DOI] [PubMed] [Google Scholar]
- Buschman TJ, Denovellis EL, Diogo C, Bullock D, Miller EK. 2012. Synchronous oscillatory neural ensembles for rules in the prefrontal cortex. Neuron. 76:838–846. [DOI] [PMC free article] [PubMed] [Google Scholar]
- Buschman TJ, Miller EK. 2007. Top-down versus bottom-up control of attention in the prefrontal and posterior parietal cortices. Science. 315:1860–1862. [DOI] [PubMed] [Google Scholar]
- Buschman TJ, Miller EK. 2009. Serial, covert shifts of attention during visual search are reflected by the frontal eye fields and correlated with population oscillations. Neuron. 63:386–396. [DOI] [PMC free article] [PubMed] [Google Scholar]
- Buschman TJ, Siegel M, Roy JE, Miller EK. 2011. Neural substrates of cognitive capacity limitations. Proc Natl Acad Sci. 108:11252–11255. [DOI] [PMC free article] [PubMed] [Google Scholar]
- Engel AK, Fries P. 2010. Beta-band oscillations—signalling the status quo? Curr Opin Neurobiol Cogn Neurosci. 20:156–165. [DOI] [PubMed] [Google Scholar]
- Engel AK, Fries P, Singer W. 2001. Dynamic predictions: oscillations and synchrony in top–down processing. Nat Rev Neurosci. 2:704–716. [DOI] [PubMed] [Google Scholar]
- Fries P, Womelsdorf T, Oostenveld R, Desimone R. 2008. The effects of visual stimulation and selective visual attention on rhythmic neuronal synchronization in macaque area V4. J Neurosci. 28:4823–4835. [DOI] [PMC free article] [PubMed] [Google Scholar]
- Gray CM, König P, Engel AK, Singer W. 1989. Oscillatory responses in cat visual cortex exhibit inter-columnar synchronization which reflects global stimulus properties. Nature. 338:334–337. [DOI] [PubMed] [Google Scholar]
- Gregoriou GG, Gotts SJ, Zhou H, Desimone R. 2009. High-frequency, long-range coupling between prefrontal and visual cortex during attention. Science. 324:1207–1210. [DOI] [PMC free article] [PubMed] [Google Scholar]
- Gregoriou GG, Rossi AF, Ungerleider LG, Desimone R. 2014. Lesions of prefrontal cortex reduce attentional modulation of neuronal responses and synchrony in V4. Nat Neurosci. 17:1003–1011. [DOI] [PMC free article] [PubMed] [Google Scholar]
- Hipp JF, Engel AK, Siegel M. 2011. Oscillatory synchronization in large-scale cortical networks predicts perception. Neuron. 69:387–396. [DOI] [PubMed] [Google Scholar]
- Howard MW, Rizzuto DS, Caplan JB, Madsen JR, Lisman J, Aschenbrenner-Scheibe R, Schulze-Bonhage A, Kahana MJ. 2003. Gamma oscillations correlate with working memory load in humans. Cereb Cortex. 13:1369–1374. [DOI] [PubMed] [Google Scholar]
- Ikkai A, McCollough AW, Vogel EK. 2010. Contralateral delay activity provides a neural measure of the number of representations in visual working memory. J Neurophysiol. 103:1963–1968. [DOI] [PMC free article] [PubMed] [Google Scholar]
- Jensen O, Tesche CD. 2002. Frontal theta activity in humans increases with memory load in a working memory task. Eur J Neurosci. 15:1395–1399. [DOI] [PubMed] [Google Scholar]
- Kowalska DM, Bachevalier J, Mishkin M. 1991. The role of the inferior prefrontal convexity in performance of delayed nonmatching-to-sample. Neuropsychologia. 29:583–600. [DOI] [PubMed] [Google Scholar]
- Lara AH, Wallis JD. 2014. Executive control processes underlying multi-item working memory. Nat Neurosci. 17:876–883. [DOI] [PMC free article] [PubMed] [Google Scholar]
- Li C-SR, Mazzoni P, Andersen RA. 1999. Effect of reversible inactivation of macaque lateral intraparietal area on visual and memory saccades. J Neurophysiol. 81:1827–1838. [DOI] [PubMed] [Google Scholar]
- Linden DEJ, Bittner RA, Muckli L, Waltz JA, Kriegeskorte N, Goebel R, Singer W, Munk MHJ. 2003. Cortical capacity constraints for visual working memory: dissociation of fMRI load effects in a fronto-parietal network. NeuroImage. 20:1518–1530. [DOI] [PubMed] [Google Scholar]
- Lisman JE, Idiart MAP. 1995. Storage of 7 +- 2 short-term memories in oscillatory subcycles. Science. 267:1512–1515. [DOI] [PubMed] [Google Scholar]
- Luck SJ, Vogel EK. 1997. The capacity of visual working memory for features and conjunctions. Nature. 390:279–280. [DOI] [PubMed] [Google Scholar]
- Luck SJ, Vogel EK. 2013. Visual working memory capacity: from psychophysics and neurobiology to individual differences. Trends Cogn Sci. 17:391–400. [DOI] [PMC free article] [PubMed] [Google Scholar]
- Lundqvist M, Herman P, Lansner A. 2011. Theta and gamma power increases and alpha/beta power decreases with memory load in an attractor network model. J Cogn Neurosci. 23:3008–3020. [DOI] [PubMed] [Google Scholar]
- Luria R, Vogel EK. 2011. Shape and color conjunction stimuli are represented as bound objects in visual working memory. Neuropsychol Attention Short-Term Memory. 49:1632–1639. [DOI] [PMC free article] [PubMed] [Google Scholar]
- Matsushima A, Tanaka M. 2014. Different neuronal computations of spatial working memory for multiple locations within versus across visual hemifields. J Neurosci. 34:5621–5626. [DOI] [PMC free article] [PubMed] [Google Scholar]
- Ma WJ, Husain M, Bays PM. 2014. Changing concepts of working memory. Nat Neurosci. 17:347–356. [DOI] [PMC free article] [PubMed] [Google Scholar]
- McCollough AW, Machizawa MG, Vogel EK. 2007. Electrophysiological measures of maintaining representations in visual working memory. Cortex. 43:77–94. [DOI] [PubMed] [Google Scholar]
- Meltzer JA, Zaveri HP, Goncharova II, Distasio MM, Papademetris X, Spencer SS, Spencer DD, Constable RT. 2008. Effects of working memory load on oscillatory power in human intracranial EEG. Cereb Cortex. 18:1843–1855. [DOI] [PMC free article] [PubMed] [Google Scholar]
- Mitchell DJ, Cusack R. 2011. The temporal evolution of electromagnetic markers sensitive to the capacity limits of visual short-term memory. Front Hum Neurosci. 5:18. [DOI] [PMC free article] [PubMed] [Google Scholar]
- Mittlböck M, Heinzl H. 2002. Measures of explained variation in gamma regression models. Commun Stat Simul Comput. 31:61–73. [Google Scholar]
- Palva JM, Monto S, Kulashekhar S, Palva S. 2010. Neuronal synchrony reveals working memory networks and predicts individual memory capacity. Proc Natl Acad Sci. 107:7580–7585. [DOI] [PMC free article] [PubMed] [Google Scholar]
- Palva S, Kulashekhar S, Hämäläinen M, Palva JM. 2011. Localization of cortical phase and amplitude dynamics during visual working memory encoding and retention. J Neurosci. 31:5013–5025. [DOI] [PMC free article] [PubMed] [Google Scholar]
- Passingham R. 1975. Delayed matching after selective prefrontal lesions in monkeys (Macaca mulatta). Brain Res. 92:89–102. [DOI] [PubMed] [Google Scholar]
- Pereira J, Wang X-J. 2014. A tradeoff between accuracy and flexibility in a working memory circuit endowed with slow feedback mechanisms. Cereb Cortex. doi:10.1093/cercor/bhu202. [DOI] [PMC free article] [PubMed] [Google Scholar]
- Richter CG, Thompson WH, Bosman CA, Fries P. 2015. A jackknife approach to quantifying single-trial correlation between covariance-based metrics undefined on a single-trial basis. NeuroImage. 114:57–70. [DOI] [PubMed] [Google Scholar]
- Saalmann YB, Pinsk MA, Wang L, Li X, Kastner S. 2012. The pulvinar regulates information transmission between cortical areas based on attention demands. Science. 337:753–756. [DOI] [PMC free article] [PubMed] [Google Scholar]
- Salazar RF, Dotson NM, Bressler SL, Gray CM. 2012. Content-specific fronto-parietal synchronization during visual working memory. Science. 338:1097–1100. [DOI] [PMC free article] [PubMed] [Google Scholar]
- Sawaguchi T, Goldman-Rakic PS. 1991. D1 dopamine receptors in prefrontal cortex: involvement in working memory. Science. 251:947–950. [DOI] [PubMed] [Google Scholar]
- Siegel M, Donner TH, Oostenveld R, Fries P, Engel AK. 2008. Neuronal synchronization along the dorsal visual pathway reflects the focus of spatial attention. Neuron. 60:709–719. [DOI] [PubMed] [Google Scholar]
- Todd JJ, Marois R. 2004. Capacity limit of visual short-term memory in human posterior parietal cortex. Nature. 428:751. [DOI] [PubMed] [Google Scholar]
- Todd JJ, Marois R. 2005. Posterior parietal cortex activity predicts individual differences in visual short-term memory capacity. Cogn Affect Behav Neurosci. 5:144–155. [DOI] [PubMed] [Google Scholar]
- Vinck M, van Wingerden M, Womelsdorf T, Fries P, Pennartz CMA. 2010. The pairwise phase consistency: a bias-free measure of rhythmic neuronal synchronization. NeuroImage. 51:112–122. [DOI] [PubMed] [Google Scholar]
- Vogel EK, Machizawa MG. 2004. Neural activity predicts individual differences in visual working memory capacity. Nature. 428:748–751. [DOI] [PubMed] [Google Scholar]
- Vogel EK, McCollough AW, Machizawa MG. 2005. Neural measures reveal individual differences in controlling access to working memory. Nature. 438:500–503. [DOI] [PubMed] [Google Scholar]
- Vogel EK, Woodman GF, Luck SJ. 2001. Storage of features, conjunctions, and objects in visual working memory. J Exp Psychol Hum Percept Perform. 27:92–114. [DOI] [PubMed] [Google Scholar]
- Voytek B, Knight RT. 2010. Prefrontal cortex and basal ganglia contributions to visual working memory. Proc Natl Acad Sci USA. 107:18167–18172. [DOI] [PMC free article] [PubMed] [Google Scholar]
- Womelsdorf T, Fries P, Mitra PP, Desimone R. 2006. Gamma-band synchronization in visual cortex predicts speed of change detection. Nature. 439:733. [DOI] [PubMed] [Google Scholar]
Associated Data
This section collects any data citations, data availability statements, or supplementary materials included in this article.


