Abstract
The process of validating an assay for high-throughput screening (HTS) involves identifying sources of variability and developing procedures that minimize the variability at each step in the protocol. The goal is to produce a robust and reproducible assay with good metrics. In all good cell-based assays, this means coefficient of variation (CV) values of less than 10% and a signal window of fivefold or greater. HTS assays are usually evaluated using Z′ factor, which incorporates both standard deviation and signal window. A Z′ factor value of 0.5 or higher is acceptable for HTS. We used a standard HTS validation procedure in developing small interfering RNA (siRNA) screening technology at the HTS center at Southern Research. Initially, our assay performance was similar to published screens, with CV values greater than 10% and Z′ factor values of 0.51 ± 0.16 (average ± standard deviation). After optimizing the siRNA assay, we got CV values averaging 7.2% and a robust Z′ factor value of 0.78 ± 0.06 (average ± standard deviation). We present an overview of the problems encountered in developing this whole-genome siRNA screening program at Southern Research and how equipment optimization led to improved data quality.
Keywords: high throughput screening, RNA interference, small interfering RNA, coefficient of variation
RNA interference (RNAi), and small interfering RNA (siRNA) technology in particular, is a powerful tool for target identification and reverse genetics. Gene expression can be effectively silenced in a highly specific manner through RNAi.1–3 In more recent years, RNAi-based drug discovery via siRNA has become very useful in investigating possible drug targets in a wide range of diseases. Genome-wide siRNA high-throughput screening (HTS) has emerged as a means to investigate the entire genome, with a number of large-scale siRNA libraries currently available to target complete genomes for multiple organisms.
One of the main differences between small-molecule screening and siRNA screening is that siRNA assays usually have a relatively small signal window, and it is harder to differentiate signal from noise in siRNA screening because many of the siRNAs will have some effect on the cells. Thus, in effect, the problems of high variability and low signal window contribute to siRNA screens not being as robust and reproducible as small-molecule screens. The transfection step in siRNA screening adds additional variability, which contributes to low Z′ values. Variables that affect these screens need to be kept to a minimum. The metrics for small-molecule HTS have been greatly improved over the past 20 years, primarily by controlling technical problems such as liquid-handling irregularities at each step, thus lowering assay variability and generally improving quality control. Applying this same strategy to siRNA whole-genome screening should produce the same result.
Materials and Methods
Cells and Culture
Human embryonic kidney 293 (HEK293) cells were cultured in Dulbecco's modified Eagle's medium (11965-118, Invitrogen, Carlsbad, CA), supplemented with 10% fetal bovine serum (growth media; Omega Scientific FB-01, Tarzana, CA), and maintained at 37 °C/5% CO2. Cells were expanded, and sufficient quantities for the entire assay were frozen down at the same passage number in Recovery Cell Culture Freezing Medium (Invitrogen).
Library Preparation and Dispense
The siRNA library used in this study (Silencer Select siRNAs) was purchased from Ambion (Applied Biosystems, Carlsbad, CA). A Biomek FX liquid handler (Beckman Coulter, Brea, CA) was used to solubilize the library in RNAse-free water and transfer to Echo qualified 384-well polypropylene source plates (P-05525; Labcyte, Sunnyvale, CA). The siRNAs were dispensed into 384-well assay plates (Corning 3712; Corning, NY) using an Echo 555 Series Liquid Handler (Labcyte). All plates included a negative control (scrambled, nontargeting) siRNA (siRNA #1, Ambion), a positive control siRNA for transfection efficiency (s21, Ambion), and an assay-specific control siRNA. The dispensed siRNAs were then allowed to air dry at room temperature, after which the plates were sealed and stored at −20 °C until needed for the screen.
siRNA Transfection
For assay setup, the assay plates (containing 0.15 pmol of dried-down siRNA) were removed from the −20 °C freezer and equilibrated to room temperature. Lipofectamine RNAiMax (13778-150, Invitrogen) was diluted 1:167 in Optimem (31985-088, Invitrogen) and 10 μL added to the plates using a Multidrop Combi dispenser (Thermo Fisher Scientific, Waltham, MA). Following a 30-s spin at 500 rpm, the plates were incubated at room temperature for 1 h. Cells were plated in 20 μL volume (1600 cells/well) using a Multidrop Combi dispenser and incubated for 6 d at 37 °C/5% CO2 in a Forma incubator (Forma 3307; Thermo Fisher Scientific). The cells were assayed using Invitrogen's PrestoBlue cell viability reagent (A-13262, Invitrogen) according to manufacturer's protocol. Plates were read on an EnVision multilabel plate reader (PerkinElmer, Waltham, MA).
Data Analysis
All data were imported into ActivityBase (IDBS) data management system for analyses. Data were normalized and reported as percentage inhibition, which was calculated using the formula: 100 × ((Scrambled siRNA Control Value - Data Value)/Scrambled siRNA Control Value), where Data Value is the reading from each sample siRNA being tested.
Results and Discussion
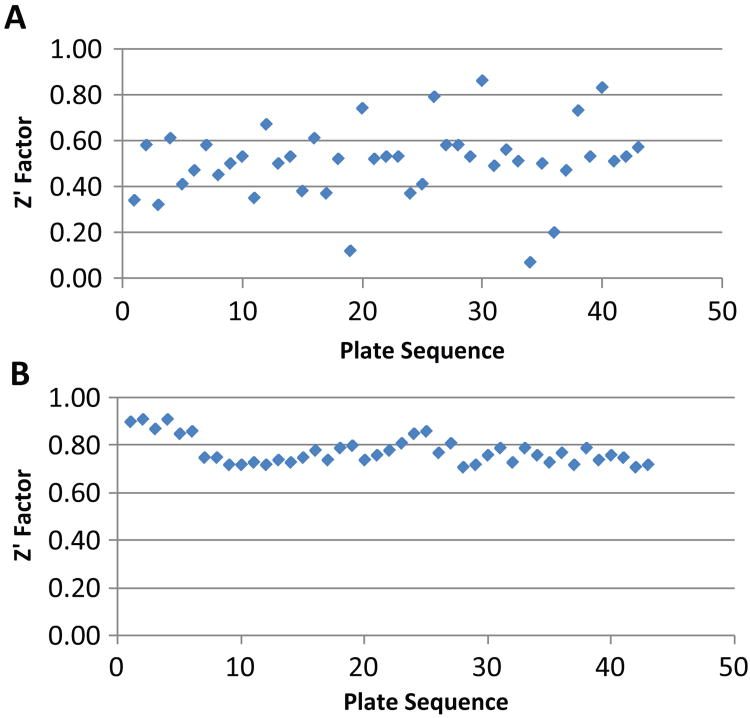
Because siRNA HTS grew up independently from small-molecule screening, some of the same issues that were observed in small-molecule HTS, such as equipment artifacts and cell-derived variation, are also affecting siRNA screens. The goal of this HTS was to establish a siRNA screening facility at Southern Research Institute and optimize assay parameters to achieve good assay reproducibility. When we started, the average Z′ factor value was 0.51 ± 0.16 SD (Fig. 1A). Following extensive troubleshooting and optimization, the average Z′ factor value was 0.78 ± 0.06 SD (Fig. 1B). The technical problems that were optimized to get from Fig. 1A to Fig. 1B included the following.
Figure 1.
Z′ factor values from a 320 siRNA plate before and after troubleshooting and assay optimization. (A) Z′ analysis before troubleshooting with Z′ factor value of 0.51 ± 0.16 (average ± standard deviation), n = 43. (B) Z′ data after troubleshooting showing a robust Z′ factor value of 0.78 ± 0.06 (average ± standard deviation), n = 43.
Problem 1: Equipment Artifacts
With regard to liquid handlers, the first technical problem was encountered during the dispensing of the siRNAs. Labcyte's Echo 555 was our instrument of choice for dispensing the siRNAs to assay plates for three reasons: (1) it is a noncontact dispenser, which eliminates the potential contamination of the library. Conventional transfer technology such as disposable tips or pin tools that contact the liquid have the potential to contaminate the siRNA library. (2) Because the Echo uses acoustic drop ejection technology, which enables low nanoliter transfers for high-throughput screening applications, the siRNA library can be dispensed, dried down, and frozen weeks or even months in advance of the assay itself. (3) The siRNA library can be maintained at a relatively high concentration because of the low volume dispensing ability of the Echo. The siRNAs are more stable at higher concentrations and are less affected by multiple freeze-thaws. The 555 model of the Echo has aqueous dispense capability, which is critical because our siRNA library is dissolved in water.
A source plate for the siRNA library was another area in which technical problems were seen. The siRNA library was purchased from Ambion in a plate that was not Echo compatible (Axygen Cat No. P-384-120SQ-S). Initially, the library was resuspended in water at 25 μM, and the stock was transferred (in-house) to Echo low-volume 384 source plates and frozen at −20 °C. When the plates were removed from −20 °C and warmed up to room temperature, bubbles consistently formed in the siRNA solution. According to Labcyte, for the Echo to transfer accurately, the sample solution must be properly mixed, bubble free, and in intimate contact with the bottom of the wells in the source plate. This means bubbles need to be cleared before transfer. Because of the bubbles, numerous wells were skipped during the Echo dispense procedure, compromising liquid transfer accuracy and precision. Centrifuging failed to eliminate these bubbles, no matter how long the plates were spun. At speeds greater than 3000 rpm, plate failures occurred, so raising the speed was not an option. To address this problem, we changed source plate types; the siRNAs were transferred to an Echo-qualified 384-well low-dead-volume COC source plate by Labcyte Inc. (Cat No. LP-0200). This helped reduce but did not completely eliminate the bubbles. After testing other source plate types, it was determined that the Echo-qualified 384-well polypropylene source plate (Cat No. P-05525) gave the best results. Bubbles still formed upon thawing, but centrifuging at 3000 rpm for 5 min completely eliminated all bubbles, and no further dispense issues by the Echo were encountered.
The second source of variability from a liquid handler came from using Thermo Scientific's Multidrop Combi to dispense transfection reagent to the plates. The Multidrop Combi reagent dispenser comes with two cassette head types: the small tube (fine-bore) dispensing cassette and the standard tube dispensing cassette. For dispensing the transfection reagent, we initially chose the small-bore dispensing cassette (Thermo Scientific 24073295). We thought this cassette type would produce more accurate mixing and avoid the need to centrifuge the plates, which can disrupt micelle formation. We found that using the small-bore dispensing cassette occasionally generated tiny droplets on the walls of the plate wells that could not be eliminated even by centrifugation up to 3000 rpm. Centrifuging at such high speeds may be detrimental to micelle formation and is therefore not advisable. Because these tiny droplets hang on the sides of the well, each reaction contained variable amounts of transfection reagent. The variability from using this cassette head type was therefore very high. We switched to a standard-bore dispensing cassette (Thermo Scientific 24072675), which is not normally recommended for dispensing volumes as small as 5 to 10 μL because they are less accurate and tend to leave large drops of liquid on the sides of the wells. However, unlike the small droplets created by the small-bore cassette, it was very easy to spin down the larger drops left on the walls of the wells when using a standard-bore cassette. Centrifuging at 500 rpm for just 5 s resulted in all the liquid settling to the bottom of the well, producing a good coefficient of variation (CV). This demonstrated how something as minor as the cassette head type/bore size choice can significantly affect reproducibility in an assay.
Problem 2: Position of Controls on a Plate
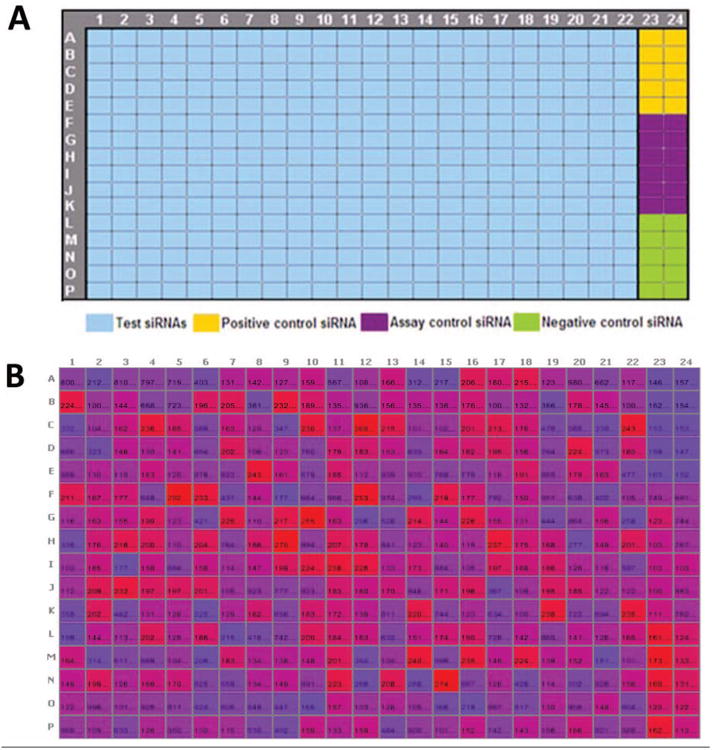
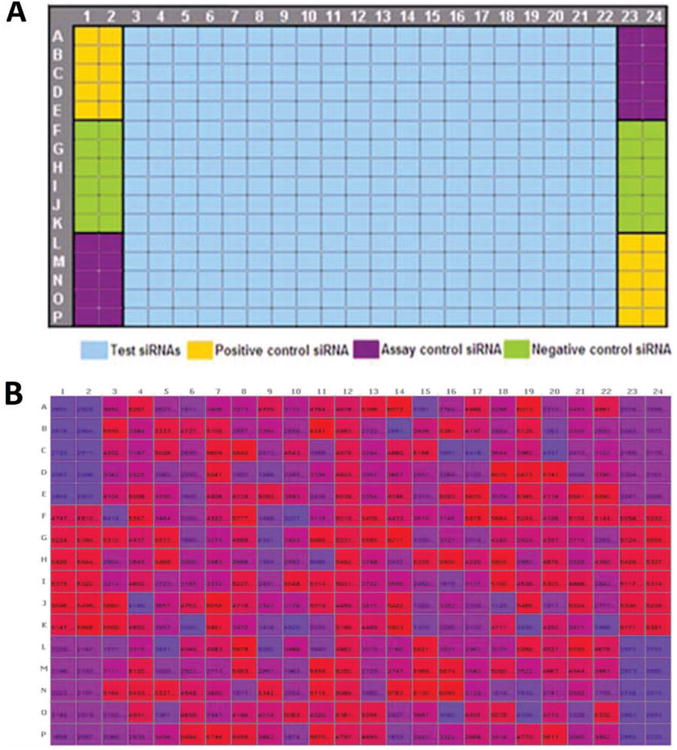
In small-molecule screening, controls are most often placed on both sides of a plate, usually columns 1, 2, 23, and 24. However, some siRNA libraries (such as the Ambion library used in this screen) come in 384-well plates, with only columns 23 and 24 empty, such that only these two columns are available for controls (Fig. 2). This means the number of wells available for each control is half of what would normally be used in a small-molecule screen. Figure 2 shows the plate format we used in our initial screen. In this assay, all sample wells were normalized to the scrambled (negative) control. When this particular control was placed at the corners (bottom right) of the plate (Fig. 2A), it was more susceptible to edge effects (Fig. 2B). The variability resulting from this led to high CV and lower Z′ factor values. Switching to the plate format in Figure 3A places this important control in the center, thereby minimizing edge effects (Fig. 3B). Moreover, by reformatting the controls to be on both sides of the plate, we increased the number of wells for each control (n = 20 or higher). The rearray of siRNAs to support additional control wells was easily accomplished with the Echo and would have been much more difficult with a conventional multichannel liquid handler.
Figure 2.

Plate format showing layout of controls before troubleshooting. (A) Plate template showing controls on only one side of the plate. (B) Heat map of raw values from a 384-well plate showing edge effect.
Figure 3.

Plate format showing layout of controls after extensive troubleshooting. (A) Plate template with controls on both sides of the plate, increasing the number of control wells. Negative control (scrambled siRNA) is strategically placed in the center wells of the column to minimize edge or corner effect. (B) Heat map of raw values from a 384-well plate showing eradication of edge effect following troubleshooting and change of plate format.
Various groups use different plate formats in their screens. Some libraries come with all outer wells of each plate empty, to avoid evaporation issues and edge effects. In a 384-well plate, there would be 76 wells that would not be used on each plate, greatly reducing throughput and increasing expense. This is a problem that can be easily addressed by minimizing the factors that cause edge effects, such as the use of appropriately humidified incubators. We use the Thermo/Forma Steri-cult model 3310 or 3307 incubators (Thermo Fisher Scientific) with active humidification to minimize evaporation issues. Edge effects are often made worse by the length of plate incubation in the assay. The optimal incubation time to achieve the maximal RNAi effect in our assay was 6 d (144 h). Even with a 6-d assay, we still do not observe edge effects. The only edge pattern we observe is at the four corners of each plate, and by placing the least affected and less important control (the transfection control) in this position, this problem is minimized (Fig. 3).
Problem 3: Batch Size
The final contributor to variability that we identified was the screening batch size. Batch size here refers to the number of plates screened in one set using the same mixture of transfection reagent and cells and not the number of plates screened in a day. We initially performed the pilot screen in batches of roughly 70 plates, a typical size for a small-molecule screen. This did not prove to be ideal, and when we reduced the batch size to no more than 30 plates per batch, we obtained better results. Sufficient transfection reagent and cells were prepared for 30 (or fewer) plates, and after these were processed, transfection reagent and cells were prepared for the next 30 or so plates. Preparing the transfection reagent in small batches and running just a few plates at a time ensured that timing between plates and therefore transfection efficiency was kept relatively constant. Identifying the number of plates screened in a batch as one of the factors that affect the quality of data was not very surprising as we have previously seen this in small-molecule screening.
How siRNA Screening Compares to Small-Molecule Screening
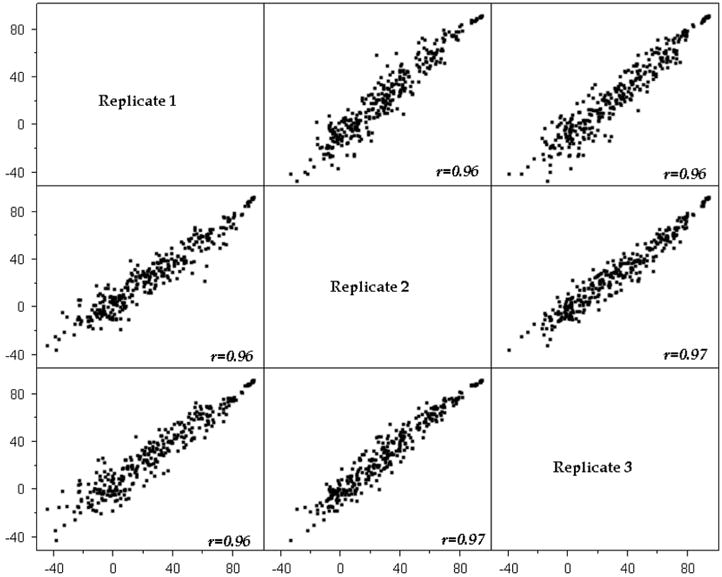
According to Birmingham and coworkers,4 (Supplementary Table 1), the median CV for siRNA assays is 26.5%, whereas that for small-molecule assays is 13.4%. In the siRNA assay conducted at the Southern Research HTS Center after extensive troubleshooting, the CV values from the optimized assay plate were even better than 13.4%, with a median CV of 7.2%, a median signal-to-background of 15.46, and an average Z′ factor value of 0.78. This experiment was run in triplicate and on 3 different days. The assay parameters were determined by comparing the median positive control signal to the negative control signal for each plate. Although published Z′ factor values for siRNA screens are generally less than 0.5, our Z′ factor values for this assay were greater than 0.7, comparable to small-molecule screening parameters, and exceeding the norm reported for genome-wide siRNA screens. The day-to-day reproducibility between runs was also very high, as depicted in Figure 4, which shows robust Pearson correlations between the triplicate data.
Figure 4.

Reproducibility of RNAi high-throughput screening. Pearson correlation plots of percentage inhibition values across three replicates of one master plate (320 siRNAs) showing excellent reproducibility after troubleshooting.
We have shown that data from siRNA screens can be as robust and reproducible as that from small-molecule screens. Significant improvements in assay metrics and data quality were achieved by evaluating variability at each step in the assay and adjusting the protocol to minimize it. Artifacts that were introduced from a variety of sources were addressed, and the final result was a robust and reproducible assay suitable for whole-genome screening. The validation process used for HTS of small-molecule libraries can be applied to other high-throughput processes to improve results.
Acknowledgments
Funding: The authors disclosed receipt of the following financial support for the research, authorship, and/or publication of this article: This work was supported by a Southern Research Institute Research and Development Award (E.L.W.), the Alabama Drug Discovery Alliance, and NIH grants CA023099 and CA058755 (M.-A.B.).
Footnotes
Declaration of Conflicting Interests: The authors declared no potential conflicts of interest with respect to the research, authorship, and/or publication of this article.
References
- 1.Fire A, Xu S, Montgomery MK, Kostas SA, Driver SE, Mello CC. Potent and Specific Genetic Interference by Double-Stranded RNA in Caenorhabditis elegans. Nature. 1998;391:806–811. doi: 10.1038/35888. [DOI] [PubMed] [Google Scholar]
- 2.Napoli C, Lemieux C, Jorgensen R. Introduction of a Chimeric Chalcone Synthase Gene into Petunia Results in Reversible Co-suppression of Homologous Genes in Trans. Plant Cell. 1990;2:279–289. doi: 10.1105/tpc.2.4.279. [DOI] [PMC free article] [PubMed] [Google Scholar]
- 3.Hannon GJ. RNA Interference. Nature. 2002;418:244–251. doi: 10.1038/418244a. [DOI] [PubMed] [Google Scholar]
- 4.Birmingham A, Selfors LM, Forster T, Wrobel D, Kennedy CJ, Shanks E, Santoyo-Lopez J, Dunican DJ, Long A, Kelleher D, Smith Q, Beijersbergen RL, Ghazal P, Shamu CE. Statistical Methods for Analysis of High-Throughput RNA Interference Screens. Nat Methods. 2009;6:569–575. doi: 10.1038/nmeth.1351. [DOI] [PMC free article] [PubMed] [Google Scholar]


