Abstract
Parallel temperature initial rates (PTIR) from chromatographic separation of aggregating protein solutions are combined with continuous simultaneous multiple sample light scattering (SMSLS) to make quantitative deductions about protein aggregation kinetics and mechanisms. PTIR determines the rates at which initially monomeric proteins are converted to aggregates over a range of temperatures, under initial-rate conditions. Using SMSLS for the same set of conditions provides time courses of the absolute Rayleigh scattering ratio, IR(t), from which a potentially different measure of aggregation rates can be quantified. The present report compares these measures of aggregation rates across a range of solution conditions that result in different aggregation mechanisms for anti-streptavidin (AS) immunoglobulin gamma-1 (IgG1). The results illustrate how the two methods provide complementary information when deducing aggregation mechanisms, as well as cases where they provide new mechanistic details that were not possible to deduce in previous work. Criteria are presented for when the two techniques are expected to give equivalent results for quantitative rates, the potential limitations when solution non-idealities are large, as well as a comparison of the temperature dependence of AS-IgG1 aggregation rates with published data for other antibodies.
Keywords: protein stability, aggregation rates, aggregation mechanisms, laser scattering
Introduction
Proteins are inherently labile molecules that maintain a dynamic equilibrium between folded and unfolded or partly unfolded states in solution, with only a marginal free energy bias towards folded states under native-favoring or folded-state favoring conditions [1]. Proteins such as monoclonal antibodies (MAbs) are one of the fastest growing classes of new therapeutic candidates in the pharmaceutical industry [2]. As part of the process for developing therapeutic protein drug products, one must assess and optimize their in vitro stability in the context of a number of degradation routes [3]. One of the most prevalent routes is non-native aggregation, which generally refers to processes by which an otherwise natively folded, monomeric protein can become incorporated into aggregates that are composed of partly or fully unfolded protein chains [4]. In many cases, the aggregates are stabilized by strong noncovalent contacts between hydrophobic amino acids, as well as hydrogen bonding between the amide backbone of neighboring proteins. As a result, such non-native aggregates often have a large degree of inter-protein beta-sheet structure, and are effectively irreversible under the solution conditions that they form [5,6]. While some of the early stages of non-native aggregation (hereafter referred to simply as aggregation) are often reversible, the net aggregation process is irreversible and this requires one to consider aggregation rates and mechanisms or pathways when designing rational strategies to control and improve protein stability [3,7].
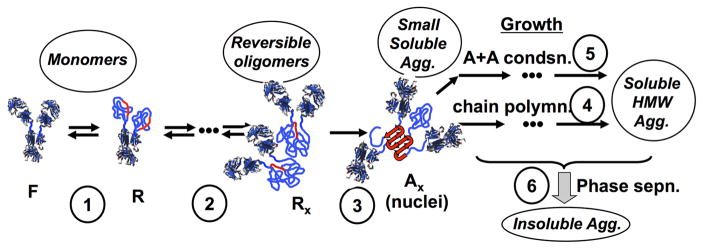
There are too many possible aggregation mechanisms to realistically summarize within the scope of this report. However, work to date indicates that a number of therapeutic proteins such as MAbs [8–15], antibody fragments [16,17], and cytokines [18,19] share a relatively common set of possible aggregation pathways that are also adopted by non-therapeutic proteins [20–22]. Figure 1 summarizes these schematically for the case of an antibody, and is adapted from ref. [6,23]. Briefly, monomeric proteins can partly or fully unfold to reveal hydrophobic sequences that are able to form strong inter-protein contacts that stabilize aggregates – so called, aggregation-prone “hot spots” [24,25]. This unfolding process is reversible if the monomers are able to refold prior to encountering another protein. Under most conditions of practical interest, the temperature is sufficiently far below the midpoint unfolding temperature (Tm) that the unfolding transition(s) will equilibrate more rapidly than the time scales for subsequent aggregation events [7]. In this case, the fraction of the monomer population that comprises the (partly) unfolded or “reactive” (R) state is determined by the thermodynamics of unfolding. Therefore, the net rate of aggregation can change by orders of magnitude with a temperature change of only 5 to 10 °C, because the equilibrium constant for unfolding (K) has a large unfolding enthalpy (ΔHun) associated with it [26,27].
Figure 1.
Schematic depiction of multiple stages in non-native aggregation of monoclonal antibodies in solution: (1) partial unfolding to reveal aggregation-prone “hot spots” (red); (2) weak, reversible self-association, prior to (3) structural rearrangement to form effectively irreversible nuclei that then have the potential to grow via (4) monomer addition (termed chain polymerization) or (5) aggregate-aggregate coalescence (association polymerization) and ultimately (6) aggregate phase separation. Adapted from ref. [6,23]
Association of R monomers may involve reversible steps prior to nucleation of the smallest species that are effectively irreversible; termed nuclei and denoted by Ax (x = nucleus stoichiometry) in Figure 1. Historically, many of the protein and peptide systems that were studied showed rapid “downhill” polymerization of these initially small aggregates. This led to the use of the term “nuclei”, by analogy with nucleation and growth in phase transitions [7]. More recently, it has been shown that protein such as MAbs display a wider variety of behaviors. In some cases, they form irreversible dimers (x=2) but those dimers grow very slowly, if at all [8,11,12,28]. In the nomenclature of ref. [11,12], this was termed nucleation-dominated (ND) aggregation, and corresponds to effectively stopping at stage (3) in Figure 1. In other cases, nucleation is combined with significant consumption of monomer via growth by monomer-addition or “chain polymerization” (CP), which corresponds to the combination of stages (1) to (4) in Figure 1 [10–12,29]. Finally, when aggregates associate rapidly with each other one can observe growth via association polymerization (AP) to form very large soluble species, as well as essentially phase separation (PS) of the aggregates [8,10–12,29–32].
Recently, the effects of solution conditions (pH, NaCl concentration, and buffer species) were determined systematically for the aggregation mechanisms of an immunoglobulin gamma-1 (IgG1) antibody that targets streptavidin [11,12], and that will serve as a test system in this report. For example, the mechanism shifted between ND, CP, and PS simply by changing the solution pH between 4 and 6 with 5 mM sodium citrate buffer [11,12]. That work utilized ex vivo laser scattering with size exclusion chromatography (SEC) for a single temperature for each solution conditions, and required multiple samples at each temperature. From a practical perspective, this required significant user manipulation, user time, sample material, and also did not address the question of whether the mechanisms change as a function of temperature. The present report focuses on an approach to circumvent those limitations by combining two recently developed methods to obtain temperature-dependent measures of aggregation rates: parallel-temperature initial rates (PTIR) with SEC [33], and simultaneous multiple-sample static light scattering (SMSLS) [34].
Parallel temperature initial rates (PTIR) analysis uses the following approach for quantifying degradation rates as a function of temperature; in this case the degradation route is aggregation. For context, in conventional approaches one determines monomer loss for many samples at predetermined incubation times for a single or small number of temperatures. In the PTIR method, one instead determines monomer loss for a single or small number of samples at many temperatures for the same incubation time. It has been shown elsewhere, that in the initial-rate regime the two approaches are quantitatively equivalent, but the PTIR method is more sample sparing and efficient [33]. Because aggregation is determined only for the initial rates regime, no specific aggregation model needs to be assumed, although they can be inferred later (see Discussion). The resulting aggregation rate coefficient (kobs), or reduced initial-aggregation-rate (units of 1/time), is given generally by
| (1) |
and is based on the general result that many mechanisms reduce to zero-order kinetics in the limit of small extents of reaction [33,35]. In the above relations, t is the preselected incubation time, T is the incubation temperature, cm is the concentration of monomer at T for that incubation time, and cm,0 is the initial concentration prior to heating. In previous work, the ratio of cm to cm,0 was defined as the monomer fraction (m) [12,33].
The development of simultaneous multiple static light scattering (SMSLS) was based on the idea that the many methods monitor only a small number of particular time points due to the need for ex situ analysis, or they monitor a single sample in situ and do not take advantage of the ability to reconfigure the instrument to monitor multiple samples in parallel. SMSLS monitors many samples in parallel and allows one to take advantage of a similar parallel approach to what PTIR is based upon. In the limit of low protein concentration (more rigorously, the limit of negligible non-idealities from protein-protein and protein solvent/cosolute interactions), light scattering (LS) provides the weight-averaged molecular weight (Mw) for a given sample [34,36]. In addition, the weight-averaged molecular weight necessarily provides a different “extent of reaction” compared to the number-averaged molecular weight – the latter is mathematically equivalent to the extent of monomer loss in the limit where all aggregates remain soluble [22,37]. Within a number of biotechnology industries, it is important to quantify aggregation rates based on the standard of monomer loss (percent mass conversion) [23,38]. As such, it is of interest from a practical perspective to determine conditions where aggregation rates from SMSLS and PTIR will give comparable results. From a fundamental perspective, it is also potentially useful to identify criteria and conditions where methods such as SMSLS and PTIR can provide complementary information to monitor how aggregation mechanisms potentially change as a function of temperature and other parameters such as solution conditions. This report provides a foundation for future application of PTIR and SMSLS as a combination approach for quantifying protein aggregation rates and determining aggregation mechanisms across a range of solution conditions and/or temperatures.
The remainder of the report is organized as follows. The experimental methods, data analysis, and a previously developed mass-action kinetic model for mechanisms in Figure 1 are summarized in the Materials and Methods. The Results and Discussion section then provides a comparison of the temperature dependent rates and time-dependent behaviors for SMSLS and PTIR in the initial-rates regime that is most relevant for practical purposes such as assessing shelf life of biotechnology products. A comparison between rates from SMSLS and PTIR illustrate conditions where the rates agree quantitatively and where they differ significantly, as well as factors that must be considered when interpreting or defining rates based on different techniques. That is followed by a discussion of key experimental features of different aggregation mechanisms that can be deduced as a function of temperature by combining PTIR and SMSLS, as well as conditions where the two methods are complementary versus when they are expected to be redundant. Analysis is also shown to provide the threshold oligomer size before phase separation is dominant under real-time conditions. Such a threshold was hypothesized in previous theoretical work and inferred indirectly from kinetic modeling of ex situ aggregation data [10,18,26,39], but to the best of our knowledge this is the first time it has been directly corroborated experimentally in situ. Finally, the temperature dependence of aggregation rates for AS-IgG1 are compared with those reported previously for different monoclonal antibodies [34], as well as for the IgG1 Fc domain [17], to illustrate insights that a quantitative Arrhenius analysis can provide regarding the unfolding stage(s) of aggregation.
Materials and Methods
Materials
Amgen provided AS-IgG1 at a stock concentration of 30 mg/mL. 5 mM citrate buffer solutions were prepared using MilliQ distilled deionized water (Millipore, Billerica, MA), citric acid monohydrate (Fisher Scientific), and sodium chloride (Fisher Scientific). The solution pH was adjusted using sodium hydroxide (Fisher Scientific). Protein solutions were dialyzed against the desired buffer as previously described [12]. After dialysis, solutions were filtered with 0.22 μm filters (Millipore), and the concentration was determined from the absorbance at 280 nm using a UV-vis spectrophotometer (Agilent 8453 UV-Vis, Agilent Technologies, Santa Clara, CA) using the AS-IgG1 extinction coefficient of 1.586 mL/mg cm. All solutions were diluted gravimetrically to final AS-IgG1 concentrations of 1 mg/mL.
SMSLS
The SMSLS instrument was a prototype version provided by Advanced Polymer Monitoring Techologies, Inc. (New Orleans, LA). It has 16 independent sample cells, each with its own 660 nm, vertically polarized 30mW diode laser providing incident light, along with independent, programmable temperature control and stepper-motor-controlled stirring, and fiber optic-coupled light scattering detection at 90°. Unlike serial measurement instruments, the SMSLS has no moving optical components so that accurate alignment is permanently maintained for each cell, which further allows absolute measurements of Mw to be made over extended periods of time [34].
PTIR
PTIR was performed using a custom built device that allows up to 10 independent chambers to be held simultaneously at different temperatures, each with independent Peltier control. Protein solutions were incubated in hermetically sealed HPLC vials (Waters, Milford, MA). After a given time, vials were removed from the PTIR device and quenched on ice to effectively halt the aggregation process. The concentration of remaining monomer (cm) and the initial monomer concentration (cm,0) for a given protein solution was determined using size exclusion chromatography as described previously [12,33]. The aggregation initial-rate coefficient (kobs) was calculated from Eq. 1, after assuring that the fractional monomer loss (1 − cm/cm,0) was small compared to 1. The resulting kobs values were determined as a function of pH, NaCl concentration, and T, and were reported in Ref. [33]. The rates depend strongly on solution conditions (pH and ionic strength) and temperature. Different solution conditions are needed in order to change which mechanism predominates. Therefore, in order for aggregation to occur on practical time scales (hours to days) it was necessary to use somewhat different temperature ranges for the different solution conditions that give rise to the different mechanisms.
Combining PTIR and SMSLS
Mass balances relate the time dependent concentrations (mass/volume) of monomers and the sum over all aggregate species.
| (2) |
where ci(t) is the concentration (mass/volume) of each aggregate species at any time, t – i.e., i=2 denotes dimer, i=3 denotes trimer, etc. For highly purified protein solutions such as therapeutic protein products, one typically neglects the summation on the left hand side of Eq. 2 because the initial sample is essentially all monomer (see discussion below for exceptions to this). As defined in Eq. 1, kobs is the rate of early-time or linear stage of monomer depletion from PTIR, therefore
| (3) |
The time-dependent excess Rayleigh scattering ratio IR(t) monitored by SMSLS is the sum of scattering particle subpopulations
| (4) |
where virial coefficient effects have been ignored, as justified below. M1 is the molecular weight of the monomeric protein, c1(t) = cm(t) is the remaining concentration of monomeric protein at time t, and ci was defined above for i > 1. Ki is an optical constant defined for vertically polarized incident light, for each subpopulation i, by
| (5) |
where n is the solution refractive index, (∂n/∂ci) is the refractive index increment of the protein species i in the given solution, NA is Avogadro’s number, and λ is the wavelength of the laser in vacuo. Making the simplifying assumption that (∂n/∂ci) is the same for the monomeric protein and all aggregates allows Ki to be taken out of the summation, and each Ki value set equal to K. The usual Zimm expression within the Rayleigh-Debye approximation can then be used
| (6) |
where Mw is the weight-average molar mass of all scatterers in the solution, <Rg2>z is the z-average mean-square radius of gyration of the scattering population, <A2> is a complex double average over the second virial coefficients (A2) accounting for two-body interactions (often termed B22 in the literature for momomeric protein-protein interactions), and q is the magnitude of the scattering vector given by
| (7) |
where θ is the angle of the scattering detector in the plane.
Two important simplifying assumptions can be further made when SMSLS detection is at a single angle (90° in the current instrument). For monomeric proteins, small oligomers, and dense larger aggregates, the characteristic dimension is typically below ~ 10–20 nm. Therefore the term q2<Rg2>/3 in water (n=1.33), and for λ=660 nm, is much less than 1 and can be neglected. Second, for dilute protein solutions <A2> is often small enough in magnitude to neglect the contributions from protein-protein interactions (see also, discussion below). Hence, the approximation can be used that the total IR(t) is the sum of the scattering from each sub-population IR,i according to the form
| (8a) |
In Eq. 8, cagg(t) is the net concentration (mass/vol.) of all aggregated proteins at time t, which is the right hand sum in Eq. 2, and Mw,agg(t) is the weight-average molecular weight for the distribution of aggregates in the solution at time t. Eq. 8a can also be further simplified by the identity cm(t) + cagg(t) = cm,0 for a homogeneous solution if cagg = 0 at t=0, giving
| (8b) |
Hence, knowledge of cm(t) can be combined with IR(t) from SMSLS to determine Mw,agg(t), which is useful from the standpoint of interpreting kinetics and developing mechanistic models.
In the limiting case of the early-stage or initial-rate regime, Eq. 8b can be combined with Eq. 2 and 3 to give
| (9) |
where kobs is defined based on the initial-rate of monomer loss. This shows that if Mw,agg(t) is independent of time in the initial-rate regime, then IR(t) must be linear. For example, if growth beyond dimers is negligible (i.e., in the ND model below, with x=2) then IR(t) must be linear. Results shown below illustrate that for practical purposes, effectively linear IR(t) profiles are possible for a broader range of conditions than this rigorous limit. Highly non-linear increasing IR(t) profiles are indicative of more complex aggregation mechanisms. Alternatively, if the protein monomers and/or aggregates fragment over time then Eq. 9 shows that Mw,agg(t) and IR(t) will decrease over time.
In previous SMSLS analysis [34] the initial aggregation rate (ARo) was defined as
| (10) |
i.e., AR0 is the slope of the early-time, linear increase in light-scattering signal versus time. Therefore, AR is equivalent to the fractional increase in weight-average molecular weight per second (averaged over monomer and aggregate populations). For clarity, it is noted that in previous literature Mo was used instead of M1, to indicate the mass of unaggregated, monomeric protein prior to any stress such as elevated temperature or stirring that was applied at t=0. In the present work, the ‘o’ subscript has been added to emphasize that ARo is the slope of Mw(t)/M1 as t approaches zero.
If IR(t) is non-linear then AR is still defined, but will be the instantaneous derivative of Mw with respect to t, and can be a function of time, denoted AR(t). AR(t) from SMSLS is related to kobs from PTIR by
| (11) |
Finally, if Mw,agg(t) changes rapidly with time then there will be no practically realizable linear regime for IR(t). Some mechanistic models predict that this will be the case, such as illustrated later in this report. The above analysis also shows that ARo=kobs holds strictly only if Mw,agg(t)=constant=2M1; i.e. when only dimers are formed and they do not grow. However, in practice the equivalence between ARo and kobs may extend to include other conditions, as illustrated below.
Mass-Action Kinetics for Nonnative Protein Aggregation in Solution
A simple and reasonably general mass-action model that incorporates the early stages in Figure 1 is the Lumry-Eyring Nucleated Polymerization (LENP) model that has been described and tested in detail elsewhere for globular proteins and monoclonal antibodies [10,12,22,40,41]. For the case where the smallest irreversible aggregate size is the dimer (x=2) and aggregate-aggregate coalescence is negligible, the following mass-action equations hold. All concentrations are dimensionless, and defined as m = cm/cm,0, aj = cj/(jcm,0) for j > 1, to be consistent with previous nomenclature.
| (12) |
| (13) |
| (14) |
In the above expressions, fR is the fraction of monomeric proteins that are partly or fully unfolded to make them “reactive” (R) with respect to non-native aggregation (cf., Introduction) and dimensionless concentrations are relative to a molar basis (as opposed to mass/vol. concentrations) since these expressions derive from mass-action kinetics. knuc is the rate coefficient (units of 1/time) for creating a stable dimer (j=2) from two R monomers, and kg is the average rate coefficient for growth of existing aggregates via addition of monomers. For simplicity, kg is treated as being independent of j. For dimensional consistency, both knuc and kg implicitly are proportional to cm,0 [42,43]. The corresponding equation for the rate of change of Mw is given by the weighted sum of Eq. 12–14, based on the definition of Mw [10,22],
| (15) |
where and τg =1/(kgfR) have been introduced as shorthand for consistency with previous reports [10,22], and M1 was defined above as the monomer molecular weight. τg and τn are, respectively, the characteristic time scales for growth by chain polymerization, and for nucleation (dimerization). One can equivalently replace the lumped coefficients in Eq. 12 and 13 with 1/τn and 1/τg, and the lumped coefficient in Eq. 14 with 1/τg.
The above expressions hold when all aggregates remain soluble during the course of an experiment, and aggregate-aggregate association or coalescence is negligible. In the opposite extreme, there is no general kinetic expression to replace Eq. 15, unless one assumes colloidal models for coalescence are valid for proteins [30]. One simple example is provided in the Appendix. While such models provide qualitatively reasonable descriptions, they often result in model parameters such as activation barriers for aggregate coalescence that are not physically realistic. That notwithstanding, if aggregate growth is very rapid compared to dimerization, and aggregates become insoluble at or above a threshold degree of polymerization (j = n*), then the precise details of the coalescence process are kinetically irrelevant from the perspective of monomer loss rates, and Eq. 12 simplifies greatly [26,42,43]. Experimentally, such kinetic behavior has been observed for monoclonal antibodies and model proteins [10–12,20,22,29,39]. However, historically it was not practical to predict or reliably quantify n* directly because of experimental limitations.
Results and Discussion
In what follows, analysis is primarily confined to the initial-rate regime, defined as monomer loss less than approximately 15 percent (either monomer mass or monomer mole basis). Light scattering versus incubation time cannot, on its own, indicate where the time range for the initial-rate regime lies for aggregation. Monomer loss rates from SEC provide that information, and in the present case that is known from previous PTIR measurements [33]. Therefore the results and discussion below combine SMSLS (at multiple simultaneous temperature conditions) with PTIR in a complementary fashion.
ND and CP mechanisms
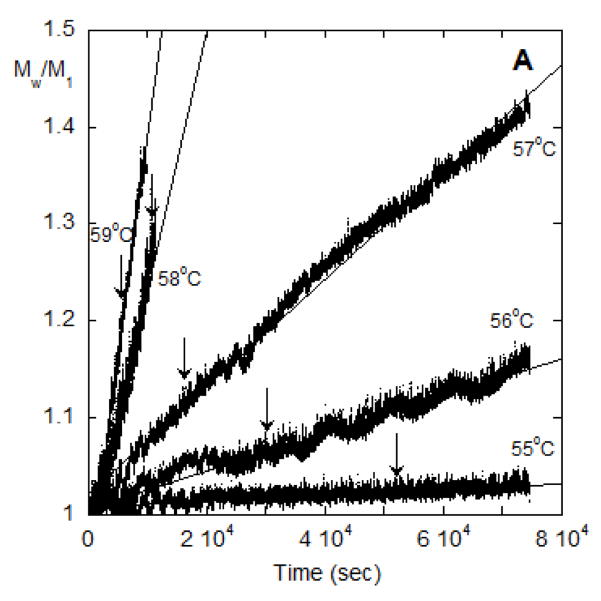
Temperature-dependent monomer loss rates for AS-IgG1 are shown in Figure 2 in terms of ln kobs vs. inverse temperature (T). The results for pH 4 are those for the ND mechanism where aggregate growth is very slow compared to nucleation (dimerization) for this protein. Illustrative data from SMSLS for the same solution conditions are shown in Figure 3A in terms of Mw/M1 versus t for a series of incubation temperatures (T). All time courses for monomer concentration from PTIR are linear in t due to the nature of the method, as confirmed previously [33]. The analysis summarized in Materials and Methods (Eqs. 8–10) indicates that if there is one dominant size for the aggregates, then Mw/M1 should be linear in t when monomer loss is linear in t. The vertical lines in Figure 3a denote the 15% monomer conversion limit from the PTIR data for each temperature. The supporting information illustrates an example where the LS data were obtained for extents of monomer consumption that are far beyond the initial-rates regime (Figure S1). The downward curvature (negative second derivative for Mw/M1 vs. t) in that example is consistent with the fact that monomer loss rates decrease as monomer is consumed outside the initial-rate regime.
Figure 2.
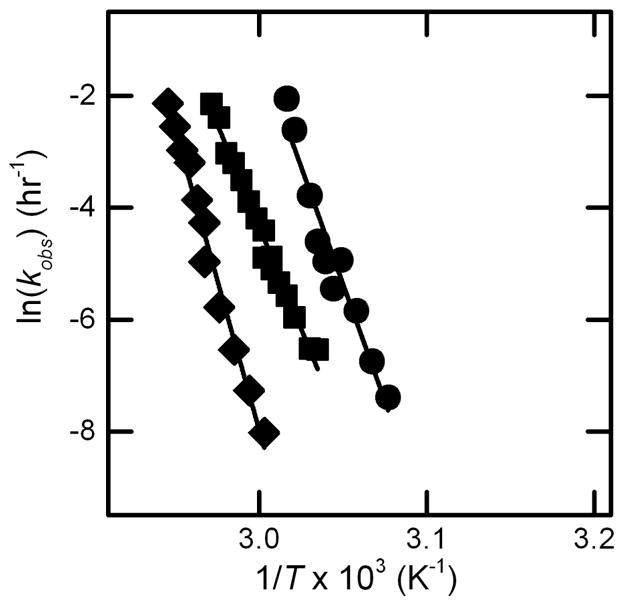
Arrhenius plot of ln kobs vs. inverse temperature from monomer loss measured with SEC using the PTIR method, for AS-IgG1 at pH 4 (circles), pH 5 (squares) and pH 6 (diamonds). All conditions were buffered with 5 mM citrate. All data are from Ref. [33].
Figure 3.
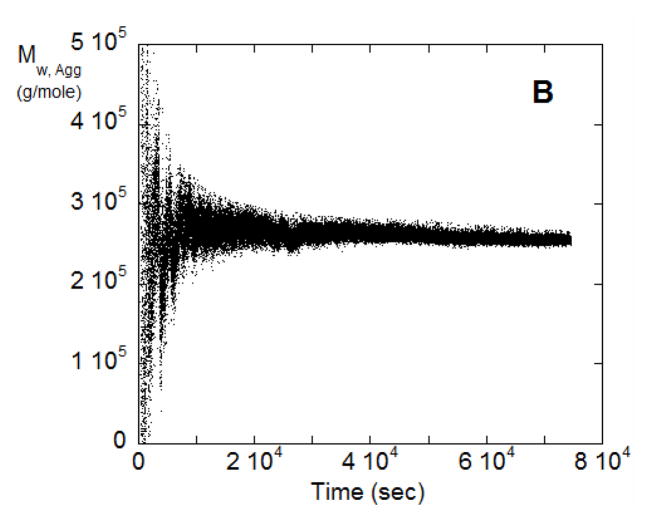
(A) SMSLS time courses for AS-IgG1 for pH 4, 5 mM sodium citrate, corresponding to ND aggregation behavior. Each profile corresponds to a different incubation temperature (labeled in the panel). The vertical arrows indicate the time points corresponding to 15% monomer loss at each temperature, based on PTIR results. (B) Weight average aggregate mass, Mw,agg(t), for the T=57 °C data from panel A.
If the assumption of a dominant aggregate size or species (e.g., dimer only) holds, then analyzing Mw/M1 vs. t in terms of Eq. 9 should result in an average aggregate molecular weight that is independent of t. Figure 3B shows the result of applying Eq. 9 to the data from Figure 3A for T = 57 °C, using the value for kobs from PTIR for that temperature. Similar results also hold for the other temperatures from Figure 3A (data not shown). The estimated aggregate molecular weight varies greatly at small t because the inherent noise in the scattering signal is exacerbated by dividing by small values of t in Eq. 9. The data at longer times clearly plateau at essentially a constant value (~ 2.6 × 10⁵ g/mole) in Figure 3B.
Qualitatively, the linear behavior of the SMSLS data vs time and the essentially constant value for the apparent molecular weight of the aggregates are consistent with the ND mechanism and previous work [12]. For SMSLS combined with PTIR, those two characteristic features allow one to unambiguously conclude the ND mechanism is operative for these solution conditions. A similar result was found for all temperatures that were tested with those solution conditions (data not shown). In this case, temperature does not alter the ND aggregation mechanism, although net aggregation rates are very sensitive to temperature (see below). The aggregate Mw value is approximately ten percent below that expected for a dimer based on the known value of the monomer molecular weight (1.422 × 10⁵ g/mol). This can be explained based on the fact that the solution conditions required for ND to be the dominant behavior are those that lead to strong protein-protein repulsions [12]. For example, based on the measured values of the static structure factor (or osmotic virial coefficient) for monomeric solutions of this antibody in these solution conditions [12], one would expect ~ 10 % underestimation of the true molecular weight, consistent with the Mw,agg value being approximately 10 % below the theoretical value of ~ 2.8 × 10⁵ g/mole.
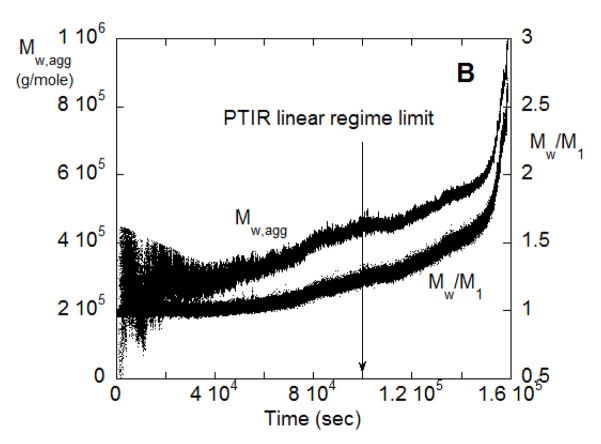
Temperature-dependent monomer loss rates for AS-IgG1 in Figure 2 for pH 5 are those for CP behavior, where aggregate growth is fast compared to nucleation (dimerization), but growth occurs predominantly via monomer addition rather than via coalescence of aggregates [12,33]. Figure 4A shows SMSLS results for this solution condition as a function of temperature, for t ranges that cover the initial-rate regime determined from PTIR. Vertical lines again demark the time for 15% monomer loss from PTIR. For some of the temperatures, Mw/M1 appears linear for much of the initial-rate regime, while for others (e.g., 60 °C) there is clear upward curvature within the initial-rate regime. Figure 4B shows the apparent aggregate molecular weight vs. t for 60 °C based on the t-dependent LS signal, combined with the value of kobs from PTIR and Eq. 9. It is clear that the apparent aggregate molecular weight is time dependent. The magnitude of Magg at later times is consistent with results from SEC-MALS on quenched samples, with aggregates including larger oligomers [12]. It is worth noting that Mw/M1 vs. t in the initial-rate regime cannot show downward curvature unless some form of aggregate dissociation or monomer fragmentation is occurring.
Figure 4.
(A) SMSLS time courses for AS-IgG1 for pH 5, 5 mM sodium citrate, corresponding to CP aggregation behavior. Each profile corresponds to a different incubation temperature (labeled in the panel). The vertical arrows indicate the time points corresponding to 15% monomer loss at each temperature, based on PTIR results. (B) Weight average aggregate mass, Mw,agg(t), for the T=60 °C data from panel A.
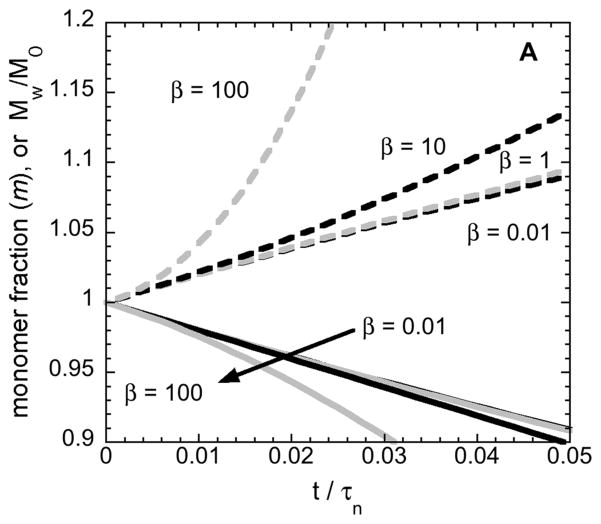
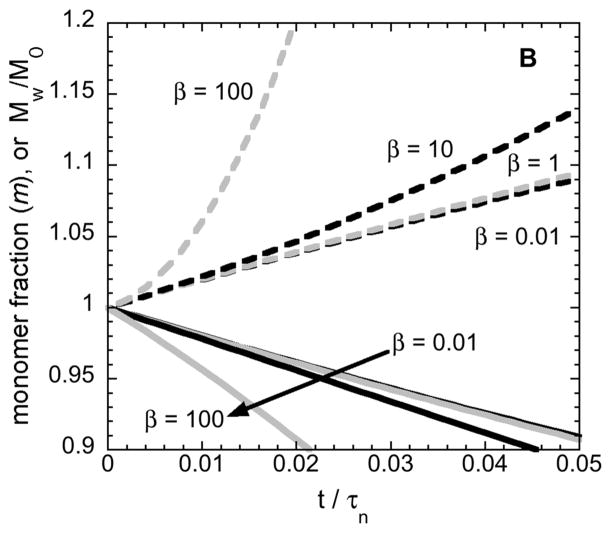
Figure 5 shows the results of simulated monomer-loss and Mw increases as a function of incubation time using Eq. 12–14. Using a non-dimensional time (t/τn) allows all solutions to Eq. 12–14 to be captured using only one kinetic parameter, β ≡ τn/τg, for a given choice of initial conditions and x=2. Small values of β correspond to conditions where growth is slow compared to nucleation, and aggregates do not grow appreciably as monomers are consumed to create/nucleate new aggregates. As such, Mw,agg will be effectively constant in that case; Mw must increase linearly with time, and this corresponds to the ND mechanism above and in previous work [11,12]. In contrast, large values of β correspond to cases where growth via monomer addition (or chain polymerization, CP) is fast compared to nucleation. Mw,agg is not constant, and Mw is expected to increase non-linearly with time.
Figure 5.
Simulated monomer loss (solid curves) and Mw/M1 (dashed curves) vs. dimensionless time from mass-action kinetics under ND and CP conditions. Small (large) values of β correspond to ND (CP) conditions, as shown in detail in ref. [42,43]. The condition with no aggregate seeds (panel A) is contrasted with that for 2% (by mass) seeds, such as the initial dimer in solution for ASA-IgG1 (panel B).
The results in Figure 5A show these expectations are borne out, provided that the initial condition is that there is only monomer in solution, or that one chooses large enough values of β. In practice, solely having monomer in solution at t=0 is rather difficult to realize for even highly purified protein solutions such as those in biopharmaceutical products. Most therapeutic protein products contain on the order of 0.1 to 2 % (by mass) of soluble dimer or small oligomer species that are detectable by SEC [8,11,15,32,44]. In the experimental examples explored above, the stock solution of AS-IgG1 contains ~ 2 % (by mass) dimer, and such soluble aggregates can act as so-called “seeds” to accelerate aggregation rates [1,5,45].
Figure 5B shows how the time-dependent monomer-loss and Mw profiles differ from panel A, when one initially has 2 % (by mass) soluble dimers in solution at t=0. In this case, both ND (low-β) and CP (high-β) conditions yield essentially linear profiles of monomer concentration and Mw versus time unless one considers very large values of β. Physically, this is expected because when there are no soluble aggregates present at t=0, nucleation dominates the early-time consumption of monomers until the aggregate concentration(s) become large enough for the right-most term in Eq. 12 to become significant. However, if enough aggregates are present at t=0, then the nucleation stage can essentially be “skipped” and monomer loss is primarily due to just addition of monomers to the existing aggregates. In some branches of the protein aggregation literature, this effect is termed “seeding” [1,7,46].
Furthermore, from a practical perspective if one added typical “noise” to the simulated Mw curves (e.g., plus/minus a few percent random error) then the apparent linearity of Mw vs. t holds to even higher beta values (not shown). Therefore, linearity in Mw vs. t (or AR being approximately constant) is not enough, on its own, to indicate that Magg should be constant, and therefore that AR and kobs should be equivalent if other effects can be neglected (see also, discussion below). However, if one does observe upward curvature for Mw(t) within the initial-rate regime determined from m(t) or cm(t) data such as from PTIR, then clearly the mechanism cannot be ND.
Mechanisms involving aggregate coalescence
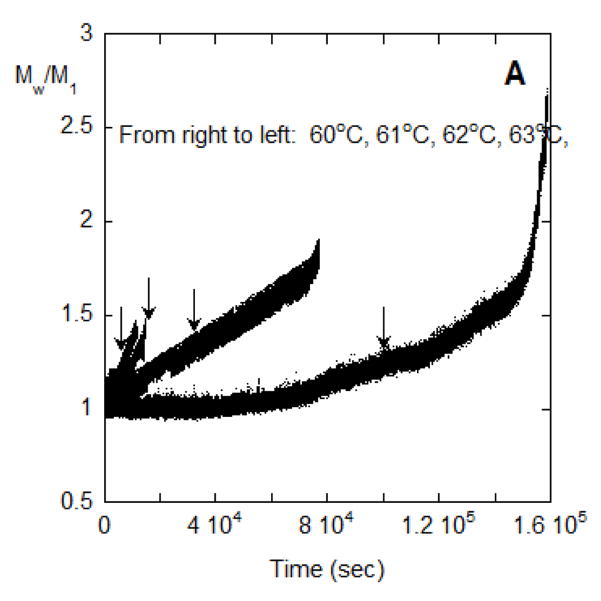
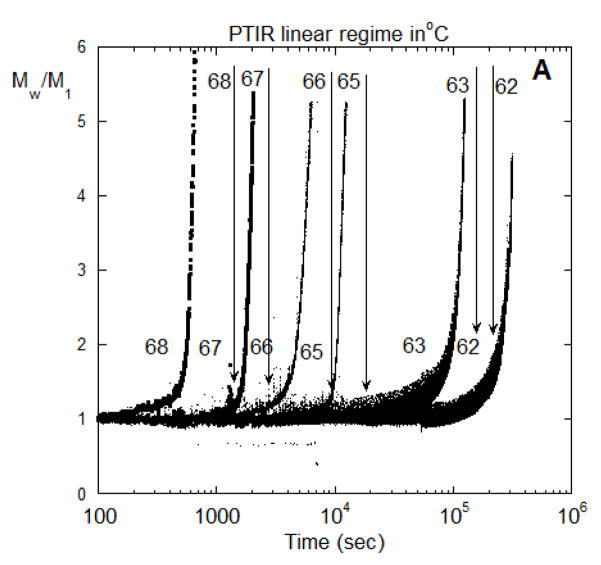
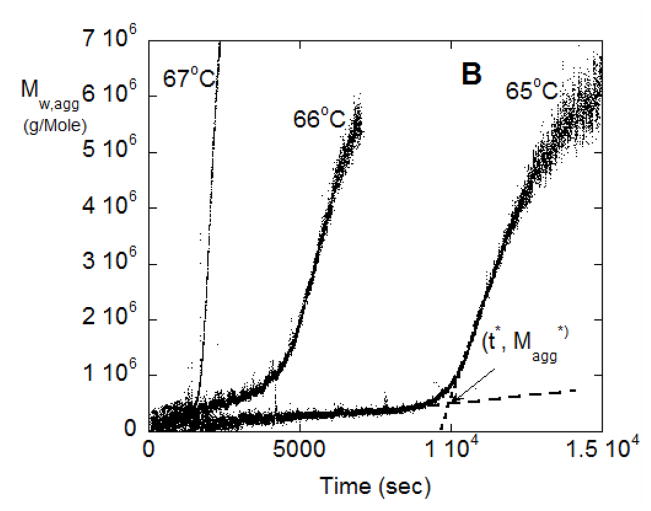
Turning to conditions with rapid aggregate growth by association or coalescence of aggregates, Figure 6A shows Mw/M1 vs time for 62, 63, 65, 66, 67, and 68 °C for conditions that correspond to rapid aggregate coalescence. Figure 6B shows Mw,agg(t) using the results of Figure 6A and the corresponding value of kobs from PTIR. The average aggregate mass reaches on the order of 106 to 107 g/mol on this time scale; e.g., at 9×10⁶ g/mole there are approximately 60 monomers per aggregate, on average. The appearance of an accelerated aggregation period (larger upturn in Figure 6A) is fairly abrupt and suggests that a different aggregation mechanism begins. This suggest, for example, that colloidal flocculation (aggregate-aggregate coalescence) becomes important, in addition to the earlier-stage process(es) involving unfolded MAb monomers dimerizing and possibly chain polymerizing. In prior work, this was modeled as a combination of CP and AP or PS mechanisms occurring in parallel [10,11,18,22].
Figure 6.
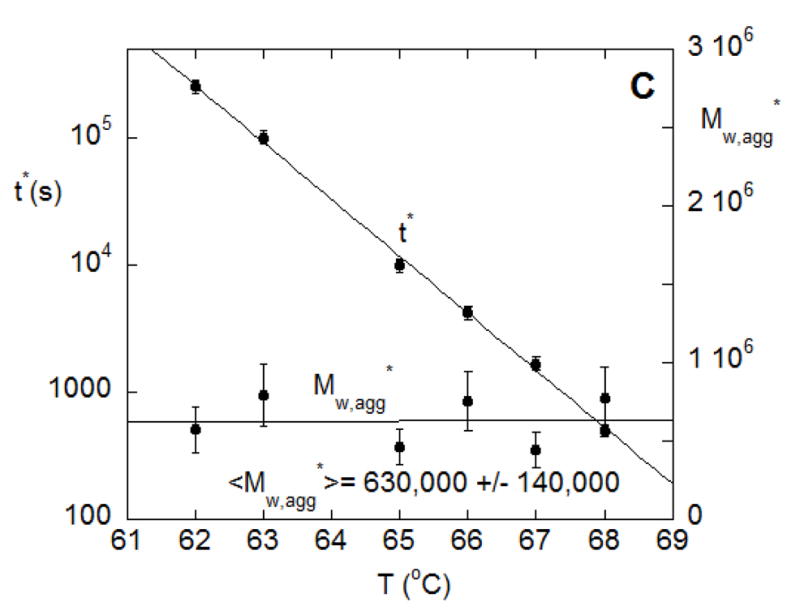
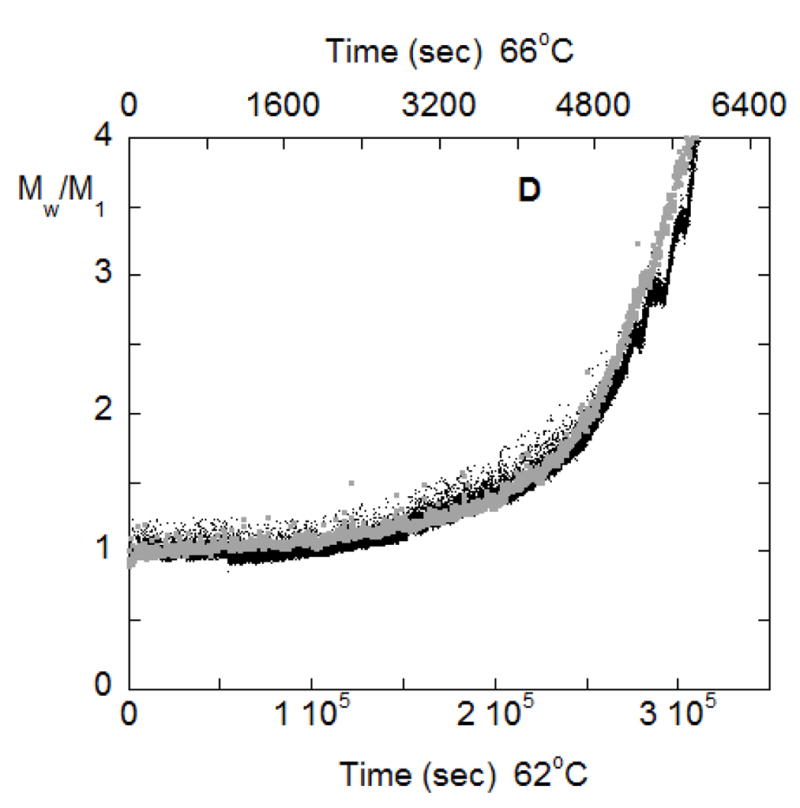
(A) SMSLS time courses for AS-IgG1 for pH 6, 5 mM sodium citrate, corresponding to PS aggregation behavior. Each profile corresponds to a different incubation temperature (labeled in the panel). The vertical lines show 15% monomer loss at each temperature, based on PTIR results. (B) Determination of t* and Magg* using the intercept from linear extrapolation in the slow and fast aggregation regimes (dashed lines). (C) The time at which rapid aggregation/flocculation begins, t*, and the value of the weight average aggregate mass at that time, Mw,agg(t*). (D) Time-dependent profiles of Mw/M1 for data panel A overlap when the time axes are scaled appropriately. Such a scaling is shown here for 62 °C and 66 °C.
From a theoretical perspective, it is natural for aggregation to involve multiple, parallel pathways, and for the rates of those pathways to shift as aggregation proceeds. Prior work showed that ND or CP aggregation mechanisms may be dominant at early stages of aggregation, prior to aggregate concentrations growing sufficiently large for aggregate-aggregate coalescence to become measureable [10–12]. In the extreme case, aggregates may reach a critical or threshold size, above which they coalesce so rapidly that thet effectively phase separate in a manner akin to colloidal flocculation [26]. The phase-separated aggregates do not consume monomers to a significant extent, and so do not contribute to kobs but clearly do affect the measured LS signal(s). With this in mind, the data in terms of Mw,agg vs. t in Figure 6B were analyzed by tracing lines from the slow and fast regions and taking their intercept, to find the threshold or critical time and aggregate mass, t* and Mw,agg*, respectively, at which the onset of much more rapid aggregate coalescence/flocculation occurs. These extrapolations can be seen for the 65 °C data from Figure 6A as the dashed lines in Figure 6B. Figure 6C shows Mw,agg* and t* from this analysis over the various temperatures.
It is striking that Mw,agg* values are fairly closely grouped at (6.3 ± 1.6) ×105 g/mole. As seen in Figure 6C they are also independent of temperature. This suggests that the onset of rapid aggregate-aggregate coalescence or colloidal aggregation/flocculation occurs at approximately tetramers (n*=4 in the nomenclature above). Such a threshold aggregate size (n*) was speculated upon or inferred from ex situ measurements for other proteins [11,18,39], but to the best of our knowledge this is the first time it has been directly observed in situ. It has been noted previously that there are many challenges with determining n* directly [11,18,39], and we anticipate that additional scattering techniques (e.g., small-angle x-rays or neutrons, dynamic light scattering) could be useful as other ways to confirm this result, and these will be pursued in future work.
Interestingly, t* displays an essentially Arrhenius behavior (albeit over a narrow temperature range), with an activation energy ~ 210 kcal/mol, in line with the values found below for AR and kobs. This highlights that the time-scale for aggregates to reach n* has an effective activation energy that is orders of magnitude larger than what is expected for colloidal aggregation – i.e. diffusion-limited or reaction-limited colloidal aggregation mechanisms have much weaker temperature dependences [30]. As discussed elsewhere [7,18,26], this is consistent with the time scales for creation and growth of small aggregates being greatly influenced by protein unfolding thermodynamics, and is also consistent with those early-stage steps being rate-limiting and ultimately the most important for determining the net rate of production of much larger aggregates when coalescence is much faster than the “upstream” steps of nucleation. That is, the rate of coalescence is so rapid once n* is reached, that in practice the value of t* is most important in determining the net rate of detection of large aggregates.
An interesting demonstration that the aggregation mechanism in both the early(slow) and late(rapid) stages are the same at the various temperatures from Figure 6A is shown in figure 6D, where the time scales for aggregation at T=62 °C is fifty times slower than at T=66 °C. By rescaling the T=62 °C time scale in figure 6A to match that for 66 °C it is seen that the time dependent aggregation profiles exactly overlap each other. This confirms the temperature-independent nature of the mechanisms of aggregation in this temperature range, even though the rates are very sensitive to changes in temperature.
Notice in the data in Figure 4 that the largest aggregate molecular weight values within the initial-rate regime are below the value of Mw,agg* estimated above. This may suggest that even though there may be different mechanisms at early times, once the putative tetrameric n* state is reached, rapid aggregate coalescence would begin to dominate. However, work elsewhere with this protein and these solution conditions shows that CP growth continues and PS does not occur if one considers incubation times outside of the initial-rate regime for the solution conditions and temperatures in Figure 4. This highlights that one cannot reliably extrapolate what the mechanism will be at longer times if one only has information on the initial-rate regime, as noted previously [7,23].
Arrhenius and Non-Arrhenius Behavior
Figure 7 shows Arrhenius diagrams for the temperature-depenent aggregation rates from both kobs and AR0. The Arrhenius plots based on ARo yield very high activation energies, in the range of 170–200 kcal/mol for ND, PS, and CP cases (cf., Figure 7A and 7B). The Arrhenius curves are reasonably parallel on the scale of the plots for AS-IgG1. Figure 7A compares rates for the ND, PS, and CP conditions for AS-IgG1 with four other monoclonal antibodies from prior work (although the mechanisms were not characterized for those antibodies in prior work: mAbA (considered a stable, developable mAb) [34]. The system denoted as mAbB was considered too unstable for development as a pharmaceutical product, while the one denoted as mAbC and a reference-material mAb from NIST had much slower net aggregation rates at a given temperature[34]. The slopes, and hence activation energies of ND, PS, and CP data sets for AS-IgG1 are significantly larger than all the other proteins. Prior work with AS-IgG1 has shown it aggregates through unfolding of the Fab region [11]. The effective activation enthalpy or energy for aggregation scales with the enthalpy of unfolding for the domain(s) involved in forming strong inter-protein contacts [23,26,47]. As such, one expects the Ea values in Figure 7 to be influenced by the domain(s) involved in aggregation. The Fab region typically has a much higher enthalpy of unfolding than the CH2 or CH3 domains of the Fc region of IgG1 proteins. The lower Ea values in Figure 7A for the proteins other than AS-IgG1 are also similar in magnitude to those for aggregation of the isolated human IgG1 Fc domain [17]. Therefore the data in Figure 7A are consistent with aggregation of AS-IgG1 via unfolding of the Fab domains, while the other proteins might be inferred to aggregate via unfolding of the Fc domain.
Figure 7.
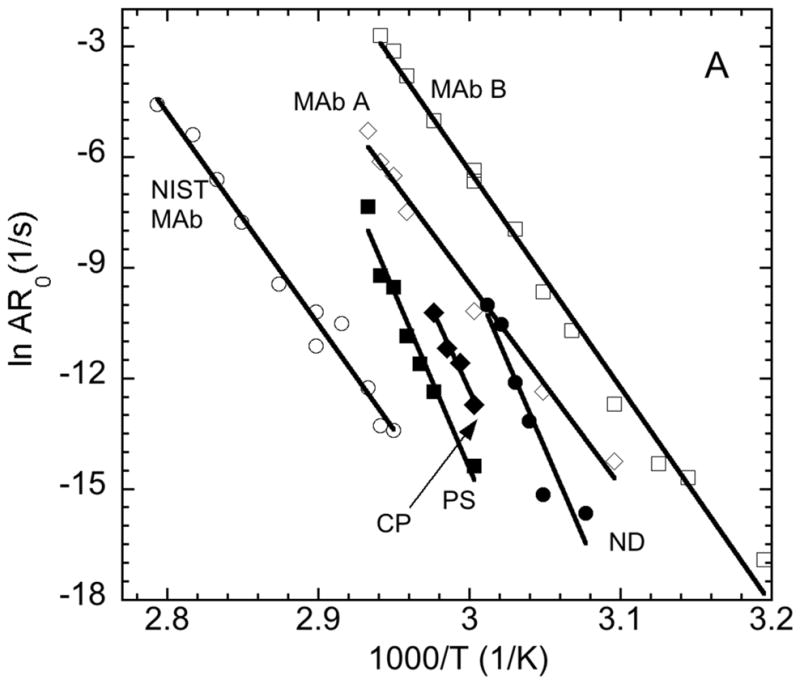
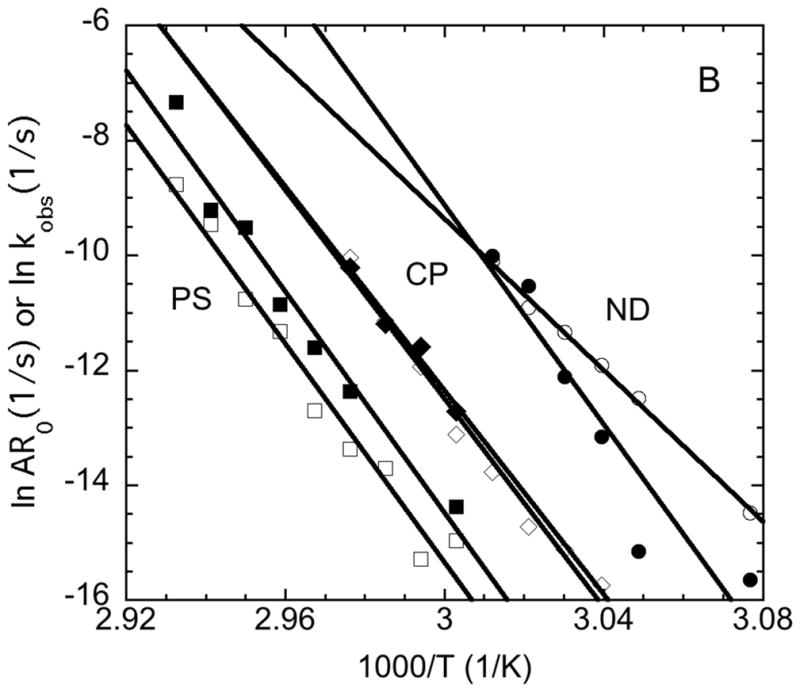
Arrhenius diagrams (A) comparing AR0 vs. inverse temperature for AS-IgG1 under ND, CP, and PS conditions versus previous data for three other monoclonal antibodies (see data labels and main text for details), and (B) comparing AR0 (closed symbols) vs. kobs (open symbols) for AS-IgG1 for ND (circles), CP (diamonds), and PS (squares) conditions.
Comparison of aggregation rates quantified by AR0 vs. kobs
As noted above, it is not expected that PTIR (kobs) and SMSLS (AR0) will necessarily give quantitatively equivalent rates. PTIR measures the monomer loss rate from a quenched sample using HPLC-based method, while SMSLS measures the time dependent rate of change of the weight-averaged molecular weight, assuming contributions to the LS signal from thermodynamic non-idealities can be neglected. Assuming aggregation is irreversible and quenching to lower temperature effectively halts the monomer loss aggregation mechanism, PTIR is expected to give the aggregation rate on the basis of mass conversion of monomer to aggregate. On the other hand, under certain growth conditions SMSLS will give an equivalent, or nearly equivalent value for the aggregation rate (see below).
Figure 7B shows a quantitative comparison of the rates from PTIR (i.e., kobs) and SMSLS (i.e., AR0) for AS-IgG1. The rates parallel one another versus temperature in most cases, but are quantitatively different in almost all cases. That is, the agreement in activation energies is reasonably good for most of the conditions, although less so for ND. It is not immediately clear why the Ea value from AR0 is so much different from that based on kobs in the ND case for AS-IgG1. AR0 is lower than kobs for most temperatures in the ND case, which contradicts the analysis in the Methods. However, the earlier analysis neglected contributions from strong electrostatic repulsions between proteins (in monomers and in aggregates). While the protein concentration is considered “low” under those conditions, the fact that aggregates do not grow significantly beyond dimers indicates that monomer-aggregate interactions are very strongly replusive for the solution conditions that yield ND behavior for AS-IgG1. It is speculated that this causes the rate of increase for Mw to be underestimated due to these strong non-idealities – that is, strongly repulsive conditions cause the structure factor to much less than 1, and this leads to an underestimate of Mw from Rayleigh scattering if the structure factor for strongly repulsive conditions is not corrected for [34,48]. Empirically, this effect appears to be magnified at lower temperatures, which causes AR0 and kobs to not parallel each other for ND conditions in Figure 8B.
The log scale of the y axis makes differences in AR0 and kobs more difficult to see by inspection for conditions other than ND in Figure 7B. Values for the ratio of AR0 to kobs are tabulated in Table 2. Inspection of Table 2 shows that AR0 greatly underestimates (overestimates) kobs for the ND (PS) conditions for AS-IgG1, and is in reasonable agrrement with kobs for the CP conditions tested here. As discussed next, this observation for PS conditions is not unexpected; however, this is not what would expect for the other conditions based on arguments that are presented next from mass-action models.
Table 2.
Ratio of AR0 to kobs from the data in Figure 7B. Values are shown for each of the cases (ND, CP, PS) as a function of incubation temperatures from Figures 3, 4, and 6.
| AR0/kobs | |||
|---|---|---|---|
| T (°C) | ND | CP | PS |
| 52 | 0.31 | ||
| 55 | 0.07 | ||
| 56 | 0.29 | ||
| 57 | 0.46 | ||
| 58 | 1.5 | ||
| 59 | 1.1 | ||
| 60 | 1.5 | 1.8 | |
| 61 | 1.4 | ||
| 62 | 0.95 | ||
| 63 | 0.84 | 2.7 | |
| 64 | 3.0 | ||
| 65 | 1.6 | ||
| 66 | 3.4 | ||
| 67 | 1.3 | ||
| 68 | 4.1 | ||
The Appendix shows that if one uses mass-action kinetics such as the LENP model used for Figure 5, then one expects that AR0 and kobs should agree semi-quantitatively for a number conditions. Table 1 summarizes the results for conditions corresponding to ND, CP, and PS (or very rapid AP growth) mechanisms. Briefly, the results in the Appendix show that AR0 and kobs should be quantitatively equivalent when aggregates do not grow significantly. AR will also be constant in the initial-rate regime if aggregates grow significantly through monomer addition to existing aggregates (seeds), however, AR0 will overestimate kobs by a factor of approximately 2. When AR is significantly non-linear in the initial-rates regime then one expects to AR0 to overestimate kobs based on the fact that it is biased towards the signal provided by larger species compared to monomers. In that vein, it is intuitive that AR and kobs will not agree under PS or rapid AP conditions since the LS signal will be dominated by the much larger species. However, if one can quantify t* in the manner shown in Figure 6C, then the use of that “slow” regime for SMSLS is expected to give a better measure of kobs for conditions where aggregate coalescence is a dominant growth mechanism.
Table 1.
Ideal ratio for AR0/kobs based on mass-action kinetics for different qualitative aggregation mechanisms, assuming negligible contributions to AR0 from solution non-idealities.
| Qualitative Mechanism | Dominated by Seeding? | AR0/kobs |
|---|---|---|
| ND | n/a(d) | ~ 1(a) |
| CP | Yes | ~ 2–2.5 |
| CP | No | ≫ 1(b) |
| PS/AP | n/a(d) | ≫ 1(c) |
neglecting non-idealities in LS
if fast growth by CP, then AR should be nonlinear over the initial rate regime when seeding is negligible
dependent upon whether one can practically identify a time regime before rapid onset of flocculation
n/a = not applicable
The results in Table 2 clearly show that AR0/kobs is significantly less than 2 for CP conditions with AS-IgG1, and greatly below 1 for ND conditions in many cases. This is counter to the predictions from the analysis in Table 2 and the Appendix. While the available data do not provide a definitive answer to this apparent contradiction, one explanation is that there are strong repulsive interactions between monomers and aggregates, and between aggregates and aggregates, under conditions that result in ND and CP aggregation behavior [33]. Strong repulsions result in so-called structure-factor effects that cause the measured LS signal to underestimate the true Mw value [36]. In the present case, it is not the absolute value of Mw that is of concern, but rather that rate at which Mw increases. As the system aggregates, it changes from a predominantly monomer population to one composed of monomers and a distribution of aggregate species. Prior work indicates that monomer-aggregate and aggregate-aggregate repulsions are much stronger than the monomer-monomer repulsive interactions at the conditions for AS-IgG1 [33]. As such, it is possible that the increase in LS signal over time will be increasingly influenced by repulsive structure-factor effects as aggregation proceeds, and this would cause the true Mw to be increasingly underestimated as aggregation proceeded within the initial-rates regime for ND and CP cases. If that holds, then the analysis in the Appendix and the Methods is oversimplified and needs to be amended to include the effects of repulsive protein interactions. The present results suggest that may be a lucrative avenue to pursue in future, but was beyond the scope of the present work, as doing so would require one to repeat all of the experiments in the present work over a range of protein concentrations.
Summary and Conclusions
Two recently developed methods (SMSLS and PTIR) for quantifying aggregation rates as a function of temperature and/or solution conditions were compared qualitatively and quantitatively over a range of temperatures and solution pH that were known [12] to alter the dominant aggregation mechanisms for an AS-IgG1 antibody. The results illustrate approaches for combining SMSLS and PTIR to provide complementary information and to elucidate aggregation mechanisms across a range of conditions. They also show that the two methods agree qualitatively with regards to changes in aggregation rates. However, the two methods are not expected to provide quantitatively equivalent aggregation rates, and instead are arguably most effective when used in tandem. When comparing AR0 and kobs quantitatively, based on mechanistic aggregation models, AR0 is expected to provide a conservative bound (i.e,. upper bound) on aggregation rates compared to kobs unless there are large thermodynamic non-idealities that cause so-called structure-factor effects that make Mw from SLS greatly different from the true Mw for the sample (see above). While this means that AR0 will not always be quantitatively accurate for determining the percent mass conversion (per unit time) as a measure of aggregation rate, it can provide a convenient means to estimate quantities such as product shelf life because it overestimates (underestimates) rates (shelf life) based on mass conversion rate, so long as protein-protein interactions do not greatly convolute the measurement of Mw from SMSLS. This is potentially convenient in a number of applications where shelf-life assessment is an important part of product development. Future theoretical work may need to address the issue of structure-factor effects if one is to use AR0 as an independent measure of protein shelf life when protein-protein interactions are expected to be a dominant effect – e.g., conditions with strong electrostatic repulsions and/or high protein concentrations.
Supplementary Material
57C data with the initial portion fit to a straight line, to illustrate that for ND conditions one expect downward curvature in IR vs time if one monitors beyond the initial-rate regime.
Acknowledgments
Support from Amgen, the National Science Foundation (CBET-1264329), the National Institute of Standards and Technology (NIST-70NANB12H239), the National Institutes of Health (R01 EB006006), BITC, and Advanced Polymer Monitoring Technologies, Inc. is gratefully acknowledged.
APPENDIX
A simple but reasonably general expression from the LENP model for the time derivative of the weight average molecular weight of the overall size distribution (Mwtot) is [10,22]:
| (A1) |
where the shorthand m = cm/cm,0 has been used. Eq. A1 holds when one uses a size-independent aggregation rate coefficient matrix for aggregate-aggregate coalescence (hence a single value for the characteristic time scale for coalescence, τc). The conclusions below do not change if one uses a size-dependent matrix such as suggested by colloidal aggregation models. Next, one takes the limit of t approaching zero, and uses
| (A2) |
where [Aj] denotes the molar concentration of a j-mer, and the zero subscript denotes t=0. Then AR0 follows from Eq. A1 in the limit t→0,
| (A3) |
From Eq. A2 it follows that 1−m0 is the fraction of protein mass that exists at aggregates (i.e., seeds) at t=0. If we denote the concentration (mass/vol.) of aggregates at t=0 as cagg,0, then m0=cagg,0/c0, where c0 is the total protein concentration(mass/vol.) including both monomer and aggregates at t=0. If all aggregates at t=0 are dimers, σ0 = cagg,0/2c0, and Eq. A3 becomes
| (A4) |
For the case of x=2 (dimers as the smallest irreversible aggregate), Eq. A4 is
| (A5) |
This can be compared to the value of kobs = (m0−m)/t in the initial-rates regime, which using a similar analysis as that above, can be written as
| (A6) |
For the case of x=2, and assuming dimers are the only aggregates present at t=0, this reduces to
| (A7) |
If larger aggregates are present at t=0, then it may not be realistic to reliably know the value for the summation in Eq. A6, and then Eq. 7 would have an additional unknown parameter that makes it differ from Eq. 5 to an even greater degree.
Comparison of Eq. A5 and A7 shows that, rigorously, AR0 and kobs are only quantitatively equivalent in the case of purely unseeded conditions. Furthermore, it has been shown elsewhere [49] that in those conditions there is no practically accessible linear regime for m vs. t as t approaches zero if τn is multiple orders of magnitude larger than τg. Therefore, Eq. A7 does not hold in those conditions. The net result is that AR0 and kobs are formally equivalent only when there are no seeds present and aggregate growth is not much faster than nucleation (dimerization). This is equivalent to ND conditions or CP conditions where aggregates do not grow very large (τn/τg less than approximately 100). This is similar to the conclusion that was reached from simply considering the time dependence of Mw,agg(t), except that it helps to justify why CP conditions for ASA-IgG1 gave similar results for AR0 and kobs. That is, prior work showed that although growth is via chain polymerization for AS-IgG1 under these solution conditions, the aggregates only reach Mw values on the order of 10 – 15 times that of the monomer when all monomer has been consumed [12]. Based on theoretical considerations, τn/τg is only of the order of 10–20 for chain polymerization with nucleation via dimer in that case [42].
Comparison of Eq. A5 and A7 also shows that if condensation is a dominant mechanism of aggregate growth (i.e., τc ≪ τn and τg), which is the case of a PS dominated mechanism, then AR0 will greatly overestimate kobs. Alternatively, in the limit of negligible aggregate condensation, but appreciable dimer (seeds) conccntration at t=0, Eq. A5 and A7 show that AR0 and kobs will be similar but differ by a factor of 2.5 in the limit that
| (A8) |
If the seeds are much larger than dimers, then the value of σ0 will be even smaller than cagg,0/2c0, and the prefactor will change from 2.5 to a number closer to 2 in Eq. A5.
Therefore, in general AR0 can be expected to place an upper bound on kobs, and in certain limiting cases it will also be a semi-quantitative surrogate for kobs or will be quantitatively equivalent.
Footnotes
Publisher's Disclaimer: This is a PDF file of an unedited manuscript that has been accepted for publication. As a service to our customers we are providing this early version of the manuscript. The manuscript will undergo copyediting, typesetting, and review of the resulting proof before it is published in its final citable form. Please note that during the production process errors may be discovered which could affect the content, and all legal disclaimers that apply to the journal pertain.
References
- 1.Dobson CM. Principles of protein folding, misfolding and aggregation. Semin Cell Dev Biol. 2004;15:3–16. doi: 10.1016/j.semcdb.2003.12.008. [DOI] [PubMed] [Google Scholar]
- 2.Reichert JM. Antibodies to watch in 2016. mAbs. 2015;0:1–8. doi: 10.1080/19420862.2015.1125583. [DOI] [PMC free article] [PubMed] [Google Scholar]
- 3.Wang W, Singh S, Zeng DL, King K, Nema S. Antibody structure, instability, and formulation. J Pharm Sci. 2007;96:1–26. doi: 10.1002/jps.20727. [DOI] [PubMed] [Google Scholar]
- 4.Wang W, Roberts CJ, editors. Aggregation of Therapeutic Proteins. John Wiley & Sons, Inc; 2010. [Google Scholar]
- 5.Fink AL. Protein aggregation: folding aggregates, inclusion bodies and amyloid. Fold Des. 1998;3:R9–23. doi: 10.1016/S1359-0278(98)00002-9. [DOI] [PubMed] [Google Scholar]
- 6.Roberts CJ. Therapeutic protein aggregation: mechanisms, design, and control. Trends Biotechnol. 2014;32:372–380. doi: 10.1016/j.tibtech.2014.05.005. [DOI] [PMC free article] [PubMed] [Google Scholar]
- 7.Roberts CJ. Non-native protein aggregation kinetics. Biotechnol Bioeng. 2007;98:927–938. doi: 10.1002/bit.21627. [DOI] [PubMed] [Google Scholar]
- 8.Arosio P, Rima S, Morbidelli M. Aggregation Mechanism of an IgG2 and two IgG1 Monoclonal Antibodies at low pH: From Oligomers to Larger Aggregates. Pharm Res. 2013;30:641–654. doi: 10.1007/s11095-012-0885-3. [DOI] [PubMed] [Google Scholar]
- 9.Bajaj H, Sharma VK, Badkar A, Zeng D, Nema S, Kalonia DS. Protein Structural Conformation and Not Second Virial Coefficient Relates to Long-Term Irreversible Aggregation of a Monoclonal Antibody and Ovalbumin in Solution. Pharm Res. 2006;23:1382–1394. doi: 10.1007/s11095-006-0018-y. [DOI] [PubMed] [Google Scholar]
- 10.Brummitt RK, Nesta DP, Chang L, Kroetsch AM, Roberts CJ. Nonnative aggregation of an IgG1 antibody in acidic conditions, part 2: nucleation and growth kinetics with competing growth mechanisms. J Pharm Sci. 2011;100:2104–2119. doi: 10.1002/jps.22447. [DOI] [PubMed] [Google Scholar]
- 11.Kim N, Remmele RL, Jr, Liu D, Razinkov VI, Fernandez EJ, Roberts CJ. Aggregation of anti-streptavidin immunoglobulin gamma-1 involves Fab unfolding and competing growth pathways mediated by pH and salt concentration. Biophys Chem. 2013;172:26–36. doi: 10.1016/j.bpc.2012.12.004. [DOI] [PubMed] [Google Scholar]
- 12.Barnett GV, Razinkov VI, Kerwin BA, Laue TM, Woodka AH, Butler PD, Perevozchikova T, Roberts CJ. Specific-Ion Effects on the Aggregation Mechanisms and Protein–Protein Interactions for Anti-streptavidin Immunoglobulin Gamma-1. J Phys Chem B. 2015;119:5793–5804. doi: 10.1021/acs.jpcb.5b01881. [DOI] [PubMed] [Google Scholar]
- 13.Banks DD, Latypov RF, Ketchem RR, Woodard J, Scavezze JL, Siska CC, Razinkov VI. Native-state solubility and transfer free energy as predictive tools for selecting excipients to include in protein formulation development studies. J Pharm Sci. 2012;101:2720–2732. doi: 10.1002/jps.23219. [DOI] [PubMed] [Google Scholar]
- 14.Hari SB, Lau H, Razinkov VI, Chen S, Latypov RF. Acid-Induced Aggregation of Human Monoclonal IgG1 and IgG2: Molecular Mechanism and the Effect of Solution Composition. Biochemistry (Mosc) 2010;49:9328–9338. doi: 10.1021/bi100841u. [DOI] [PubMed] [Google Scholar]
- 15.Andersen CB, Manno M, Rischel C, Thorolfsson M, Martorana V. Aggregation of a multidomain protein: A coagulation mechanism governs aggregation of a model IgG1 antibody under weak thermal stress. Protein Sci. 2010;19:279–290. doi: 10.1002/pro.309. [DOI] [PMC free article] [PubMed] [Google Scholar]
- 16.Latypov RF, Hogan S, Lau H, Gadgil H, Liu D. Elucidation of Acid-induced Unfolding and Aggregation of Human Immunoglobulin IgG1 and IgG2 Fc. J Biol Chem. 2011;287:1381–1396. doi: 10.1074/jbc.M111.297697. [DOI] [PMC free article] [PubMed] [Google Scholar]
- 17.Wu H, Truncali K, Ritchie J, Kroe-Barrett R, Singh S, Robinson AS, Roberts CJ. Weak protein interactions and pH- and temperature-dependent aggregation of human Fc1. mAbs. 2015;0:1–12. doi: 10.1080/19420862.2015.1079678. [DOI] [PMC free article] [PubMed] [Google Scholar]
- 18.Roberts CJ, Darrington RT, Whitley MB. Irreversible aggregation of recombinant bovine granulocyte-colony stimulating factor (bG-CSF) and implications for predicting protein shelf life. J Pharm Sci. 2003;92:1095–1111. doi: 10.1002/jps.10377. [DOI] [PubMed] [Google Scholar]
- 19.Thirumangalathu R, Krishnan S, Brems DN, Randolph TW, Carpenter JF. Effects of pH, temperature, and sucrose on benzyl alcohol-induced aggregation of recombinant human granulocyte colony stimulating factor. J Pharm Sci. 2006;95:1480–1497. doi: 10.1002/jps.20619. [DOI] [PubMed] [Google Scholar]
- 20.Rosa M, Lopes C, Melo EP, Singh SK, Geraldes V, Rodrigues MA. Measuring and Modeling Hemoglobin Aggregation below the Freezing Temperature. J Phys Chem B. 2013;117:8939–8946. doi: 10.1021/jp4035369. [DOI] [PubMed] [Google Scholar]
- 21.Kosinski-Collins MS, King J. In vitro unfolding, refolding, and polymerization of human gammaD crystallin, a protein involved in cataract formation. Protein Sci. 2003;12:480–90. doi: 10.1110/ps.0225503. [DOI] [PMC free article] [PubMed] [Google Scholar]
- 22.Li Y, Ogunnaike BA, Roberts CJ. Multi-variate approach to global protein aggregation behavior and kinetics: Effects of pH, NaCl, and temperature for α-chymotrypsinogen A. J Pharm Sci. 2010;99:645–662. doi: 10.1002/jps.21869. [DOI] [PubMed] [Google Scholar]
- 23.Roberts CJ, Das TK, Sahin E. Predicting solution aggregation rates for therapeutic proteins: approaches and challenges. Int J Pharm. 2011;418:318–333. doi: 10.1016/j.ijpharm.2011.03.064. [DOI] [PubMed] [Google Scholar]
- 24.Caflisch A. Computational models for the prediction of polypeptide aggregation propensity. Curr Opin Chem Biol. 2006;10:437–444. doi: 10.1016/j.cbpa.2006.07.009. [DOI] [PubMed] [Google Scholar]
- 25.Agrawal NJ, Kumar S, Wang X, Helk B, Singh SK, Trout BL. Aggregation in protein-based biotherapeutics: Computational studies and tools to identify aggregation-prone regions. J Pharm Sci. 2011;100:5081–5095. doi: 10.1002/jps.22705. [DOI] [PubMed] [Google Scholar]
- 26.Roberts CJ. Kinetics of Irreversible Protein Aggregation: Analysis of Extended Lumry-Eyring Models and Implications for Predicting Protein Shelf Life. J Phys Chem B. 2003;107:1194–1207. doi: 10.1021/jp026827s. [DOI] [Google Scholar]
- 27.Saluja A, Sadineni V, Mungikar A, Nashine V, Kroetsch A, Dahlheim C, Rao VM. Significance of Unfolding Thermodynamics for Predicting Aggregation Kinetics: A Case Study on High Concentration Solutions of a Multi-Domain Protein. Pharm Res. 2014 doi: 10.1007/s11095-013-1263-5. [DOI] [PubMed] [Google Scholar]
- 28.Arosio P, Jaquet B, Wu H, Morbidelli M. On the role of salt type and concentration on the stability behavior of a monoclonal antibody solution. Biophys Chem. 2012;168–169:19–27. doi: 10.1016/j.bpc.2012.05.004. [DOI] [PubMed] [Google Scholar]
- 29.Sahin E, Grillo AO, Perkins MD, Roberts CJ. Comparative effects of pH and ionic strength on protein-protein interactions, unfolding, and aggregation for IgG1 antibodies. J Pharm Sci. 2010;99:4830–4848. doi: 10.1002/jps.22198. [DOI] [PubMed] [Google Scholar]
- 30.Arosio P, Rima S, Lattuada M, Morbidelli M. Population balance modeling of antibodies aggregation kinetics. J Phys Chem B. 2012;116:7066–7075. doi: 10.1021/jp301091n. [DOI] [PubMed] [Google Scholar]
- 31.Sahin E, Weiss WF, Kroetsch AM, King KR, Kessler RK, Das TK, Roberts CJ. Aggregation and pH-temperature phase behavior for aggregates of an IgG2 antibody. J Pharm Sci. 2012:n/a–n/a. doi: 10.1002/jps.23056. [DOI] [PubMed] [Google Scholar]
- 32.Brummitt RK, Nesta DP, Chang L, Chase SF, Laue TM, Roberts CJ. Nonnative aggregation of an IgG1 antibody in acidic conditions: part 1. Unfolding, colloidal interactions, and formation of high-molecular-weight aggregates. J Pharm Sci. 2011;100:2087–2103. doi: 10.1002/jps.22448. [DOI] [PubMed] [Google Scholar]
- 33.Barnett GV, Razinkov VI, Kerwin BA, Hillsley A, Roberts CJ. Acetate- and Citrate-Specific Ion Effects on Unfolding and Temperature-Dependent Aggregation Rates of Anti-Streptavidin IgG1. J Pharm Sci. doi: 10.1016/j.xphs.2015.12.017. (in press) [DOI] [PubMed] [Google Scholar]
- 34.Drenski MF, Brader ML, Alston RW, Reed WF. Monitoring protein aggregation kinetics with simultaneous multiple sample light scattering. Anal Biochem. 2013;437:185–197. doi: 10.1016/j.ab.2013.02.014. [DOI] [PubMed] [Google Scholar]
- 35.Laidler KJ. Chemical Kinetics. 2. McGraw; 1965. [Google Scholar]
- 36.Stockmayer WH. Light scattering in multicomponent systems. J Chem Phys. 1950;18:58–61. doi: 10.1063/1.1747457. [DOI] [Google Scholar]
- 37.Sahin E, Roberts CJ. Size-exclusion chromatography with multi-angle light scattering for elucidating protein aggregation mechanisms. Methods Mol Biol. 2012;899:403–23. doi: 10.1007/978-1-61779-921-1_25. [DOI] [PubMed] [Google Scholar]
- 38.Kayser V, Chennamsetty N, Voynov V, Helk B, Forrer K, Trout BL. Evaluation of a non-arrhenius model for therapeutic monoclonal antibody aggregation. J Pharm Sci. 2011;100:2526–2542. doi: 10.1002/jps.22493. [DOI] [PubMed] [Google Scholar]
- 39.Arora I, Bansal R, Joshi V, Rathore AS. Aggregation Kinetics for Monoclonal Antibody Products. Inter J Chem Eng Appl. 2014;5:433–438. [Google Scholar]
- 40.Andrews JM, Roberts CJ. Non-Native Aggregation of α-Chymotrypsinogen Occurs through Nucleation and Growth with Competing Nucleus Sizes and Negative Activation Energies†. Biochemistry (Mosc) 2007;46:7558–7571. doi: 10.1021/bi700296f. [DOI] [PubMed] [Google Scholar]
- 41.Weiss WF, IV, Hodgdon TK, Kaler EW, Lenhoff AM, Roberts CJ. Nonnative protein polymers: structure, morphology, and relation to nucleation and growth. Biophys J. 2007;93:4392–4403. doi: 10.1529/biophysj.107.112102. [DOI] [PMC free article] [PubMed] [Google Scholar]
- 42.Andrews JM, Roberts CJ. A Lumry-Eyring nucleated polymerization model of protein aggregation kinetics: 1. Aggregation with pre-equilibrated unfolding. J Phys Chem B. 2007b Jul 12;111:7897–913. doi: 10.1021/jp070212j. [DOI] [PubMed] [Google Scholar]
- 43.Li Y, Roberts CJ. Lumry–Eyring Nucleated-Polymerization Model of Protein Aggregation Kinetics. 2. Competing Growth via Condensation and Chain Polymerization. J Phys Chem B. 2009;113:7020–7032. doi: 10.1021/jp8083088. [DOI] [PMC free article] [PubMed] [Google Scholar]
- 44.Wu H, Kroe-Barrett H, Singh S, Robinson AS, Roberts CJ. Competing Aggregation Pathways for Monoclonal Antibodies. FEBS Lett. doi: 10.1016/j.febslet.2014.01.051. (in press) [DOI] [PubMed] [Google Scholar]
- 45.Amin S, Barnett GV, Pathak JA, Roberts CJ, Sarangapani PS. Protein aggregation, particle formation, characterization & rheology. Curr Opin Colloid Interface Sci. 2014;19:438–449. doi: 10.1016/j.cocis.2014.10.002. [DOI] [Google Scholar]
- 46.Uversky VN, Fink AL. Conformational constraints for amyloid fibrillation: the importance of being unfolded. Biochim Biophys Acta Proteins Proteomics. 2004;1698:131–153. doi: 10.1016/j.bbapap.2003.12.008. [DOI] [PubMed] [Google Scholar]
- 47.Weiss WF, 4th, Young TM, Roberts CJ. Principles, approaches, and challenges for predicting protein aggregation rates and shelf life. J Pharm Sci. 2009;98:1246–1277. doi: 10.1002/jps.21521. [DOI] [PubMed] [Google Scholar]
- 48.Blanco MA, Perevozchikova T, Martorana V, Manno M, Roberts CJ. Protein-Protein Interactions in Dilute to Concentrated Solutions: α-Chymotrypsinogen in Acidic Conditions. J Phys Chem B. 2014;118:5817–5831. doi: 10.1021/jp412301h. [DOI] [PMC free article] [PubMed] [Google Scholar]
- 49.Ferrone F. Analysis of protein aggregation kinetics. Methods Enzymol. 1999;309:256–274. doi: 10.1016/s0076-6879(99)09019-9. [DOI] [PubMed] [Google Scholar]
Associated Data
This section collects any data citations, data availability statements, or supplementary materials included in this article.
Supplementary Materials
57C data with the initial portion fit to a straight line, to illustrate that for ND conditions one expect downward curvature in IR vs time if one monitors beyond the initial-rate regime.


