

Abstract
The single subunit T7 RNA polymerase (T7RNAP) is a model enzyme for studying the transcription process and for various biochemical and biophysical studies. Heparin is a commonly used inhibitor against T7RNAP and other RNA polymerases. However, exact interaction between heparin and T7RNAP is still not completely understood. In this work, we analyzed the binding pattern of heparin by docking heparin and few of its low molecular weight derivatives to T7RNAP, which helps in better understanding of T7RNAP inhibition mechanism. The efficiency of the compounds was calculated by docking the selected compounds and post-docking molecular mechanics/generalized Born surface area analysis. Evaluation of the simulation trajectories and binding free energies of the complexes after simulation showed enoxaparin to be the best among low molecular weight heparins. Binding free energy analysis revealed that van der Waals interactions and polar solvation energy provided the substantial driving force for the binding process. Furthermore, per-residue free energy decomposition analysis revealed that the residues Asp 471, Asp 506, Asp 537, Tyr 571, Met 635, Asp 653, Pro 780, and Asp 812 are important for heparin interaction. Apart from these residues, most favorable contribution in all the three complexes came from Asp 506, Tyr 571, Met 635, Glu 652, and Asp 653, which can be essential for binding of heparin-like structures with T7RNAP. The results obtained from this study will be valuable for the future rational design of novel and potent inhibitors against T7RNAP and related proteins.
Keywords: T7RNAP, heparin, docking, MM-GBSA, molecular dynamics simulation, MM-PBSA
Introduction
In the central dogma of molecular biology, transcription is a fundamental process in which RNA will be synthesized by RNA polymerases on DNA templates. Understanding the mechanism of action of RNA polymerase will further enhance our understanding toward the knowledge of gene expression. The RNA polymerase of T7 bacteriophage is a commonly used target for the studies on many aspects of transcription because of its high and specific processivity with a single subunit structure.1 It can be used to produce bulk amounts of specific RNAs by simply transcribing DNA that has been joined to a promoter for T7 RNA polymerase (T7RNAP). Such RNAs could also be useful as hybridization probes, mRNAs for in vitro translation, substrates for analyzing the processing reactions or RNA splicing, or for any purpose requiring a specific RNA.2 Apart from the use in selective high-level expression of cloned genes, T7 RNAP serves as a template for multiple purposes such as detecting the effects of chemically induced DNA lesions,3 creating synthetic gene circuits,4 and RNA editing.5
T7RNAP is a 99 kDa single polypeptide DNA-dependent RNA polymerase, which catalyzes the formation of RNA in 5′-3′ direction. T7RNAP is structurally related to the members of a super family of nucleotide polymerases such as Escherichia coli DNAP I and reverse transcriptase. Similar to other nucleic acid polymerase structures, T7RNA polymerase domain looks like an open right hand, where it has the finger, palm, and thumb subdomains. The structure of T7RNAP comprises N-terminal domain [1–325], thumb subdomain [326–411], the palm subdomain [412–553 and 785–879], the fingers [554–784], and C-terminal end [880–883]. The palm subdomain can be further broken down into the palm insertion module [450–527] and extended foot module [838–879] and the finger subdomain into specificity loop [740–769].6 The palm, fingers, and thumb regions of the T7 polymerase define the DNA binding and RNA synthesis catalytic sites.1
T7RNAP can be inhibited by various ways (Fig. 1), chiefly (a) by binding of inhibitor at the catalytic site of the enzyme, (b) by the binding of T7 lysozyme to an alternate site other than the active site, or (c) through binding to the DNA template.6,7 Though the T7 lysozyme-induced inhibition has been studied extensively,6,8,9 we have very little information about possible inhibitors that form interactions with active site and DNA template. In this article, our focus is on the inhibitors that bind to the catalytic site.
Figure 1.

Schematic diagram showing different modes of inhibition of T7RNAP: (A) binding of inhibitor (eg, heparin) at the catalytic site (colored red) of the enzyme, (B) binding of T7 lysozyme at an alternate site (colored yellow) other than the active site, and (C) binding of inhibitor (eg, actinomycin) to the DNA template.
The T7RNAP inhibition at the active site has been studied since a long time, though not with much structural details. In 1972, Chamberlin and Ring7 characterized few T7RNAP-specific inhibitors, where they have used few bacterial RNA polymerase-specific inhibitors (rifampicin, streptolydigin, streptovaricin complex) and few polyanionic compounds, such as polyribonucleotide (Poly[r(U)]) and heparin, that binds at the functional site of the polymerase. These inhibitors have been tested for their in vitro inhibition of T7RNAP. Heparin was identified as a potent inhibitor of both E. coli RNA polymerase and T7 RNA polymerase, whereas the antibiotics (rifampicin, streptovaricin, and streptolydigin) have no effect on T7 RNA polymerase even at higher concentrations. It has been proved with the RNA polymerase that heparin interacts with the free polymerase and inhibits its activity, while engaged in RNA synthesis; thus, it is a competitive inhibitor of RNA synthesis, affecting initiation but not elongation.10–12 In contrast to E. coli RNA polymerase, heparin inhibits T7RNAP equally whether added before or after the beginning of RNA synthesis.7 Heparin is usually used in biochemical tests, such as heparin trap assay.11 However, it has been found that few rifamycin SV derivatives, analogous to rifamycin, containing a variety of substituents at C-4 of the napthoquinone ring are active inhibitors of T7RNAP.13 In a recent study, iron (II) clathrochelates were also reported as inhibitors of T7RNAP transcription complexes, but in this study, active site of the polymerase was not considered for interaction analysis.14
Qimron et al.15 noticed that there is much to learn about T7 phage proteins and their interactions, which could lead to a better understanding of viral resistance to inhibitors. In this study, we have used heparin as a model inhibitor to study its interactions with T7RNAP. In addition to that, we have also analyzed the interactions of few low molecular weight (LMW) derivatives of heparin, to observe how the LMW derivatives interact with T7RNAP as compared to their high molecular weight counterpart. Exploring the interactions of heparin with T7RNAP will help one to understand its inhibition by other ligands.
Materials and Methods
Modeling and optimization of T7RNAP structure
Though experimentally determined structure of T7RNAP in its apo form is available in Protein Data Bank, PDB ID: 4RNP,16 the reported structure contains only α-carbons. So, we have modeled the full-length structure of T7RNAP with in silico modeling. Query sequence for structure prediction of T7RNAP from Enterobacteria phage T7 [P00573] was obtained from UniProt.17 I-TASSER18 web server was used for predicting the three-dimensional (3D) model. The PDB deposit of the T7RNAP complexed with T7 lysozyme [PDB ID: 1 ARO]6 having 99% identity with the query was assigned as template. The server has also used T7RNAP complexed with a phi10 protein and initiating GTPs [PDB ID: 2PI4]19 and T7RNAP elongation complex with 30 base pairs of duplex DNA [PDB ID: 1MSW],20 as templates with sequence identity between template chain with query sequence 100% and 99%. The two metal ions (Mg2+) at the active site positions Asp 537 and Asp 812 were modeled using MODELLER21 by taking the crystal structure of T7RNAP elongation phase substrate complex [PDB ID: 1S76]22 as template.
The 3D structure of T7RNAP obtained from in silico modeling was optimized using molecular dynamics (MD) simulation with GROMACS 4.5.23 The stability of T7RNAP structure during the MD simulation was measured by its deviation from the initial structure in terms of root mean square deviation (RMSD).
Interaction study of heparin
Heparin is found as both unfractionated and LMW versions. In this work, we analyzed heparin [PubChem CID: 444410] and few of its LMW derivatives such as enoxaparin [PubChem CID: 772], bemiparin [PubChem CID: 25244225], fondaparinux [PubChem CID: 5282448], and idraparinux [PubChem CID: 3083445].24
The above compounds were collected from PubChem,25 a public molecular information repository (Table 1, Supplementary Fig. 1). All these compounds were energy minimized using LigPrep tool26 with an Optimized Potentials for Liquid Simulations (OPLS_2005) force field. Their ionization states were generated at pH 7.0 ± 2.0 using Ionizer in LigPrep. Specific chiralities were retained during ligand preparations and stereoisomers per ligand were retained at a minimum value of 1, as these compounds have too many atoms and are too flexible. The T7RNAP model was optimized by the protein preparation wizard and the grid box enclosed around the active site residues (palm subdomain: Asp 537, His 811, and Asp 812 and finger subdomain: Lys 631 and Tyr 639).27,28 The selected compounds were docked to the active site of T7RNAP using Glide XP module29 of Maestro 9.2 suite.30 While docking, flexible docking option was selected. Ring sampling energy window was kept at 2.5 kcal/mol. For energy minimization, distance-dependent dielectric constant was kept at its default value of 0.2 and maximum number of minimization steps used by the conjugate gradient minimization algorithm was kept at its default value of 100. The interactions of protein–ligand complexes were visualized by LigPlot+ tool.31
Table 1.
Details of heparin and its LMW derivatives obtained from PubChem.
| SL. NO. | COMPOUND NAME | PUBCHEM CID | MOLECULAR WEIGHT (g/mol) | MOLECULAR FORMULA |
|---|---|---|---|---|
| 1. | Heparin | 444410 | 1661.41 | C36H60O55S9 |
| 2. | Enoxaparin | 772 | 1134.93 | C26H42N2O37S5 |
| 3. | Bemiparin | 25244225 | 591.45 | C12H17NO20S3−4 |
| 4. | Fondaparinux | 5282448 | 1508.26 | C31H53N3O49S8 |
| 5. | Idraparinux | 3083445 | 1529.34 | C38H64O49S7 |
Prime MM-GBSA
Molecular mechanics/generalized Born surface area (MM-GBSA) method was used as a post-docking validation tool. The binding energy calculated by MM-GBSA shows a reasonably good correlation between the predicted and the experimental binding affinity. The Prime/MM-GBSA (Schrödinger, LLC) method combines OPLS molecular mechanics energies (EMM), a VSGB solvation model for polar solvation (GSGB), and a nonpolar solvation term (GNP) composed of the nonpolar solvent-accessible surface area (SASA) and van der Waals interactions.32 Based on the docked complex, it calculates the binding free energy (ΔGbind) of each ligand using the following equation,33
where ΔEMM is the difference in energy between the complex structure and the sum of the energies of the protein with and without ligand, ΔGsolv is the difference in the GBSA solvation energy of the complex and the sum of the solvation energies for the ligand and unliganded protein, and ΔGSA is the difference in the surface area energy for the complex and the sum of the surface area energies for the ligand and uncomplexed protein.
MD simulation
MD simulation has been commonly applied to refine homology models and evaluation of hits for stability and to study the way a ligand and receptor would behave in a real environment with the aid of physical movements of atoms.34–39 Simulations were performed using the program GROMACS 4.5 with GROMOS force field40 for T7RNAP model and T7RNAP-ligand complexes. The parameters and topologies of the ligands were calculated by PRODRG server prior to MD simulation.41 The Simple Point Charge (SPC) water model was used to solvate system, which was generated as a cubic box-like area with a side of 1.2 nm such that the protein and the protein–ligand complexes are covered appropriately with water molecules. Sodium and chloride ions were added to neutralize charge for the protein as well as the complexes. Energy minimization was performed using the steepest descent method for 50,000 steps for all systems with a tolerance of 1000 kJ mol−1 nm−1. Consequently, 50,000 steps of a conjugate gradient algorithm was also used to minimize the systems with a tolerance of 1000 kJ mol−1 nm−1. For long-range interactions, the PME method was used with a 1.0 nm cutoff. Then, equilibrations were carried out for 100 ps for each system with a constant number of particles, volume, and temperature [NVT; with modified Berendsen thermostat with velocity rescaling42 at 310 K and a 0.1 ps time step, Particle Mesh Ewald Coulomb type43 for long-range electrostatics with Fourier spacing 0.16]; and a constant number of particles, pressure, and temperature [NPT; Parrinello–Rahman pressure coupling44 at 1 bar with a compressibility of 4.5 × 10⁻⁵ bar−1 and a 2 ps time constant]. Finally, the equilibrated system for T7RNAP model was subjected to 50 ns MD simulation and equilibrated systems for each protein–ligand complexes were subjected to 30 ns MD simulation with a time step of 2 fs. Bond lengths were constrained using the linear constraint solver (LINCS) algorithm.45 The quality of the receptor–ligand complexes were analyzed by RMSD and root mean square fluctuation (RMSF) plots. The number of hydrogen bonds formed during the simulation was calculated using g_hbond utility of GROMACS.
MM-PBSA
The molecular mechanics Poisson–Boltzmann surface area (MM-PBSA) approach is one of the most widely used binding free energy calculation method combined with MD simulation. It has been successfully applied to various protein–ligand or protein–protein/peptide complexes.46,47 Poisson–Boltzmann (PB) is an implicit solvent method often used to approximate polar solute–solvent interactions by representing the solvent with a simple dielectric continuum model, whereas SASA models are popular choices for nonpolar solute–solvent interactions.48 This method also helps to understand biomolecular associations in detail by decomposing the total binding energy into a series of components. The g_mmpbsa tool49,50 was employed for calculating the binding free energy of protein–ligand complexes from MD trajectories. This module estimates the Gibb’s free energy of binding using the MM-PBSA method as described by the equations below:
where ΔGcomplex is the total free energy of the protein–ligand complex and ΔGprotein and ΔGligand are total free energies of the isolated protein and ligand in solvent, respectively. ΔGx is the free energy for each individual entity. TΔS refers to the entropic contribution to the free energy in vacuum where T and S denote the temperature and entropy, respectively. ΔGsolv is the free energy of solvation. The vacuum potential energy, ΔEMM, includes the energy of both bonded and nonbonded interactions. Detailed theory for this module and its implementation protocol in GROMACS has been reported by Kumari et al.49
The g_mmpbsa tool allowed us to decompose the total binding free energy into the contribution made by each residue, enabling us to understand the complex binding process in detail through a comparison of the relative contribution of residues to the overall binding energy. For this calculation, at first the energy components EMM, Gpolar, and Gnonpolar of individual atoms were calculated in both protein–ligand complex and unbound form and subsequently their contribution to the binding energy ΔRxBE of residue “x” was calculated as follows:
where Aibound and Aifree are the energy of ith atom from x residue in complexed and uncomplexed forms, respectively, and n is the total number of atoms in the residue.
Results
Optimized 3D structure of T7RNAP
I-TASSER predicted the model for T7RNAP with appropriate confidence score (C-score = 2), suggesting that the modeled structure is of good quality. The modeled structure (Fig. 2A) was submitted to PDBsum (https://www.ebi.ac.uk/pdbsum/) for the calculation of secondary structure summary and Ramachandran plot. PDBsum results showed that about 51% of the residues constitute α-helices while the contribution of strands is about 7.5%. The modeled structure shows 89.6% favored region and 9.6% in the allowed region of Ramachandran plot. For further validation of the modeled structure, it was submitted to Verify3D server (https://services.mbi.ucla.edu/Verify_3D/); 87.88% of the residues had an averaged 3D–1D score >0.2. All these results suggest that the modeled structure is a valid one and hence the structure was used for further studies.
Figure 2.

(A) The 3D view of T7RNAP model structure. The positions of domain and subdomains are shown. (B) The backbone RMSD plot for T7RNAP during the 50 ns simulation period.
The modeled 3D structure of T7RNAP was optimized using 50 ns MD simulation in solvent to mimic the physiological environment. The stability of T7RNAP structure during the MD simulation was measured by its deviation from the initial structure in terms of RMSD. The RMSD values of the T7RNAP backbone atoms in the entire MD simulation trajectory were shown in Figure 2B. The RMSD of the protein backbone atoms showed a stable behavior after 20 ns and converged to 0.45 nm. A representative structure of the minimum energy region from the entire 50 ns trajectory was extracted and utilized for further analysis.
Molecular docking results
Binding mode of heparin
Heparin (CID: 444410, C36H60O55S9), upon docking with the polymerase, gave a glide score of −11.86 kcal/mol. It formed H-bonds with the two critical catalytic residues Asp 537 and Asp 812, while the passive residues formed eight H-bonds (Arg 425, Asn 466, Ser 541, Tyr 571, Arg 632, Asp 653, and His 784). Along with these, six hydrophobic interactions with T7RNAP were also observed (Asp 506, Met 635, Thr 636, Ala 638, Pro 780, and His 811). The magnesium metal, MG884, formed interaction with O38 atom attached to the sulfur (S4) of the ligand, while MG885 formed two interactions with O35 and O13 atom of S3 of the ligand (Fig. 3A and Supplementary Fig. 2A, Table 2).
Figure 3.

Interactions of (A) heparin, (B) fondaparinux, (C) bemiparin, (D) enoxaparin, and (E) idraparinux with T7RNAP. Ligand interactions are indicated by black dotted lines (for details on all the interactions, refer to Table 2).
Table 2.
Docking results of heparin and LMW heparin derivatives with T7RNAP.
| SL NO. | COMPOUND NAME | XP G-SCORE (kcal/mol) | H-BOND INTERACTIONS D-A[X]a | METAL-LIGAND INTERACTIONS M-A[X]a | HYDROPHOBIC INTERACTIONS |
|---|---|---|---|---|---|
| 1 | Heparin | −11.86 | NH1(Arg 425)-O28[2.88] | MG884-O38[2.76] | Asp 506, Met 635, Thr 636, Ala 638, Pro 780, His 811. |
| OD1(Asn 466)-O43[2.64] | MG885-O13[2.28] | ||||
| OD2(Asp 537)-O38[2.57] | MG885-O35[2.16] | ||||
| OG (Ser 541)-O30[2.73] | |||||
| OH(Tyr 571)-O41[3.16] | |||||
| NH1(Arg 632)-O47[3.00] | |||||
| NH1(Arg 632)-O14[3.04] | |||||
| OD1(Asp 653)-O53[2.82] | |||||
| NE2(His 784)-O34[3.24] | |||||
| OD1(Asp 812)-O35[3.13] | |||||
| 2 | Enoxaparin | −7.69 | NZ(Lys 441)-O24[2.61] | MG884-O18[2.91] | Glu 350, Asp 438, Ser 507, Met 635, His 811. |
| N2-O(Asp 506)[3.10] | MG885-O18[2.88] | ||||
| OD2(Asp 537)-O18[3.01] | MG885-O25[2.47] | ||||
| NZ(Lys 631)-O30[3.12] | |||||
| NE(Arg 632)-O35[2.92] | |||||
| NH2(Arg 632)-O35[2.57] | |||||
| OG (Ser 813)-O34[3.03] | |||||
| 3 | Bemiparin | −7.96 | NZ(Lys 441)-O18[2.90] | MG884-O11[2.14] | Gly 436, Ser 539, Lys 631, Met 635. |
| NZ(Lys 441)-O8[2.93] | MG884-N1[2.51] | ||||
| O(Gln 435)-O8[2.95] | MG885-O4[2.57] | ||||
| N (Cys 540)-O13[2.91] | MG885-O1[2.99] | ||||
| OG(Ser 541)-O12[2.98] | MG885-O7[2.43] | ||||
| O(Gly 538)-O11[2.95] | |||||
| OD2(Asp 537)-N1[3.22] | |||||
| ND1(His 811)-O7[3.03] | |||||
| OD2(Asp 812)-N1[2.66] | |||||
| OD2(Asp 812)-O11[3.31] | |||||
| 4 | Fondaparinux | −12.68 | NZ(Lys 441)-O40[2.80] | MG884-O29[2.62] | Arg 423, Gln 435, Gly 436, Cys 467, Ser 507, Ser 539, Lys 631, Arg 632, Met 635, Thr 636, Ala 638, Pro 780, Asn 781, Ile 810. |
| NZ(Lys 441)-O31[2.56] | MG885-O10[2.55] | ||||
| OD2(Asp 537)-O29[2.43] | MG885-O30[2.68] | ||||
| OD2(Asp 537)-O16[3.29] | MG885-O16[2.25] | ||||
| O(Gly 538)-O29[3.22] | |||||
| OH(Tyr571)-O33[2.89] | |||||
| OD1(Asp 653)-O32[2.39] | |||||
| ND1(His 784)-O49[2.93] | |||||
| ND1(His 811)-O12[3.03] | |||||
| 5 | Idraparinux | −4.189 | NH1(Lys 423)-O39[2.72] | Nil | Gly 436, Gln 435, Asp 506, Ser 507, Arg 632, Met 635, Thr 636, Ala 638, Asp 653, Tyr 739, Ser 776, Gly 777, Pro 780, His 784, His 811. |
| NH1(Lys 425)-O4[3.06] | |||||
| NH1(Lys 425)-O42[2.87] | |||||
| NZ(Lys 441)-O23[2.88] | |||||
| NZ(Lys 441)-O48[2.70] | |||||
| NZ(Lys 631)-O31[2.84] |
Abbreviations:
D, donor; A, acceptor; M, Metal; X, length of interaction in Å.
Binding mode of LMW heparin compounds
Fondaparinux [CID: 5282448, C31H53N3O49S8] has the highest XP G-score of −12.68 kcal/mol. A framework of 9 H-bonds and 14 hydrophobic interactions was seen to stabilize the interface complex. It formed two H-bonds with the critical catalytic residue Asp 537 as well as other passive residues such as Lys 441, Gly 538, Tyr 571, Asp 653, His 784, and His 811. The magnesium metal, MG884, formed one interaction with O29 atom attached to the sulfur (S4) of the ligand, while MG885 formed three interactions with O10 and O30 atoms of S3 and O16 attached to the C17 of the ligand. Hydrophobic interactions are formed by Arg 423, Ser 539, Lys 631, Arg 632, Met 635, Thr 636, Ala 638, Pro 780, Asn 781, Gln 435, Gly 436, Ile 810, Cys 467, and Ser 507 (Fig. 3B and Supplementary Fig. 2B, Table 2).
Bemiparin [CID: 25244225, C12H17NO20S3−4] formed 10 H-bonds and 4 hydrophobic interactions with T7RNAP, with XP G-score score of −7.96 kcal/mol. Out of the major catalytic residues, Asp 537 formed one H-bond and Asp 812 formed two H-bonds with bemiparin, while rest of the H-bonds were formed by passive residues. The magnesium metal, MG884, formed two interactions with O11 and N1 atom attached to the sulfur (S1) of the ligand, while MG885 formed three interactions with O1, O4, and O7 atoms of the ligand (Fig. 3C and Supplementary Fig. 2C, Table 2).
Enoxaparin [CID: 772, C26H42N2O37S5] has an XP G-score score of −7.697 kcal/mol. This compound revealed a network of interactions with receptor residues including catalytic residues such as Asp 537 and Lys 631 with five passive residues Lys 441, Asp 506, Arg 632 (two bonds), and Ser 813. This compound formed a total of five hydrophobic interactions with the receptor (Glu 350, Asp 438, Ser 507, Met 635, and His 811). The magnesium metal, MG884, formed one interaction with O18 atom attached to the sulfur (S1) of the ligand, while MG885 formed two interactions with O18 atom of S1 and O25 of S3 of the ligand (Fig. 3D and Supplementary Fig. 2D, Table 2).
Idraparinux [CID: 3083445, C38H64O49S7] formed 6 H-bonds and 15 hydrophobic interactions with an XP G-score of −4.189 kcal/mol. Out of the critical residues, only Lys 631 formed a H-bond with the receptor, rest of the H-bonds are formed by passive residues Lys 423, Lys 425, and Lys 441. The residues involved in the hydrophobic interactions were Tyr 739, Ser 776, Gly 777, Ala 638, Asp 653, Thr 636, Met 635, Arg 632, Ser 507, Asp 506, Gly 436, Gln 435, His 811, His 784, and Pro 780 (Fig. 3E, Table 2). No metal interactions were found as the ligand positioned itself away from the magnesium (Fig. 3E and Supplementary Fig. 2E, Table 2). The images of docked poses (Fig. 3) were rendered by UCSF Chimera.51
Post-docking prime MM-GBSA
The receptor–ligand complexes generated as pose viewer file in Glide XP were submitted to the Prime/MM-GBSA tool in Maestro for MM-GBSA calculation to rescore the docking results with the help of free energy of binding. The free energy of binding (ΔGbind) for the given complexes varied from −125.4 to −43.2 kcal/mol (Table 3). Though in the docking studies fondaparinux had the highest docking score, in MM-GBSA studies it was found that heparin has far better free energy of binding (−125.44 kcal/mol) than fondaparinux (−68.03 kcal/mol). Fondaparinux was also found to be more strained as compared to heparin. Out of other LMW heparins, bemiparin has the highest binding free energy (−83.02 kcal/mol) and less ligand strain than fondaparinux. Enoxaparin also shows similar binding free energy (−64.332 kcal/mol) as fondaparinux but with much lower ligand strain than both fondaparinux and bemiparin. Hence, we considered bemiparin and enoxaparin along with heparin for MD simulation.
Table 3.
Prime MM-GBSA calculation of the docked complexes.
| COMPOUND | GLIDE SCORE (kcal/mol) | ΔGbind (kcal/mol) | ΔGCoul | ΔGVdw | ΔGLipo | Solv GB | LIGAND STRAIN ENERGY |
|---|---|---|---|---|---|---|---|
| Heparin | −11.86 | −125.439 | 208.493 | −63.338 | −17.708 | −261.704 | 28.367 |
| Fondaparinux | −12.68 | −68.027 | 230.879 | −76.159 | −11.625 | −213.605 | 34.162 |
| Bemiparin | −7.96 | −83.024 | 34.571 | −30.670 | −7.398 | −78.668 | 20.391 |
| Enoxaparin | −7.69 | −64.332 | 66.687 | −47.395 | −13.259 | −70.601 | 18.645 |
| Idraparinux | −4.19 | −43.167 | 164.868 | −70.630 | −28.779 | −113.836 | 16.181 |
Abbreviations: ΔGbind, MM-GBSA free energy of binding; ΔGCoul, Coulomb energy of the complex; ΔGVdw, van der Waals energy of the complex; ΔGLipo, lipophilic energy of the complex; SolvGB, solvation energy of the complex.
Molecular dynamics studies
The top scoring compounds from the MM-GBSA study (heparin, bemiparin, and enoxaparin) were subjected to MD simulation to evaluate their stable binding with T7RNAP. The RMSD was calculated for all the complexes for 30 ns trajectory. From the RMSD graph (Fig. 4A), it can be seen that heparin is more stable among the three complexes with RMSD at ∼0.25 nm and showed a steady pattern after 15 ns. Enoxaparin complex showed a maximum deviation at ∼0.3 nm and formed a steady pattern after 15 ns, while bemiparin complex reached a maximum RMSD of ∼0.35 nm displaying a steady pattern after ∼22 ns. All these complexes attained stability and achieved a lower RMSD than in the free polymerase (∼0.45 nm).
Figure 4.

MD simulation results at 30 ns timescale: (A) comparative analysis of RMSD (backbone) with time for heparin, enoxaparin, and bemiparin complexes with T7RNAP, (B) RMS fluctuation of palm and finger subdomain residues of all three complexes during the 30 ns simulation. The number of hydrogen bonds formed between receptor and ligand in the three complexes with (C) heparin, (D) enoxaparin, and (E) bemiparin is shown.
The RMSF plot (Fig. 4B) was calculated for 30 ns simulation period for all the complexes. Our particular interest is the residues corresponding to palm and finger subdomains, which took participation in the ligand binding. The RMSF plot showed that bemiparin complex attained more fluctuations during the simulation compared to the heparin and enoxaparin complexes, emphasizing that the hydrogen bonds formed in docking process are highly unstable and not persistent throughout the simulation. To examine this, we compared the number of H-bonds formed between the ligand and receptor of all the three complexes during the 30 ns simulation. Multiple representatives of all the complexes from the 30 ns trajectories were extracted for an in-depth analysis of interactions.
The hydrogen bond interactions of heparin + T7RNAP complex (Fig. 4C) reached a maximum of eight and remained at five for most of the time. Among them, heparin maintained constant H-bond interactions with Arg 425, Tyr 571, Arg 632, His 784, and Asp 812 as well as additional interactions with His 811 and Tyr 739. As for the hydrophobic interactions in heparin–T7RNAP complex, all of them were found to be intact. The catalytic residue Lys 631 was seen forming hydrophobic interactions.
The enoxaparin + T7RNAP complex (Fig. 4D) maintained four bonds on an average while reaching a maximum of seven H-bonds during the 30 ns simulation period. It maintained H-bonding contribution of Lys 441 and Arg 632 and additional interactions with Tyr 571, Gly 436, and His 811. The hydrophobic interactions by residues Glu 350, Asp 438, and Met 635 were found to be intact throughout the simulation period. The catalytic residues Arg 631 and Asp 812 are seen forming hydrophobic interactions. Moreover, additional hydrophobic interactions were also observed in all the complexes.
In the case of bemiparin + T7RNAP complex (Fig. 4E), it maintained two bonds on an average while reaching a maximum of four H-bonds. It maintained H-bonding contribution of His 811 and additional interactions with Gln 435, Tyr 571, and Lys 631. The hydrophobic interactions were found to be intact, and Asp 812 was seen forming hydrophobic interaction. These results show that Tyr 571 and His 811 are critical for the interaction of heparin with T7RNAP as they maintained their H-bonds constantly in all the complexes.
SASA of the apo form of T7RNAP as well as all the T7RNAP–ligand complexes were calculated for the last 5 ns of simulation trajectories to check the stability of the binding pocket using g_sas utility of GROMACS. It was observed that accessible surface area of T7RNAP active site residues was significantly reduced after binding with inhibitors. The accessible surface area of T7RNAP alone reached up to 13 nm2, while with heparin, bemiparin, and enoxaparin it reduced to about 5.2 nm2 (Supplementary Fig. 3), which indicates that the ligands are strongly occupying the binding cavity in all the three complexes.
To evaluate how these changes in protein + ligand complexes contributed to the binding energy during the simulation, we subjected these complexes to MM-PBSA analysis.
Post-simulation MM-PBSA
The energy components EMM, Gpolar, and Gnonpolar of each complex were calculated for 26 snapshots that were extracted at every 0.2 ns from the production trajectories from 25 to 30 ns (Table 4). Among the complexes, heparin has a better free energy (−240.29 kJ/mol) of binding than the LMW heparin, bemiparin (−12.76 kJ/mol), and enoxaparin (−51.92 kJ/mol). The energy difference is mainly contributed by van der Waals energy as well as polar solvation energy.
Table 4.
Binding free energy (MM-PBSA) and their components (kJ/mol) of T7RNAP complex with heparin and its LMW versions.
| ID | BINDING ENERGY | VAN DER WAAL ENERGY | ELECTROSTATIC ENERGY | POLAR SOLVATION ENERGY | SASA ENERGY |
|---|---|---|---|---|---|
| Heparin | −240.288 ± 33.119 | −479.880 ± 14.535 | −110.557 ± 26.446 | 392.004 ± 38.629 | −41.855 ± 1.523 |
| Enoxaparin | −51.917 ± 23.402 | −241.341 ± 19.358 | −64.980 ± 22.338 | 279.895 ± 44.239 | −25.491 ± 2.479 |
| Bemiparin | −12.759 ± 21.126 | −124.041 ± 8.199 | −5.431 ± 16.425 | 130.885 ± 28.575 | −14.172 ± 1.172 |
To identify the key residues related to the binding process, the binding free energy between the protein and inhibitor was decomposed into the contribution of each residue using MM-PBSA approach. For this analysis, the residues from palm and finger subdomains were only considered. As can be seen from Figure 5A, the major energy contribution for heparin–T7RNAP complex was from the residues Asp 438, Asp 471, Asp 506, Asp 537, Ser 539, Cys 540, Tyr 571, Glu 600, Met 635, Glu 652, Asp 653, Pro 780, and Asp 812, out of which Asp 471, Asp 506, Asp 537, Tyr 571, Met 635, Asp 653, Pro 780, and Asp 812 were the highest contributors. As for enoxaprin–T7RNAP complex residues, Gly 436, Asn 437, Asp 506, Tyr 571, Asp 599, Glu 600, Ser 628, Met 635, Glu 652, and Asp 653 contributed the maximum to binding free energy (Fig. 5B). In case of bemiparin–T7RNAP complex, highest contribution was obtained from Met 635, Glu 652, and Asp 653 (Fig. 5C).
Figure 5.

Plot of MM-PBSA binding free energy contribution per residue of the complexes formed by (A) heparin, (B) enoxaparin, and (C) bemiparin. The residues showing highest fluctuations are highlighted.
Discussion
The modeled complete structure of T7RNAP with Mg2+ ions at catalytic center in its apo form showed good quality. The RMSD plot obtained from the MD simulations shows a stable profile. The helical composition of the modeled structure is higher than the template structure with lysozyme (1ARO; 48%). The ratio of defined secondary structural components was also higher in the model structure, as majority of the positions (residue number: 60–72, 165–181, 234–240, 345–385, and 590–611) in the 1ARO are devoid of defined secondary structure (boxed in Supplementary Fig. 4). The position and distances of the divalent metal ions at the catalytic center (Supplementary Fig. 5A) were maintained in the modeled structure and the distances were maintained throughout the 50 ns simulation (Supplementary Fig. 5B). The C-terminal end is also projected toward the palm subdomain (colored yellow in Supplementary Fig. 5C) in the modeled structure as required by the polymerase to function efficiently as opposed to the lysozyme bound structure (colored yellow in Supplementary Fig. 5D). The distance of Asp 537 and Ala 883 in the modeled structure was ∼7 Å and during MD simulation and the closeness of the C-terminal end to the catalytic residues of the palm subdomain was maintained (Supplementary Fig. 5E). Similarly, the distance between the Mg2+ attached to Asp 537 and Ala 883 was also maintained throughout the simulation.
Both docking and post-docking MM-GBSA studies showed favorable binding energy for heparin + T7RNAP complex. As for the LMW heparin compounds, we found that bemiparin and enoxaparin showed better results in docking and MM-GBSA analysis. Also, sulfur atoms, being an integral part of the heparin structure, were seen to impart a major role among the interactions by assisting in binding with Mg2+ at the catalytic core of T7RNAP as well as other key residues. The results also indicated that the solvation energy (Solv GB) and Coulomb energy of the complex has the highest contribution to the energy difference among all the ligand–receptor complexes.
The MD simulation studies of the protein and ligand complexes revealed that the heparin + T7RNAP complex maintained a better stability than the complexes of its LMW derivatives. From the MM-PBSA studies, we found that heparin established a stronger binding affinity with T7RNAP (compared to its LMW derivatives) and among LMW derivatives, enoxaparin is found to be a possible alternative owing to its induced stability to the complex with T7RNAP and better binding free energy than bemiparin complex. The decomposition of binding free energy (MM-PBSA) into each interaction type suggested that van der Waals interactions and polar solvation energy provides the ample driving force for the binding process of both the complexes, which were also seen in post-docking MM-GBSA analysis (Table 3). The per-residue energy contribution of heparin + T7RNAP complex revealed that the Asp 471, Asp 506, Asp 537, Tyr 571, Met 635, Asp 653, Pro 780, and Asp 812 were the highest contributors to the binding affinity to T7RNAP. We also found residues contributing to the complexes of T7RNAP with LMW derivatives during the simulation period. By comparing the results of per-residue energy contribution of all the complexes, it can be said that the residues Asp 506, Tyr 571, Glu 600, Met 635, Glu 652, and Asp 653 were found to be the highest contributors in all the complexes and are essential for binding of heparin-like structures with T7RNAP. The residues found highly contributing to binding energy, common to the three complexes, were seen forming both H-bond and hydrophobic interactions with T7RNAP. This indicates that hydrophobic interactions also have a role in the stability of these complexes.
Inhibition mechanism of heparin
The results from the above analysis also help us to understand the inhibition mechanism of heparin. It was revealed that heparin inhibits T7RNAP by interactions with palm subdomain and finger subdomain. The residue Asp 471 present on the palm insertion module (450–527) was one of the strong contributors (Fig. 5A). This residue is adjacent to one important residue Lys 427, whose side chain swing greatly promotes the PPi (pyrophosphate) release during the T7RNA polymerase transcription elongation process.52 It is possible that the strong interaction of Asp 471 to heparin hinders the flexibility of highly flexible Lys 472 (Fig. 6) to swing properly and pull the PPi out.
Figure 6.
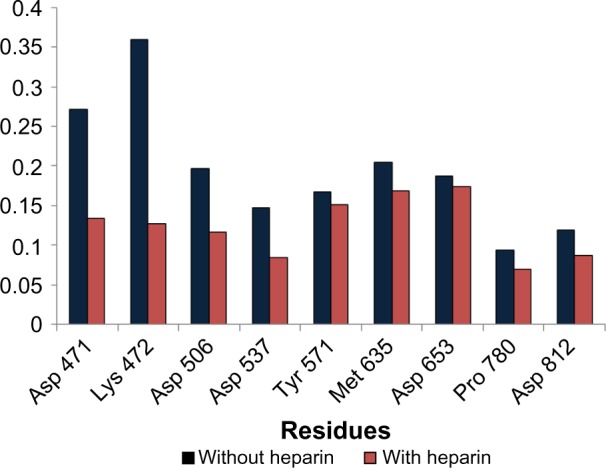
Comparison of fluctuations (RMSF) of important residues with and without heparin binding observed during MD simulation.
The two catalytic center residues Asp 537 and Asp 812 are directly involved in the catalysis of the phosphodiester bond synthesis by forming a complex with the divalent metal ions.53 Mutations of these residues were also found to be severely disrupting catalysis.54 Hence, strong interactions with these residues certainly help in inhibition.
The finger subdomain is specifically involved in the promoter binding. The residue Tyr 571 is directly involved in this first stage of transcription initiation T7RNAP, promoter recognition, and binding.28 Substitution mutation of this residue is proven to cause the complete loss of specific binding and activity with the promoter containing template.28,55 Met 635 makes interactions with the ribose moiety,56 and mutation in this residue caused a decrease in enzymatic activity to 5%–10%.28 hile palm subdomain makes contact with the upstream region of the template strand, the finger subdomain makes contacts with the templating base and the template strand immediately downstream of the templating base. The helix region (aa 642–654) of the finger subdomain is one of the primary regions for the interactions,55 and it harbors one of the highly contributing residues Asp 653.
We could not attribute any direct importance of the two highly contributing residues in heparin binding, Asp 506 and Pro 780. However, being in the most crucial subdomains, these two residues might play a role in inhibition of the T7RNAP by holding the heparin in position and thereby helping its interaction with the appropriate residues. This might open the possibility of indirect involvement of these residues in heparin-mediated inhibition.
Here, we observed that heparin binds to the important residues involved in T7RNAP transcription initiation and elongation with possible modes of inhibition. This broad range of interactions by heparin also explains its effectiveness in inhibiting T7RNAP whether added before or after the beginning of RNA synthesis.
Conclusion
The highly promoter-specific T7RNAP is extremely valuable for molecular biology applications including selective high-level expression of cloned genes, synthesis of small RNAs, constructing different expression system, etc. Here, we have demonstrated the binding mode of heparin with T7RNAP. To understand the binding mode of heparin, we have analyzed both heparin and its LMW derivatives. From the results of the multistep analysis it was found that heparin binds more strongly to T7RNAP with better stability, when compared to its LMW derivatives.
Among the LMW heparin compounds, enoxaparin is found to be a possible alternative owing to its induced stability to the complex with T7RNAP and better binding free energy than bemiparin complex. Enoxaparin showed promising results to be a possible LMW alternative to heparin to be used as an inhibitor of T7RNAP. The per-residue energy decomposition brought out few important residues that are important for binding of heparin and its LMW derivatives, with T7RNAP. The docking studies showed that sulfur atoms, which are integral part of heparin skeleton, play a major role in its interactions with T7RNAP, and this observation was also maintained in simulation studies. We have also proposed a possible mode of inhibition of T7RNAP by heparin.
The findings in this work could offer a better understanding of T7RNAP inhibition mechanism as well as form a base for further design of inhibitors for T7RNAP and other related polymerases.
Supplementary Material
Supplementary Figure 1. Structures of ligands used for the study: (A) heparin, (B) enoxaparin, (C) bemiparin, (D) fondaparinux and (E) idraparinux.
Supplementary Figure 2. The 2D interaction diagram of T7RNAP and the ligands: (A) heparin, (B) fondaparinux, (C) bemiparin, (D) enoxaparin, and (E) idraparinux.
Supplementary Figure 3. The solvent-accessible surface area of the active site residues of T7RNAP alone and complexes of T7RNAP with the ligands (A) heparin, (B) bemiparin, and (C) enoxaparin during the last 5 ns of simulation trajectories.
Supplementary Figure 4. Secondary structure elements of (A) the crystal structure of T7RNAP complexed with lysozyme and (B) the modeled structure of T7RNAP. The regions of missing residues and secondary structures are shown in black box.
Supplementary Figure 5. (A) The position of Mg2+ ions in the modeled structure with their distances and (B) the average distance they maintained throughout the simulation. Comparison of the closeness of C-terminal end (shown in yellow color) to catalytic center in: (C) the crystal structure with lysozyme (1ARO) and (D) the modeled structure. The average distance maintained by the C-terminal end with catalytic center in the modeled structure throughout the simulation period.
Footnotes
ACADEMIC EDITOR: Thomas Dandekar, Associate Editor
PEER REVIEW: Four peer reviewers contributed to the peer review report. Reviewers’ reports totaled 625 words, excluding any confidential comments to the academic editor.
FUNDING: AM received Major Research Project funding from the University Grants Commission - New Delhi. CKM received a Rajiv Gandhi National Fellowship from the University Grants Commission. The authors confirm that the funder had no influence over the study design, content of the article, or selection of this journal.
COMPETING INTERESTS: Authors disclose no potential conflicts of interest.
Paper subject to independent expert blind peer review. All editorial decisions made by independent academic editor. Upon submission manuscript was subject to anti-plagiarism scanning. Prior to publication all authors have given signed confirmation of agreement to article publication and compliance with all applicable ethical and legal requirements, including the accuracy of author and contributor information, disclosure of competing interests and funding sources, compliance with ethical requirements relating to human and animal study participants, and compliance with any copyright requirements of third parties. This journal is a member of the Committee on Publication Ethics (COPE).
Author Contributions
Conceived and designed the experiments: SB. Analyzed the data and wrote the first draft of the manuscript: SB. Contributed to the writing of the manuscript: AM. Agreed with manuscript results and conclusions: SB, CKM, AM. Jointly developed the structure and arguments for the paper: SB, AM. Made critical revisions and approved the final version: SB, CKM, AM. All the authors reviewed and approved the final manuscript.
REFERENCES
- 1.Kochetkov S, Rusakova E, Tunitskaya V. Recent studies of T7 RNA polymerase mechanism. FEBS Lett. 1998;440(3):264–7. doi: 10.1016/s0014-5793(98)01484-7. [DOI] [PubMed] [Google Scholar]
- 2.Studier FW, Moffatt BA. Use of bacteriophage T7 RNA polymerase to direct selective high-level expression of cloned genes. J Mol Biol. 1986;189(1):113–30. doi: 10.1016/0022-2836(86)90385-2. [DOI] [PubMed] [Google Scholar]
- 3.Sonohara Y, Iwai S, Kuraoka I. An in vitro method for detecting genetic toxicity based on inhibition of RNA synthesis by DNA lesions. Genes Environ. 2015;37(1):1. doi: 10.1186/s41021-015-0014-8. [DOI] [PMC free article] [PubMed] [Google Scholar]
- 4.Shis DL, Bennett MR. Synthetic biology: the many facets of T7 RNA polymerase. Mol Syst Biol. 2014;10(7):745. doi: 10.15252/msb.20145492. [DOI] [PMC free article] [PubMed] [Google Scholar]
- 5.Wons E, Furmanek-Blaszk B, Sektas M. RNA editing by T7 RNA polymerase bypasses InDel mutations causing unexpected phenotypic changes. Nucleic Acids Res. 2015;43(8):3950–63. doi: 10.1093/nar/gkv269. [DOI] [PMC free article] [PubMed] [Google Scholar]
- 6.Jeruzalmi D, Steitz TA. Structure of T7 RNA polymerase complexed to the transcriptional inhibitor T7 lysozyme. EMBO J. 1998;17(14):4101–13. doi: 10.1093/emboj/17.14.4101. [DOI] [PMC free article] [PubMed] [Google Scholar]
- 7.Chamberlin M, Ring J. Characterization of T7-specific ribonucleic acid polymerase. II. Inhibitors of the enzyme and their application to the study of the enzymatic reaction. J Biol Chem. 1973;248(6):2245–50. [PubMed] [Google Scholar]
- 8.Moffatt BA, Studier FW. T7 lysozyme inhibits transcription by T7 RNA polymerase. Cell. 1987;49(2):221–7. doi: 10.1016/0092-8674(87)90563-0. [DOI] [PubMed] [Google Scholar]
- 9.Zhang X, Studier FW. Multiple roles of T7 RNA polymerase and T7 lysozyme during bacteriophage T7 infection. J Mol Biol. 2004;340(4):707–30. doi: 10.1016/j.jmb.2004.05.006. [DOI] [PubMed] [Google Scholar]
- 10.Dynan WS, Burgess RR. In vitro transcription by wheat germ ribonucleic acid polymerase II: effects of heparin and role of template integrity. Biochemistry. 1979;18(21):4581–8. doi: 10.1021/bi00588a019. [DOI] [PubMed] [Google Scholar]
- 11.Sarin LP, Poranen MM, Lehti NM, et al. Insights into the pre-initiation events of bacteriophage ϕ6 RNA-dependent RNA polymerase: towards the assembly of a productive binary complex. Nucleic Acids Res. 2009;37(4):1182–92. doi: 10.1093/nar/gkn1035. [DOI] [PMC free article] [PubMed] [Google Scholar]
- 12.Yang H, Gottlieb P, Wei H, Bamford DH, Makeyev EV. Temperature requirements for initiation of RNA-dependent RNA polymerization. Virology. 2003;314(2):706–15. doi: 10.1016/s0042-6822(03)00460-4. [DOI] [PubMed] [Google Scholar]
- 13.Chamberlin MJ, Ring J. Characterization of T7 specific RNA polymerase. III. Inhibition by derivatives of rifamycin SV. Biochem Biophys Res Commun. 1972;49(4):1129–36. doi: 10.1016/0006-291x(72)90330-0. [DOI] [PubMed] [Google Scholar]
- 14.Novikov VV, Varzatskii OA, Negrutska VV, et al. Size matters, so does shape: inhibition of transcription of T7 RNA polymerase by iron (II) clathrochelates. J Inorg Biochem. 2013;124:42–5. doi: 10.1016/j.jinorgbio.2013.03.005. [DOI] [PubMed] [Google Scholar]
- 15.Qimron U, Tabor S, Richardson CC. New details about bacteriophage T7-host interactions. Microbe. 2010;5:117–22. [Google Scholar]
- 16.Sousa R, Chung YJ, Rose JP, Wang BC. Crystal structure of bacteriophage T7 RNA polymerase at 3.3 A resolution. Nature. 1993;364(6438):593–9. doi: 10.1038/364593a0. [DOI] [PubMed] [Google Scholar]
- 17.Consortium U. The universal protein resource (UniProt) Nucleic Acids Res. 2008;36(Suppl 1):D190–5. doi: 10.1093/nar/gkm895. [DOI] [PMC free article] [PubMed] [Google Scholar]
- 18.Roy A, Kucukural A, Zhang Y. I-TASSER: a unified platform for automated protein structure and function prediction. Nat Protoc. 2010;5(4):725–38. doi: 10.1038/nprot.2010.5. [DOI] [PMC free article] [PubMed] [Google Scholar]
- 19.Kennedy WP, Momand JR, Yin YW. Mechanism for de novo RNA synthesis and initiating nucleotide specificity by T7 RNA polymerase. J Mol Biol. 2007;370(2):256–68. doi: 10.1016/j.jmb.2007.03.041. [DOI] [PubMed] [Google Scholar]
- 20.Yin YW, Steitz TA. Structural basis for the transition from initiation to elongation transcription in T7 RNA polymerase. Science. 2002;298(5597):1387–95. doi: 10.1126/science.1077464. [DOI] [PubMed] [Google Scholar]
- 21.Eswar N, Webb B, Marti-Renom MA, et al. Comparative protein structure modeling using Modeller. Curr Protoc Bioinformatics. 2006 doi: 10.1002/0471250953.bi0506s15. Chapter 5: Unit 5.6. [DOI] [PMC free article] [PubMed] [Google Scholar]
- 22.Yin YW, Steitz TA. The structural mechanism of translocation and helicase activity in T7 RNA polymerase. Cell. 2004;116(3):393–404. doi: 10.1016/s0092-8674(04)00120-5. [DOI] [PubMed] [Google Scholar]
- 23.Van Der Spoel D, Lindahl E, Hess B, Groenhof G, Mark AE, Berendsen HJ. GROMACS: fast, flexible, and free. J Comput Chem. 2005;26(16):1701–18. doi: 10.1002/jcc.20291. [DOI] [PubMed] [Google Scholar]
- 24.Ciccone MM, Cortese F, Corbo F, et al. Bemiparin, an effective and safe low molecular weight heparin: a review. Vascul Pharmacol. 2014;62(1):32–7. doi: 10.1016/j.vph.2014.03.001. [DOI] [PubMed] [Google Scholar]
- 25.Wang Y, Xiao J, Suzek TO, Zhang J, Wang J, Bryant SH. PubChem: a public information system for analyzing bioactivities of small molecules. Nucleic Acids Res. 2009;37(Suppl 2):W623–33. doi: 10.1093/nar/gkp456. [DOI] [PMC free article] [PubMed] [Google Scholar]
- 26.Schrodinger L. Schrodinger Software Suite. New York: Schrödinger, LLC; 2011. [Google Scholar]
- 27.Knoll DA, Woody RW, Woody A-YM. Mapping of the active site of T7 RNA polymerase with 8-azidoATP. Biochim Biophys Acta. 1992;1121(3):252–60. doi: 10.1016/0167-4838(92)90154-6. [DOI] [PubMed] [Google Scholar]
- 28.Tunitskaya V, Kochetkov S. Structural–functional analysis of bacteriophage T7 RNA polymerase. Biochemistry. 2002;67(10):1124–35. doi: 10.1023/a:1020911223250. [DOI] [PubMed] [Google Scholar]
- 29.Friesner RA, Murphy RB, Repasky MP, et al. Extra precision glide: docking and scoring incorporating a model of hydrophobic enclosure for protein-ligand complexes. J Med Chem. 2006;49(21):6177–96. doi: 10.1021/jm051256o. [DOI] [PubMed] [Google Scholar]
- 30.Maestro S. Version 9.2. New York: Schrödinger, LLC; 2011. [Google Scholar]
- 31.Laskowski RA, Swindells MB. LigPlot+: multiple ligand-protein interaction diagrams for drug discovery. J Chem Inf Model. 2011;51(10):2778–86. doi: 10.1021/ci200227u. [DOI] [PubMed] [Google Scholar]
- 32.Vijayakumar B, Parasuraman S, Raveendran R, Velmurugan D. Identification of natural inhibitors against angiotensin I converting enzyme for cardiac safety using induced fit docking and MM-GBSA studies. Pharmacogn Mag. 2014;10(Suppl 3):S639–44. doi: 10.4103/0973-1296.139809. [DOI] [PMC free article] [PubMed] [Google Scholar]
- 33.Lyne PD, Lamb ML, Saeh JC. Accurate prediction of the relative potencies of members of a series of kinase inhibitors using molecular docking and MM-GBSA scoring. J Med Chem. 2006;49(16):4805–8. doi: 10.1021/jm060522a. [DOI] [PubMed] [Google Scholar]
- 34.Raval A, Piana S, Eastwood MP, Dror RO, Shaw DE. Refinement of protein structure homology models via long, all-atom molecular dynamics simulations. Proteins. 2012;80(8):2071–9. doi: 10.1002/prot.24098. [DOI] [PubMed] [Google Scholar]
- 35.Rajasekaran M, Abirami S, Chen C. Effects of single nucleotide polymorphisms on human N-acetyltransferase 2 structure and dynamics by molecular dynamics simulation. PLoS One. 2011;6(9):e25801. doi: 10.1371/journal.pone.0025801. [DOI] [PMC free article] [PubMed] [Google Scholar]
- 36.Rajasekaran M, Chen C. Structural effect of the L16Q, K50E, and R53P mutations on homeodomain of pituitary homeobox protein 2. Int J Biol Macromol. 2012;51(3):305–13. doi: 10.1016/j.ijbiomac.2012.05.008. [DOI] [PubMed] [Google Scholar]
- 37.Heinzelmann G, Kuyucak S. Molecular dynamics simulations of the mammalian glutamate transporter EAAT3. PLoS One. 2014;9(3):e92089. doi: 10.1371/journal.pone.0092089. [DOI] [PMC free article] [PubMed] [Google Scholar]
- 38.Chandrasekaran P, Rajasekaran R. A systematic molecular dynamics approach to the structural characterization of amyloid aggregation propensity of beta2-microglobulin mutant D76N. Mol Biosyst. 2016;12(3):850–9. doi: 10.1039/c5mb00759c. [DOI] [PubMed] [Google Scholar]
- 39.Chandrasekaran P, Rajasekaran R. Structural characterization of disease-causing mutations on SAP and the functional impact on the SLAM peptide: a molecular dynamics approach. Mol Biosyst. 2014;10(7):1869–80. doi: 10.1039/c4mb00177j. [DOI] [PubMed] [Google Scholar]
- 40.Oostenbrink C, Villa A, Mark AE, Van Gunsteren WF. A biomolecular force field based on the free enthalpy of hydration and solvation: the GROMOS force-field parameter sets 53A5 and 53A6. J Comput Chem. 2004;25(13):1656–76. doi: 10.1002/jcc.20090. [DOI] [PubMed] [Google Scholar]
- 41.SchuÈttelkopf AW, Van Aalten DM. PRODRG: a tool for high-throughput crystallography of protein–ligand complexes. Acta Crystallogr D Biol Crystallogr. 2004;60(8):1355–63. doi: 10.1107/S0907444904011679. [DOI] [PubMed] [Google Scholar]
- 42.Bussi G, Donadio D, Parrinello M. Canonical sampling through velocity rescaling. J Chem Phys. 2007;126(1):014101. doi: 10.1063/1.2408420. [DOI] [PubMed] [Google Scholar]
- 43.Kawata M, Nagashima U. Particle mesh Ewald method for three-dimensional systems with two-dimensional periodicity. Chem Phys Lett. 2001;340(1):165–72. [Google Scholar]
- 44.Martoňák R, Laio A, Parrinello M. Predicting crystal structures: the Parrinello-Rahman method revisited. Phys Rev Lett. 2003;90(7):075503. doi: 10.1103/PhysRevLett.90.075503. [DOI] [PubMed] [Google Scholar]
- 45.Hess B, Bekker H, Berendsen HJ, Fraaije JG. LINCS: a linear constraint solver for molecular simulations. J Comput Chem. 1997;18(12):1463–72. [Google Scholar]
- 46.Tran N, Van T, Nguyen H, Le L. Identification of novel compounds against an R294K substitution of influenza A (H7N9) virus using ensemble based drug virtual screening. Int J Med Sci. 2015;12(2):163. doi: 10.7150/ijms.10826. [DOI] [PMC free article] [PubMed] [Google Scholar]
- 47.Gohlke H, Case DA. Converging free energy estimates: MM-PB (GB) SA studies on the protein–protein complex Ras–Raf. J Comput Chem. 2004;25(2):238–50. doi: 10.1002/jcc.10379. [DOI] [PubMed] [Google Scholar]
- 48.Wagoner JA, Baker NA. Assessing implicit models for nonpolar mean solvation forces: the importance of dispersion and volume terms. Proc Natl Acad Sci U S A. 2006;103(22):8331–6. doi: 10.1073/pnas.0600118103. [DOI] [PMC free article] [PubMed] [Google Scholar]
- 49.Kumari R, Kumar R, Lynn A. g_mmpbsa – a GROMACS tool for high-throughput MM-PBSA calculations. J Chem Inf Model. 2014;54(7):1951–62. doi: 10.1021/ci500020m. [DOI] [PubMed] [Google Scholar]
- 50.Baker NA, Sept D, Joseph S, Holst MJ, McCammon JA. Electrostatics of nanosystems: application to microtubules and the ribosome. Proc Natl Acad Sci U S A. 2001;98(18):10037–41. doi: 10.1073/pnas.181342398. [DOI] [PMC free article] [PubMed] [Google Scholar]
- 51.Pettersen EF, Goddard TD, Huang CC, et al. UCSF Chimera – a visualization system for exploratory research and analysis. J Comput Chem. 2004;25(13):1605–12. doi: 10.1002/jcc.20084. [DOI] [PubMed] [Google Scholar]
- 52.Da LT, E C, Duan B, Zhang C, Zhou X, Yu J. A jump-from-cavity pyrophosphate ion release assisted by a key lysine residue in T7 RNA polymerase transcription elongation. PLoS Comput Biol. 2015;11(11):e1004624. doi: 10.1371/journal.pcbi.1004624. [DOI] [PMC free article] [PubMed] [Google Scholar]
- 53.Cheetham GM, Steitz TA. Insights into transcription: structure and function of single-subunit DNA-dependent RNA polymerases. Curr Opin Struct Biol. 2000;10(1):117–23. doi: 10.1016/s0959-440x(99)00058-5. [DOI] [PubMed] [Google Scholar]
- 54.Bonner G, Patra D, Lafer EM, Sousa R. Mutations in T7 RNA polymerase that support the proposal for a common polymerase active site structure. EMBO J. 1992;11(10):3767–75. doi: 10.1002/j.1460-2075.1992.tb05462.x. [DOI] [PMC free article] [PubMed] [Google Scholar]
- 55.Rechinsky V, Tunitskaya V, Dragan S, Kostyuk D, Kochetkov S. Tyr-571 is involved in the T7 RNA polymerase binding to its promoter. FEBS Lett. 1993;320(1):9–12. doi: 10.1016/0014-5793(93)81646-h. [DOI] [PubMed] [Google Scholar]
- 56.Sousa R, Mukherjee S. T7 RNA polymerase. Prog Nucleic Acid Res Mol Biol. 2003;73:1–41. doi: 10.1016/s0079-6603(03)01001-8. [DOI] [PubMed] [Google Scholar]
Associated Data
This section collects any data citations, data availability statements, or supplementary materials included in this article.
Supplementary Materials
Supplementary Figure 1. Structures of ligands used for the study: (A) heparin, (B) enoxaparin, (C) bemiparin, (D) fondaparinux and (E) idraparinux.
Supplementary Figure 2. The 2D interaction diagram of T7RNAP and the ligands: (A) heparin, (B) fondaparinux, (C) bemiparin, (D) enoxaparin, and (E) idraparinux.
Supplementary Figure 3. The solvent-accessible surface area of the active site residues of T7RNAP alone and complexes of T7RNAP with the ligands (A) heparin, (B) bemiparin, and (C) enoxaparin during the last 5 ns of simulation trajectories.
Supplementary Figure 4. Secondary structure elements of (A) the crystal structure of T7RNAP complexed with lysozyme and (B) the modeled structure of T7RNAP. The regions of missing residues and secondary structures are shown in black box.
Supplementary Figure 5. (A) The position of Mg2+ ions in the modeled structure with their distances and (B) the average distance they maintained throughout the simulation. Comparison of the closeness of C-terminal end (shown in yellow color) to catalytic center in: (C) the crystal structure with lysozyme (1ARO) and (D) the modeled structure. The average distance maintained by the C-terminal end with catalytic center in the modeled structure throughout the simulation period.