

Abstract
The inter-play between changes in beta-band (14–30-Hz) cortical rhythms and attention during somatosensation informs us about where and when relevant processes occur in the brain. As such, we investigated the effects of attention on somatosensory evoked and induced responses using vibrotactile stimulation and magnetoencephalographic recording. Subjects received trains of vibration at 23 Hz to the right index finger while watching a movie and ignoring the somatosensory stimuli or paying attention to the stimuli to detect a change in the duration of the stimulus. The amplitude of the evoked 23-Hz steady-state response in the contralateral primary somatosensory cortex (SI) was enhanced by attention and the underlying dipole source was located 2 mm more medially, indicating top-down recruitment of additional neuronal populations for the functionally relevant stimulus. Attentional modulation of the somatosensory evoked response indicates facilitation of early processing of the tactile stimulus. Beta-band activity increased after vibration offset in the contralateral primary motor cortex (MI) [event-related synchronization (ERS)] and this increase was larger for attended than ignored stimuli. Beta-band activity decreased in the ipsilateral SI prior to stimulus offset [event-related desynchronization (ERD)] for attended stimuli only. Whereas attention modulation of the evoked response was confined to the contralateral SI, event-related changes of beta-band activity involved contralateral SI–MI and inter-hemispheric SI–SI connections. Modulation of neural activity in such a large sensorimotor network indicates a role for beta activity in higher-order processing.
Keywords: human, magnetoencephalography, rhythm, somatosensory, vibration
Introduction
Top-down modulation of sensory processing through attention allows us to select relevant input from the ever-changing environment while ignoring irrelevant information. A neural correlate of this process has been found in the cortical activity in the primary somatosensory cortex (SI) elicited by tactile stimulation (Baumgartner et al., 1991, 1993; Hari et al., 1993; McLaughlin & Kelly, 1993; Yang et al., 1993; Schaefer et al., 2002), which is modulated by attention (Johansen-Berg & Lloyd, 2000; Braun et al., 2002; Staines et al., 2002; Nelson et al., 2004; Schubert et al., 2008). This evoked response is observed in the time-locked averaged magnetoencephalographic (MEG) data recorded from repeated stimulus presentations. As the rate of periodic tactile stimulation increases above 10 Hz, rapidly adapting mechanoreceptors with small receptive fields are activated (Johansson & Vallbo, 1979) eliciting an oscillatory response at the stimulus frequency in the contralateral SI, termed the somatosensory steady-state response (SSSR) (Galambos, 1982; Snyder, 1992; McLaughlin & Kelly, 1993; Tobimatsu et al., 1999; Pollok et al., 2002; Nangini et al., 2006). The SSSR amplitude is enhanced by attention and reflects top-down facilitation of early sensory processing (Giabbiconi et al., 2004, 2007).
Changes in the magnitude of ongoing cortical rhythms, termed induced responses, are also recorded via magnetoencephalography (Galambos, 1992; Pfurtscheller & Lopes da Silva, 1999). Tactile stimulation causes a suppression of cortical rhythms in the bilateral SI in the beta (14–30-Hz) frequency band, termed ERD. A transient increase of beta activity to above baseline level, termed ERS, occurs after stimulus offset in the bilateral primary motor cortices (MIs). The bilateral nature of the induced responses indicates that cross-hemispheric connections are involved (Cheyne et al., 2003; Gaetz & Cheyne, 2006; Houdayer et al., 2006; Dockstader et al., 2008). Similar induced responses have been observed during movement (Pfurtscheller et al., 1996; Taniguchi et al., 2000; Jurkiewicz et al., 2006) and motor imagery (Schnitzler et al., 1997; Pfurtscheller et al., 2005). Although the evoked responses like the SSSR are probably neuronal responses to primary afferents, the induced responses may represent changes in the functional connectivity within the sensorimotor network (Pfurtscheller & Lopes da Silva, 1999). As such, we expected that attentional load would modulate induced responses in the SI and MI.
Our first hypothesis was that sustained attention would enhance the SSSR amplitude in keeping with a top-down facilitation of early sensory processing. Secondly, we hypothesized that attending to the duration of a vibrotactile stimulus would increase the functional load on the sensorimotor system leading to stronger induced responses in the bilateral SI and MI. To address these hypotheses, we recorded neuromagnetic evoked and induced cortical responses to finger vibration under ignore and attend conditions. In order to support the distinction between neuromagnetic activity in the SI and MI, we also localized the cortical sources of beta ERS and ERD related to voluntary finger movement.
Materials and methods
Subjects
We completed MEG sessions with 12 healthy subjects (seven females) with ages ranging from 21 to 32 (mean 25) years. Right-handedness was quantified using the Edinburgh Handedness Inventory (Oldfield, 1971). All subjects reported no history of neurological disorders. Informed written consent was obtained from each subject before participating in the experiment in accordance with the Declaration of Helsinki and by the Research Ethics Board at Baycrest, which approved the study.
Data acquisition
The MEG data were collected with a 151-channel whole-head first-order gradiometer system (VSM Medtech, Coquitlam, BC, Canada) at a 1250-Hz sampling rate after 300-Hz low-pass filtering. Subjects were sitting in an upright position with their head resting in the helmet-shaped MEG sensor array. The sensor positions with respect to the head were registered with magnetic coils placed on the nasion, and left and right pre-auricular points. Markers at the same locations in the anatomical magnetic resonance images (MRIs) were used for co-registering functional and anatomical data. For the five subjects without an MRI, the MEG data were co-registered with a head shape acquired with a three-dimensional digitization system (Fastrak, Polhemus, Colchester, VT, USA).
Three MEG recordings of 10-min duration per session were performed in random order between subjects: attend and ignore vibrotactile stimulation, and self-paced finger tapping. For vibrotactile stimulation, a small elastic bladder was attached to the right index finger pad and coupled to a compressed air supply via a computer-activated valve. Gentle pressure pulses of 10-ms duration were applied to the finger at a rate of 23 Hz. The stimuli were presented in trains of 3.0-s duration with inter-train intervals of random length between 3.0 and 5.0 s. Such a stimulus has been shown to evoke a reliable SSSR (Nangini et al., 2006). Furthermore, the rather long stimulus duration would provide sufficient temporal separation of the SSSR and the evoked responses to stimulus onset and offset. For 10% of the randomly chosen stimulus trains, the duration was prolonged to 4.0 s. Under the attended condition, subjects were instructed to detect and keep a mental count of the prolonged stimulus trains, while keeping their eyes focused on a fixation cross. No motor responses were required. During the ignore condition, subjects watched a subtitled silent movie. A self-paced motor task was included so that we could compare induced responses for somatosensation with those occurring during a motor task. In the motor task, subjects were asked to press a button with the right index finger once every 4–5 s. Subjects watched a subtitled silent movie and received no feedback regarding the button presses. White noise was presented binaurally at 75-dB sound pressure level in all tasks to mask any sounds associated with the stimulus device or response button.
Analysis of evoked response to tactile stimulation
All subsequent MEG data analyses were based on the 3.0-s duration stimulus trains only. MEG data were parsed into 5.0-s epochs relative to the onsets of the standard stimulus trains including a 1.0-s pre-stimulus interval. Principal components of MEG data epochs that exceeded the threshold of 2.0 pT were removed as magnetic artifacts (Lagerlund et al., 1997; Kobayashi & Kuriki, 1999). The MEG data were then band-pass filtered between 16 and 28 Hz. The steady-state evoked field was obtained by averaging 100-ms epochs of MEG data relative to each of the 57 pulses in the 0.5–3.0-s interval following stimulus train onset in all trials (n = 75). We fit an equivalent current dipole in a single-sphere head model to the averaged steady-state evoked field waveforms using the dipole fit software supplied by VSM Medtech. Changes in the SSSR amplitude and location between attend and ignore conditions were compared with paired t-tests.
Localization of induced responses to tactile stimulation
For localizing the induced responses, we applied synthetic aperture magnetometry [a beamformer approach for estimating source activity based on magnetoencephalography (Robinson & Vrba, 1998)] to generate volumetric maps of the amount of ERD and ERS in the beta frequency range between ‘active’ and ‘control’ time intervals in the attend condition. In concurrence with previous work, the regions of interest for induced responses were the bilateral SI and MI. We identified sources of beta ERD by mapping the change in beta source power between 2–3 s after (‘active’) and 1–0 s before (‘control’) stimulus onset. Similar volumetric maps were generated with the active time interval between 0.5 and 1.5 s post-stimulus offset to identify sources of beta ERS (Fig. 2a). Local maxima for ERD and ERS in the primary sensorimotor areas were identified in the group-averaged volumetric maps. The corresponding locations of maximal effect size in individual volumetric maps determined regions of interest for further analysis.
Fig. 2.

Induced responses during attended vibrotactile stimulation. (a) The diagram shows the time intervals (A / B / C) used for synthetic aperture magnetometry beamformer analysis. (b) Volumetric maps of beta ERS / ERD during stimulation (B vs. A) and following stimulus offset (C vs. A) in a single subject are overlaid on the subject’s structural MRI. Induced responses occur in the ipsilateral SI (ERD) and contralateral MI (ERS). L, left; R, right.
Comparison of source locations to the motor task
Sensorimotor induced responses are located, for the same body part, in close vicinity in the pre-central and post-central gyri. Head movements or exact co-registration between the MEG sensor position and structural MRI might affect the accuracy of the absolute source localization of the induced responses to vibration. Induced ERD during self-paced finger tapping has been identified in previous studies in the bilateral SI with maximal size at the time just prior to the button press. Beta ERS occurs after the movement in the bilateral MI with a contralateral bias (Pfurtscheller et al., 1996; Taniguchi et al., 2000; Jurkiewicz et al., 2006). Therefore, we confirmed the anatomical location of the induced responses to vibration by comparison to the locations of induced responses related to voluntary finger movement. We identified the locations of ERD to movement as the local minima in individual synthetic aperture magnetometry volumetric maps comparing beta power between the 1.0-s interval immediately preceding the button press (‘active’) and an interval of the same length beginning 3.0 s before the button press (‘control’). Sources of beta ERS were identified as local maxima in volumetric maps with the active interval shifted to 0.5–1.5 s post-button press. The relative locations of the sources of ERS and ERD induced by the tactile stimulus, the evoked SSSR, and ERS and ERD related to voluntary finger movement were studied across the group. For this analysis, the individual mean of locations across the various conditions had been subtracted separately for each hemisphere. The resulting relative co-ordinates were averaged across the group and 95% confidence limits for the mean were calculated.
Time–frequency analysis of the induced responses
In addition to volumetric mapping of power changes, synthetic aperture magnetometry also acts as a spatial filter to estimate waveforms of source activity at a specific brain location (Robinson & Rose, 1992). This is often referred to as a virtual deep electrode or a virtual channel. Virtual channels of source activity related to finger vibration were generated for the locations of induced responses identified in individual volumetric maps for attend and ignore conditions. Time–frequency analysis was performed on the estimated source activity to examine the temporal dynamics of the induced responses. Spectrograms of oscillatory power based on a Morlet wavelet were calculated in the 10–30-Hz frequency range and the time interval from 1 s pre-stimulus to 2 s post-stimulus based on single-trial virtual channel data. The evoked response, based on averaging the source activity across trials, was subtracted from each trial in order to evaluate only the induced power in the spectrogram (Ross et al., 2005). Often induced responses are quantified as a percentage change in power from baseline. However, this measure contains a numerical bias towards power increase (100% to + ∞) over power decrease (0–100%). Thus, we used a logarithmic scale to eliminate this bias. For each frequency bin, the spectral power was normalized to the power in the baseline interval (1–0 s before stimulus) and the power ratio was expressed as ERS / ERD(t) = log2(P(t) / Pbase). Under this definition, the ERS / ERD range of ±0.5 corresponds to signal power between 71 and 141% of baseline. To ensure that the baseline was matched across conditions, we tested each frequency bin for a difference in baseline spectral power (Pbase) between conditions using a paired t-test. Normalized spectrograms for each location of interest were averaged across subjects to generate group estimates of the induced responses. We investigated the group mean spectrograms in the attended condition to determine the time–frequency intervals at which induced responses occurred. We then compared the mean amplitudes of each induced response between attend and ignore conditions across the group of subjects using paired t-tests.
The induced responses were further characterized with the group mean power spectrum at each location of interest. The spectra were calculated by averaging the spectrograms of oscillatory power across the time intervals of interest for attend and ignore conditions separately. The baseline time interval was the 1 s prior to stimulus onset and the active intervals were as indicated by white rectangles in Fig. 4. All power spectra generated for a specific location of interest were overlaid to compare absolute source power between conditions and time intervals.
Fig. 4.

Group-averaged spectrograms of induced responses to vibrotactile stimulation at the (a) contralateral MI and (b) ipsilateral SI for the attend (top) and ignore (bottom) conditions. Contralateral beta ERD occurs briefly after stimulus onset and offset followed by a period of ERS. The ipsilateral ERD occurs after onset and prior to stimulus offset. ERD also occurs during the stimulation period in the 10–14-Hz range. White rectangles indicate the time–frequency intervals for which the induced response is significantly enhanced for the attended stimulus.
Results
Behavioral data
During 10 min of vibratory stimulation, subjects received about 11 target stimuli with longer duration. At the end of the attend condition, subjects reported counting 16 longer stimuli on average (SD 9, range 6–31). When asked, all subjects who completed the ignore condition before the attended were not aware that longer duration stimuli were included. In the self-paced finger movement session, the average time between button presses was 6.2 s (SD 2.2 s, range 3.6–11.5 s).
Evoked response
Steady-state evoked fields to vibrotactile stimulation were identified over the contralateral hemisphere in all subjects in both attended and ignore conditions. Figure 1a shows group-averaged cycles of the SSSR for attend (solid line) and ignore (dashed line) conditions. Figure 1b shows the time-course of the evoked response amplitude in the 16–28-Hz band for both conditions. The early peak (~0.1 s) in this plot is the 16–28-Hz component of the somatosensory evoked response to the stimulus onset. Across the group, the mean SSSR source strength (between 0.5 and 3 s after stimulus onset) was 10% larger for attended stimuli (t11 = 2.25, P < 0.05). There were no significant differences in the latency of the SSSR or orientation of the dipole between conditions.
Fig. 1.

Attention-related changes in SSSR amplitude and source location. (a) The time-course of the group-averaged SSSR is shown for the attended and ignore conditions. Stimulus pulse timing is shown as grey-filled boxes. The SSSR magnitude is 0.25 nAm larger for attended stimuli across the group. (b) The envelope of the 16–28-Hz evoked response shows that this enhancement is maintained for the entire stimulus interval. For all subjects, the locations of the SSSR in the attended and ignored conditions are shown with respect to the mean for sagittal (c) and coronal (d) orientations. There is a 2-mm medial shift in SSSR source location for attended stimuli across the group. I, inferior; S, superior; P, posterior; A, anterior; L, left; R, right.
Dipole modeling of the contralateral SSSR was feasible for all subjects under both experimental conditions. Source locations of the SSSR generator were compared between the attended and ignore condition, and the relative differences were visualized in the coronal and sagittal planes in Fig. 1c and d, respectively. Across the group, the equivalent current dipole location was 2.0 mm more medial (t11 = 4.53, P < 0.001) when the vibrotactile stimulus was attended as compared with ignored.
Induced responses
Figure 2b shows the volumetric maps of cortical beta-band ERD and ERS during vibrotactile stimulation (interval B vs. A) and following stimulus offset (interval C vs. A) in the attend condition for an individual representative subject. The maps are superimposed on the subject’s anatomical MRI. Beta ERD during stimulation occurred bilaterally but was more pronounced in the ipsilateral hemisphere. Beta ERS following stimulus offset occurred in the contralateral hemisphere. The ipsilateral beta ERD and contralateral beta ERS were successfully localized based on local minima and maxima in individual volumetric synthetic aperture magnetometry maps in 10 of the 12 subjects.
Comparison to the motor task
Pre-button press beta ERD could be localized in 11 and seven of 12 subjects for the left and right hemispheres, respectively. Post-button press beta ERS was localized in the left and right hemispheres in all 12 and 10 of 12 subjects, respectively. For the induced responses to movement, the source of the contralateral ERS was located 7.7 mm more anterior and 5.0 mm more superior compared with ERD (t10 = 6.00, P < 0.0005), which is consistent with a pre-central source of ERS (MI) and a post-central source of ERD (SI). The ipsilateral ERS to movement was, on average, 8.3 mm more anterior and 4.2 mm more superior compared with ERD (t5 = 2.39, P = 0.06). This difference was not statistically significant, however, probably due to the small number of samples.
Group mean source locations (in Talairach-Tournoux co-ordinates) for the evoked SSSR under attend and ignore conditions, ERS and ERD to vibration under attention, and ERS and ERD during voluntary finger movement are listed in Table 1. We compared the relative source locations of these generators in each hemisphere. Source locations in the left and right hemisphere are visualized in an axial plane in Fig. 3. The origin corresponds to the intra-subject mean location of all of the generators identified in each hemisphere in order to account for the anatomical differences and co-registration errors. The 95% confidence limits of the group mean locations are indicated with ellipses. In the left hemisphere, contralateral to the stimulation or finger movement, we found three distinct brain areas: overlapping sources of ERS following finger movement and tactile stimulation (anterior and medial), sources for the SSSR under attend and ignore conditions in close vicinity (posterior and lateral), and sources of ERD prior to finger movement (posterior and medial). The SSSR sources appeared more laterally compared with the induced response sources. The ERS and ERD sources in the right hemisphere, ipsilateral to stimulation and movement, were significantly separated, although the number of observations was smaller. The ipsilateral sources of ERS following finger movement were, in mean, more anteriorly and medially located than sources of ERD. The thick lines in Fig. 3, separating sources of ERS from sources of ERD and the SSSR, follow the direction of the central sulci in the left and right hemispheres and support the assumption that the origin of ERS lies in the MI and the origin of the SSSR and observed ERD lies in the SI.
Table 1.
Group mean source locations in Talairach-Tournoux co-ordinates (mm)
| Contralateral
|
Ipsilateral
|
|||||
|---|---|---|---|---|---|---|
| [L-R] | [P-A] | [I-S] | [L-R] | [P-A] | [I-S] | |
| Vibration | ||||||
| ERD-off | – | – | – | 34 | −27 | 37 |
| ERS-off | −34 | −21 | 41 | – | – | – |
| SSSR-attend | −42 | −26 | 27 | – | – | – |
| SSSR-ignore | −45 | −26 | 38 | – | – | – |
| Motor | ||||||
| ERS | −36 | −22 | 44 | 29 | −24 | 40 |
| ERD | −37 | −30 | 38 | 34 | −29 | 34 |
[L-R], left-right; [P-A], posterior-anterior; [I-S], inferior-superior.
Fig. 3.
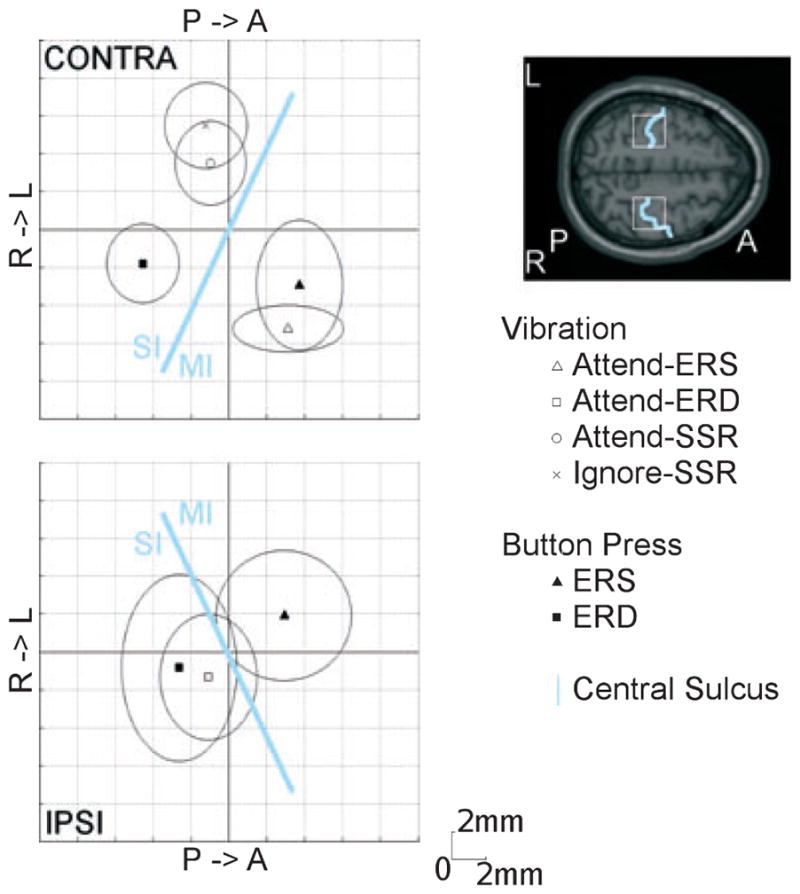
Response locations for vibrotactile stimulation and button pressing. Group mean locations and confidence intervals for the SSSR, contralateral ERS and ipsilateral ERD for attended vibrotactile stimulation, and bilateral ERS and ERD during self-paced tapping (relative to the mean) are shown on axial slices. The estimated positions of the central sulci, SI and MI are shown in light blue. Induced response locations in the SI and MI overlap for somatosensation and movement. The SSSRs localize to more lateral sites in the SI. The central sulci (light blue) and regions of interest (white) are highlighted on the axial slice of a standard brain for reference. L, left; R, right; P, posterior; A, anterior.
Temporal dynamics of induced responses
Figure 4 shows group-averaged spectrograms of induced responses at the source location of the ipsilateral ERD (SI) and contralateral ERS (MI) during attended and ignored vibrotactile stimulation. Note that the evoked responses have been subtracted out of the data and are not present in the spectrograms. Spectograms for the same locations including the evoked responses are shown in supporting Fig. S1. Paired t-tests showed that the power in the pre-stimulus intervals was not significantly different between conditions at an α-value of 0.05. At the contralateral site, post-stimulus beta ERS occurred in both conditions. In addition, we found that, in both conditions, beta ERD followed by ERS occurred twice during presentation of the pulse train. Beta ERD occurred during the 0.5 s following stimulus onset and was followed immediately by 1 s of beta ERS. A similar pattern occurred at vibration offset. At the ipsilateral site, beta ERD occurred after stimulus onset for attended and ignored vibration. Beta ERD began again 2.0 s after the onset of attended stimulus and was strongest at the offset. This induced desynchronization was virtually absent in the ignore condition. ERD also occurred bilaterally in the mu band (~12 Hz) and ipsilaterally at ~23 Hz following stimulus onset and continued until after stimulus offset.
The rectangles in Fig. 4 identify the time–frequency intervals used to calculate the mean power change for each induced response. Paired t-tests showed that attention enhanced the ipsilateral ERD occurring maximally at stimulus offset (t9 = 3.46, P < 0.01) and the contralateral ERS response occurring after stimulus offset (t9 = 2.37, P < 0.050). Across the group, the ipsilateral ERD at vibration offset reduced mean beta-band power by 26% for attended stimuli and 8% for ignored stimuli. The contralateral ERS following attended vibration offset represented a mean increase in cortical oscillatory power of 35% as compared with 8% for ignored stimuli.
Figure 5 shows the absolute power spectra for the contralateral MI and ipsilateral SI sources for the baseline and during the induced response intervals in both conditions. These spectra highlight the changes that contribute most strongly to the ERD / ERS in Fig. 4. At the contralateral MI, baseline source power is well matched between conditions, with no clear peaks in the beta range. Thus, the attention-modulated post-stimulus beta ERS is clearly caused by the strong peak emerging in the active interval for attended stimuli only (solid blue line). In contrast, peaks in the baseline power spectra at the ipsilateral SI indicate beta-band cortical activity occurring prior to stimulus onset in both attend and ignore conditions. A post-hoc paired t-test indicated a significant attention-related enhancement of baseline beta power at this location (t9 = 2.34, P < 0.05), which contributed to the ipsilateral ERD effect. During the active interval, beta-band oscillatory activity was slightly attenuated for ignored stimuli (solid black line) and more strongly suppressed for attended stimuli (solid blue line) such that it closely resembled the contralateral MI baseline spectrum. An additional post-hoc paired t-test indicated that the baseline beta power was larger in the ipsilateral SI than in the contralateral MI for the attend condition (t9 = 2.38, P < 0.05).
Fig. 5.
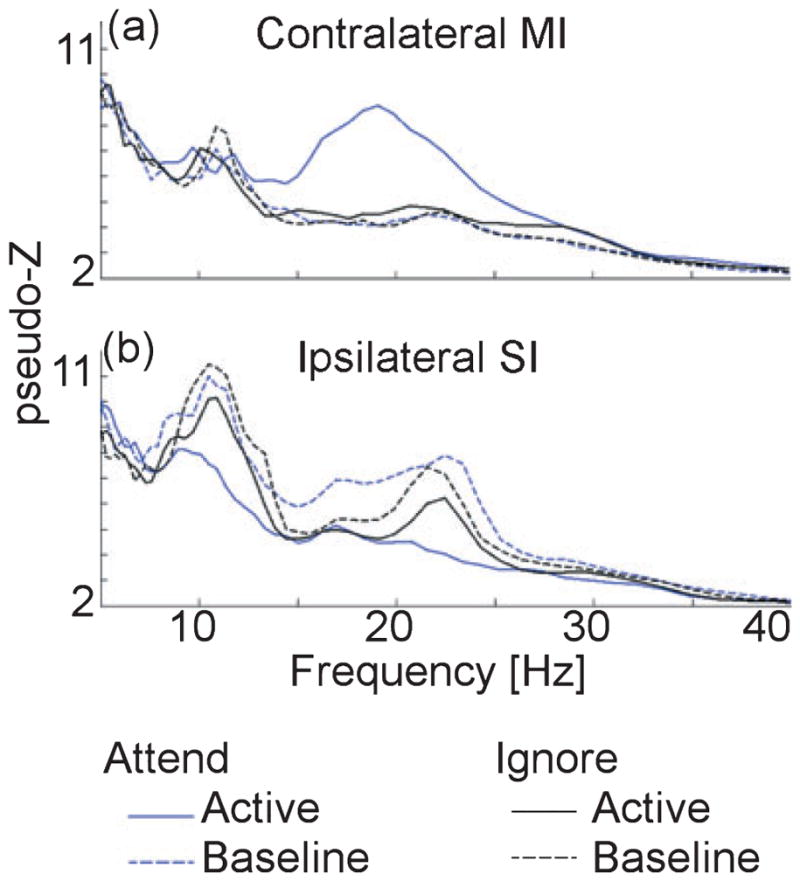
Group-averaged power spectra of cortical activity during the pre-stimulus (dashed lines) and active (solid lines) time interval as indicated in Fig. 4 are shown for the (a) contralateral MI and (b) ipsilateral SI in the attend (blue lines) and ignore (black lines) conditions.
Discussion
We have shown that manipulating attention to a vibrotactile stimulus changes the evoked and induced responses in primary sensorimotor areas. We confirmed that the stimulus-evoked SSSR in the contra-lateral SI is enhanced by attention and we showed that this change in amplitude is concurrent with a medial shift in location. Ipsilaterally dominant ERD towards the end of stimulation was strongly expressed in the SI under attention and almost absent in the ignore condition. Even though there was no motor task in the vibrotactile stimulation sessions, beta ERS following stimulus offset occurred in the contralateral MI in both conditions and was significantly enhanced for attended stimuli. The attention-modulated beta ERS and ERD were co-located with similar induced responses in a motor task.
Attention modulation of the evoked response
The SSSR (interpreted as superimposed responses to single pulses within the stimulus train) represents early activation in the sensory system (Galambos, 1982; McLaughlin & Kelly, 1993). The finding that focused attention enhances the amplitude of SSSR concurs with previous reports of electroencephalography studies on selective spatial attention (Giabbiconi et al., 2004, 2007). Our result generalizes the selective attention effect on this correlate of early processing to a focused attention paradigm. Although the magnitude of the SSSR increase was small, the effect size is of similar order to findings of attention modulation of steady-state responses in the auditory (Ross et al., 2004; Bidet-Caulet et al., 2007) and visual (Ding et al., 2006; Kim et al., 2007) systems. As the primary afferent input was the same in both conditions, the finding of a significant amplitude enhancement by attention represents a top-down modulation of early processing in the SI. We think that the medial shift in the SSSR locations from ignore to attended conditions is more likely to be due to broadening of the area of activation, rather than to a different location of the activation. The widespread activity along the gyrus will give an equivalent dipole that is located deeper than a very focal activation on the superficial gyrus. Given that an area of cortex of the order of several mm2 must be firing synchronously to generate an evoked response (Hari, 1990), this selectively activated neuronal set probably overlaps the population that is activated for the vibratory stimulus in general.
Attention modulation of the induced responses
The temporal dynamics of the induced responses occurring over the stimulus interval were more complex than initially expected. Although previous reports of prolonged tactile stimulation (finger brushing) report ongoing beta ERD for the duration of the stimulus, followed by beta ERS after the offset (Gaetz & Cheyne, 2006), our results show that a contralateral beta ERD / ERS complex occurred once after onset of the stimulus train and again after stimulus offset. This discrepancy probably occurs as brushing a large area of the finger may sequentially activate multiple different receptive fields over time but stationary vibration repetitively activates the same set of mechanoreceptors in the finger pad. The ERD / ERS complex could result mainly from change detection in a similar manner to the sensory evoked response, responding to the onset and offset but ignoring the intervening vibration. However, our observation that the ipsilateral ERD began well before stimulus offset indicates that this response is probably elicited by endogenous processes. In this sense, the induced responses described here are probably related to the perception of primary afferents in general, as well as deeper processing of task-related stimulus properties, such as duration.
We showed that changes in attention modulate the amplitude of the beta ERS that occurs in the contralateral MI following tactile stimulation. This enhancement occurs in the absence of any attention-related changes in cortical oscillatory power in the pre-stimulus interval. Previous evidence for attention-modulated MI activity induced by sensory stimulation came from the observation that beta ERS following median nerve stimulation was smaller and lasted for a shorter duration in children with attention-deficit hyperactivity disorder compared with healthy controls (Dockstader et al., 2008). The electrical stimulation used in their study is quite salient and may capture attention as a bottom-up effect, whereas our faint vibration stimuli were easy to ignore. Detecting the 4.0-s target stimuli in our study required explicit attention. Naive subjects reported no knowledge of the inclusion of longer duration stimuli in the ignore condition, suggesting that the unattended stimulus was registered but that higher-order processing of its properties probably did not occur. In the attend condition, requiring subjects to make a judgment on the stimulus duration necessitated sustained integration of somatic information and comparison to a ‘standard’ within a larger sensorimotor network. The task was difficult and the attention-related enhancement of the post-stimulus contralateral ERS can be interpreted as a correlate of increased task load in sensorimotor areas in the preceding interval. In this sense, beta ERS seems to be a reliable indicator of functional load during sensorimotor tasks.
Perhaps the most intriguing result was beta ERD that occurred prior to stimulus offset in the ipsilateral hemisphere. Given that beta ERD is thought to represent an increase in processing in local brain areas (Pfurtscheller & Lopes da Silva, 1999), the attention-specific suppression of beta-band ipsilateral SI activity suggests a functional role for this area in evaluating the duration of prolonged stimuli. In a functional MRI study, ipsilateral MI activation during unimanual movements increased with task complexity, suggesting that the ipsilateral hemisphere may assist contralateral sensorimotor areas via cross-callosal projections when the functional demand is high (Verstynen et al., 2005). The ipsilateral SI may capitalize on similar projections to assist in the analysis of complex properties of somatosensory input.
Interestingly, observing the absolute signal power, as shown in Fig. 5, informs our understanding of how cortical rhythms are changing in this task. Our data showed that attention-related enhancement of the ipsilateral ERD occurred as a combination of increased baseline power and decreased ‘active’ power. In the attend condition, the signal power in the ipsilateral SI during ERD was at a level similar to the contralateral MI baseline. A previous report looked at absolute signal power, in the 8–12-Hz band, at electrodes over primary sensorimotor cortices during unimanual movements. They indicated that baseline power was lateralized toward the ipsilateral hemisphere as a priming effect but power was equivalent between hemispheres during movement (ERD) and post-movement (ERS). The lateralization of baseline power led effectively to stronger ERD and weaker ERS in the ipsilateral hemisphere (Pfurtscheller, 1992). Recent studies have reported that both ERD and ERS are stronger in the contralateral hemisphere during unimanual movements in contrast to this earlier finding (Pfurtscheller et al., 1996; Taniguchi et al., 2000; Jurkiewicz et al., 2006). Our results show that lateralization of baseline power also occurs for unimanual tactile stimulation under attend and ignore conditions. This implies some underlying bias of the beta rhythm in relation to the stimulated hemi-field, even in the presence of a distractor task. Furthermore, although differences in baseline power between spectrograms in Fig. 4 do not affect the time-courses of ERS and ERD, these differences will change the scale of the observed effect. Induced response magnitudes measured as relative power change are enhanced (for the same absolute difference) when the baseline power is small. Thus, we emphasize the importance of investigating absolute signal strength, as well as measures of signal change, when investigating induced responses.
Comparison of evoked and induced changes
In this paradigm, we observed two types of oscillatory brain activity (evoked and induced) in overlapping time–frequency intervals generated in neighboring cortical sources. Both types of responses were enhanced by focused attention but probably reflect different aspects of top-down modulation of sensory processing. The induced responses exhibited more complicated temporal dynamics than the changes to the evoked SSSR. Although the attention-related enhancement of the SSSR occurred across the entire stimulus duration, beta ERD and ERS were enhanced specifically near the end of the stimulus and after offset, respectively. Thus, the SSSR enhancement may reflect sustained top-down attentional facilitation of early sensory processing. The induced activity may represent aspects of linking that information to ongoing perceptuomotor behavior in a larger sensorimotor network.
The source localization results from our study support the conventional view that ERS is generated in the MI and ERD occurs in the SI for both motor tasks and tactile sensation. This behavior is distinct from the primary evoked responses, which occur in the relevant primary sensory cortex. Although both beta ERD and SSSR occur in the SI, the SSSR clearly localizes more laterally, adding further support to the notion that these responses represent different processes. Attention-related changes reported in functional MRI studies (Staines et al., 2002; Nelson et al., 2004), where induced and evoked responses are not differentiated, probably represent modulations in both early sensory and higher-order processing.
Supplementary Material
Acknowledgments
This study was supported by grants from the Canadian Institutes of Health Research (81135) and the Canadian Foundation for Innovation.
Abbreviations
- ERD
event-related desynchronization
- ERS
event-related synchronization
- MEG
magnetoencephalographic
- MI
primary motor cortex
- MRI
magnetic resonance image
- SI
primary somatosensory cortex
- SSSR
somatosensory steady-state response
Footnotes
Additional supporting information may be found in the online version of this article:
Fig. S1. Group-averaged spectrograms of source power change from baseline during vibrotactile stimulation at the contralateral MI and ipsilateral SI for the attend and ignore conditions.
Please note: As a service to our authors and readers, this journal provides supporting information supplied by the authors. Such materials are peer-reviewed and may be re-organized for online delivery, but are not copy-edited or typeset by Wiley-Blackwell. Technical support issues arising from supporting information (other than missing files) should be addressed to the authors.
References
- Baumgartner C, Doppelbauer A, Deecke L, Barth DS, Zeitlhofer J, Lindinger G, Sutherling WW. Neuromagnetic investigation of somatotopy of human hand somatosensory cortex. Exp Brain Res. 1991;87:641–648. doi: 10.1007/BF00227089. [DOI] [PubMed] [Google Scholar]
- Baumgartner C, Doppelbauer A, Sutherling WW, Lindinger G, Levesque MF, Aull S, Zeitlhofer J, Deecke L. Somatotopy of human hand somatosensory cortex as studied in scalp EEG. Electroencephalogr Clin Neurophysiol. 1993;88:271–279. doi: 10.1016/0168-5597(93)90051-p. [DOI] [PubMed] [Google Scholar]
- Bidet-Caulet A, Fischer C, Besle J, Aguera PE, Giard MH, Bertrand O. Effects of selective attention on the electrophysiological representation of concurrent sounds in the human auditory cortex. J Neurosci. 2007;27:9252–9261. doi: 10.1523/JNEUROSCI.1402-07.2007. [DOI] [PMC free article] [PubMed] [Google Scholar]
- Braun C, Haug M, Wiech K, Birbaumer N, Elbert T, Roberts LE. Functional organization of primary somatosensory cortex depends on the focus of attention. Neuroimage. 2002;17:1451–1458. doi: 10.1006/nimg.2002.1277. [DOI] [PubMed] [Google Scholar]
- Cheyne D, Gaetz W, Garnero L, Lachaux JP, Ducorps A, Schwartz D, Varela FJ. Neuromagnetic imaging of cortical oscillations accompanying tactile stimulation. Brain Res Cogn Brain Res. 2003;17:599–611. doi: 10.1016/s0926-6410(03)00173-3. [DOI] [PubMed] [Google Scholar]
- Ding J, Sperling G, Srinivasan R. Attentional modulation of SSVEP power depends on the network tagged by the flicker frequency. Cereb Cortex. 2006;16:1016–1029. doi: 10.1093/cercor/bhj044. [DOI] [PMC free article] [PubMed] [Google Scholar]
- Dockstader C, Gaetz W, Cheyne D, Wang F, Castellanos FX, Tannock R. MEG event-related desynchronization and synchronization deficits during basic somatosensory processing in individuals with ADHD. Behav Brain Funct. 2008;4:8. doi: 10.1186/1744-9081-4-8. [DOI] [PMC free article] [PubMed] [Google Scholar]
- Gaetz W, Cheyne D. Localization of sensorimotor cortical rhythms induced by tactile stimulation using spatially filtered MEG. Neuroimage. 2006;30:899–908. doi: 10.1016/j.neuroimage.2005.10.009. [DOI] [PubMed] [Google Scholar]
- Galambos R. Tactile and auditory stimuli repeated at high rates (30–50 per sec) produce similar event related potentials. Ann N Y Acad Sci. 1982;388:722–728. doi: 10.1111/j.1749-6632.1982.tb50841.x. [DOI] [PubMed] [Google Scholar]
- Galambos R. A comparison of certain gamma band (40-Hz) brain rhythms in cat and man. In: Basar E, Bullock TH, editors. Induced Rhythms in the Brain. Birkhauser; Boston: 1992. pp. 201–216. [Google Scholar]
- Giabbiconi CM, Dancer C, Zopf R, Gruber T, Muller MM. Selective spatial attention to left or right hand flutter sensation modulates the steady-state somatosensory evoked potential. Brain Res Cogn Brain Res. 2004;20:58–66. doi: 10.1016/j.cogbrainres.2004.01.004. [DOI] [PubMed] [Google Scholar]
- Giabbiconi CM, Trujillo-Barreto NJ, Gruber T, Muller MM. Sustained spatial attention to vibration is mediated in primary somatosensory cortex. Neuroimage. 2007;35:255–262. doi: 10.1016/j.neuroimage.2006.11.022. [DOI] [PubMed] [Google Scholar]
- Hari R. Magnetic evoked fields of the human brain: basic principles and applications. Electroencephalogr Clin Neurophysiol Suppl. 1990;41:3–12. doi: 10.1016/b978-0-444-81352-7.50005-4. [DOI] [PubMed] [Google Scholar]
- Hari R, Karhu J, Hamalainen M, Knuutila J, Salonen O, Sams M, Vilkman V. Functional organization of the human first and second somatosensory cortices: a neuromagnetic study. Eur J Neurosci. 1993;5:724–734. doi: 10.1111/j.1460-9568.1993.tb00536.x. [DOI] [PubMed] [Google Scholar]
- Houdayer E, Labyt E, Cassim F, Bourriez JL, Derambure P. Relationship between event-related beta synchronization and afferent inputs: analysis of finger movement and peripheral nerve stimulations. Clin Neurophysiol. 2006;117:628–636. doi: 10.1016/j.clinph.2005.12.001. [DOI] [PubMed] [Google Scholar]
- Johansen-Berg H, Lloyd DM. The physiology and psychology of selective attention to touch. Front Biosci. 2000;5:D894–904. doi: 10.2741/A558. [DOI] [PubMed] [Google Scholar]
- Johansson RS, Vallbo AB. Tactile sensibility in the human hand: relative and absolute densities of four types of mechanoreceptive units in glabrous skin. J Physiol. 1979;286:283–300. doi: 10.1113/jphysiol.1979.sp012619. [DOI] [PMC free article] [PubMed] [Google Scholar]
- Jurkiewicz MT, Gaetz WC, Bostan AC, Cheyne D. Post-movement beta rebound is generated in motor cortex: evidence from neuromagnetic recordings. Neuroimage. 2006;32:1281–1289. doi: 10.1016/j.neuroimage.2006.06.005. [DOI] [PubMed] [Google Scholar]
- Kim YJ, Grabowecky M, Paller KA, Muthu K, Suzuki S. Attention induces synchronization-based response gain in steady-state visual evoked potentials. Nat Neurosci. 2007;10:117–125. doi: 10.1038/nn1821. [DOI] [PubMed] [Google Scholar]
- Kobayashi T, Kuriki S. Principal component elimination method for the improvement of S / N in evoked neuromagnetic field measurements. IEEE Trans Biomed Eng. 1999;46:951–958. doi: 10.1109/10.775405. [DOI] [PubMed] [Google Scholar]
- Lagerlund TD, Sharbrough FW, Busacker NE. Spatial filtering of multichannel electroencephalographic recordings through principal component analysis by singular value decomposition. J Clin Neurophysiol. 1997;14:73–82. doi: 10.1097/00004691-199701000-00007. [DOI] [PubMed] [Google Scholar]
- McLaughlin DF, Kelly EF. Evoked potentials as indices of adaptation in the somatosensory system in humans: a review and prospectus. Brain Res Brain Res Rev. 1993;18:151–206. doi: 10.1016/0165-0173(93)90001-g. [DOI] [PubMed] [Google Scholar]
- Nangini C, Ross B, Tam F, Graham SJ. Magnetoencephalographic study of vibrotactile evoked transient and steady-state responses in human somatosensory cortex. Neuroimage. 2006;33:252–262. doi: 10.1016/j.neuroimage.2006.05.045. [DOI] [PubMed] [Google Scholar]
- Nelson AJ, Staines WR, Graham SJ, McIlroy WE. Activation in SI and SII: the influence of vibrotactile amplitude during passive and task-relevant stimulation. Brain Res Cogn Brain Res. 2004;19:174–184. doi: 10.1016/j.cogbrainres.2003.11.013. [DOI] [PubMed] [Google Scholar]
- Oldfield RC. The assessment and analysis of handedness: the Edinburgh inventory. Neuropsychologia. 1971;9:97–113. doi: 10.1016/0028-3932(71)90067-4. [DOI] [PubMed] [Google Scholar]
- Pfurtscheller G. Event-related synchronization (ERS): an electrophysiological correlate of cortical areas at rest. Electroencephalogr Clin Neurophysiol. 1992;83:62–69. doi: 10.1016/0013-4694(92)90133-3. [DOI] [PubMed] [Google Scholar]
- Pfurtscheller G, Lopes da Silva FH. Event-related EEG / MEG synchronization and desynchronization: basic principles. Clin Neurophysiol. 1999;110:1842–1857. doi: 10.1016/s1388-2457(99)00141-8. [DOI] [PubMed] [Google Scholar]
- Pfurtscheller G, Stancak A, Jr, Neuper C. Post-movement beta synchronization. A correlate of an idling motor area. Electroencephalogr Clin Neurophysiol. 1996;98:281–293. doi: 10.1016/0013-4694(95)00258-8. [DOI] [PubMed] [Google Scholar]
- Pfurtscheller G, Neuper C, Brunner C, da Silva FL. Beta rebound after different types of motor imagery in man. Neurosci Lett. 2005;378:156–159. doi: 10.1016/j.neulet.2004.12.034. [DOI] [PubMed] [Google Scholar]
- Pollok B, Moll M, Schmitz F, Muller K, Schnitzler A. Rapid mapping of finger representations in human primary somatosensory cortex applying neuromagnetic steady-state responses. Neuroreport. 2002;13:235–238. doi: 10.1097/00001756-200202110-00012. [DOI] [PubMed] [Google Scholar]
- Robinson SE, Rose DF. Current source estimation by spatially filtered MEG. In: Romani G, editor. Biomagnetism: Clinical Aspects. Excerpta Medica; Amsterdam: 1992. pp. 761–765. [Google Scholar]
- Robinson SE, Vrba J. Functional Neuroimaging by Synthetic Aperture Magnetometry (SAM) In: Yoshimoto T, Kotani M, Kuriki S, Karibe H, Nakasato N, editors. Recent Advances in Biomagnetism. Tohuku University Press; Sendai: 1998. pp. 302–305. [Google Scholar]
- Ross B, Picton TW, Herdman AT, Pantev C. The effect of attention on the auditory steady-state response. Neurol Clin Neurophysiol. 2004;2004:22. [PubMed] [Google Scholar]
- Ross B, Herdman AT, Pantev C. Stimulus induced desynchronization of human auditory 40-Hz steady-state responses. J Neurophysiol. 2005;94:4082–4093. doi: 10.1152/jn.00469.2005. [DOI] [PubMed] [Google Scholar]
- Schaefer M, Muhlnickel W, Grusser SM, Flor H. Reproducibility and stability of neuroelectric source imaging in primary somatosensory cortex. Brain Topogr. 2002;14:179–189. doi: 10.1023/a:1014598724094. [DOI] [PubMed] [Google Scholar]
- Schnitzler A, Salenius S, Salmelin R, Jousmaki V, Hari R. Involvement of primary motor cortex in motor imagery: a neuromagnetic study. Neuroimage. 1997;6:201–208. doi: 10.1006/nimg.1997.0286. [DOI] [PubMed] [Google Scholar]
- Schubert R, Ritter P, Wustenberg T, Preuschhof C, Curio G, Sommer W, Villringer A. Spatial attention related SEP amplitude modulations covary with BOLD signal in S1–a simultaneous EEG–fMRI study. Cereb Cortex. 2008;18:2686–2700. doi: 10.1093/cercor/bhn029. [DOI] [PubMed] [Google Scholar]
- Snyder AZ. Steady-state vibration evoked potentials: descriptions of technique and characterization of responses. Electroencephalogr Clin Neurophysiol. 1992;84:257–268. doi: 10.1016/0168-5597(92)90007-x. [DOI] [PubMed] [Google Scholar]
- Staines WR, Graham SJ, Black SE, McIlroy WE. Task-relevant modulation of contralateral and ipsilateral primary somatosensory cortex and the role of a prefrontal-cortical sensory gating system. Neuroimage. 2002;15:190–199. doi: 10.1006/nimg.2001.0953. [DOI] [PubMed] [Google Scholar]
- Taniguchi M, Kato A, Fujita N, Hirata M, Tanaka H, Kihara T, Ninomiya H, Hirabuki N, Nakamura H, Robinson SE, Cheyne D, Yoshimine T. Movement-related desynchronization of the cerebral cortex studied with spatially filtered magnetoencephalography. Neuroimage. 2000;12:298–306. doi: 10.1006/nimg.2000.0611. [DOI] [PubMed] [Google Scholar]
- Tobimatsu S, Zhang YM, Kato M. Steady-state vibration somatosensory evoked potentials: physiological characteristics and tuning function. Clin Neurophysiol. 1999;110:1953–1958. doi: 10.1016/s1388-2457(99)00146-7. [DOI] [PubMed] [Google Scholar]
- Verstynen T, Diedrichsen J, Albert N, Aparicio P, Ivry RB. Ipsilateral motor cortex activity during unimanual hand movements relates to task complexity. J Neurophysiol. 2005;93:1209–1222. doi: 10.1152/jn.00720.2004. [DOI] [PubMed] [Google Scholar]
- Yang TT, Gallen CC, Schwartz BJ, Bloom FE. Noninvasive somatosensory homunculus mapping in humans by using a large-array biomagnetometer. Proc Natl Acad Sci USA. 1993;90:3098–3102. doi: 10.1073/pnas.90.7.3098. [DOI] [PMC free article] [PubMed] [Google Scholar]
Associated Data
This section collects any data citations, data availability statements, or supplementary materials included in this article.