

Abstract
Compound muscle action potentials (CMAPs) recorded using surface electrodes are often used to assess the excitability of neural pathways to skeletal muscle. However, the amplitude of CMAPs can be influenced by changes at the recording site, independent of mechanisms within the central nervous system. We quantified how joint angle and background contraction influenced CMAP amplitude. In seven subjects CMAPs evoked by supramaximal transcutaneous electrical stimulation of motor axons (Mmax) were recorded using surface electrodes from soleus and tibialis anterior (TA) at static positions over the full range of ankle movement at 5° intervals. Across subjects the peak-to-peak amplitude of Mmax was 155% and 159% larger at the shortest than longest muscle lengths for soleus and TA, respectively. In five subjects the effect of ankle position and voluntary contraction on M-wave/H-reflex recruitment curves was assessed in the soleus. Both ankle position and level of contraction significantly influenced Mmax, Hmax, and the Hmax to Mmax ratio, but there were no interactions between the two parameters. These peripheral changes that influence Mmax will also impact other CMAPs such as submaximal M-waves, H-reflexes, and responses to transcranial magnetic stimulation. As such, during experimental studies CMAPs evoked at a given joint angle and contraction level should be normalized to Mmax recorded at similar joint angle and contraction strength.
Keywords: compound muscle action potential, contraction level, muscle length, M-wave, reflex
Much of our understanding of the neural control of human movement comes from evoked-potential studies in which peripheral nerves or cortical structures are stimulated and responses are recorded as compound muscle action potentials (CMAPs). CMAPs are also used for clinical purposes. For most applications, CMAPs are recorded using surface electromyography (EMG), with electrodes placed on the skin. Changes in the amplitude of CMAPs such as H reflexes and motor-evoked potentials (MEPs; evoked by transcranial magnetic stimulation of the motor cortex) are taken to infer excitability changes within the central nervous system (CNS). However, CMAP amplitude can also be influenced by changes in muscle length9–11 and background contraction,18,30 and this could compromise measurements of neural excitability.
Stimulation of motor axons in peripheral nerves generates a CMAP known as the M wave. The M-wave pathway does not traverse the spinal cord and hence M-wave amplitude is not influenced by excitability changes within the CNS. In addition, with low-frequency stimulation, M-wave amplitude is not normally altered by changes in transmission across the neuromuscular junction or along the sarcolemma. Accordingly, M-wave amplitude is often used as a measure of stimulus constancy during reflex studies. When delivered at supramaximal intensities, all motor axons are recruited and a maximal M wave (Mmax) is evoked despite small movements that may occur between the stimulating electrode and nerve. In this way, Mmax can be used to assess how changes at the recording site influence CMAP amplitude. Length-dependent changes in submaximal M-wave amplitude, shape, and duration have been demonstrated for soleus,9–11 although it is difficult to determine whether submaximal M-wave modulation is due to changes in the effective stimulus strength or factors at the muscle.
Supramaximal stimulation of the median nerve at the wrist has shown that Mmax in the thenar muscles is strongly influenced by muscle length.15 The Mmax waveform was largest (measured peak-to-peak) and its duration shortest at short muscle lengths. For leg muscles the relationship is less clear. Mmax amplitude changes during different phases of cyclic movements such as walking6,34,35 and cycling,16 and is generally larger when the muscle is short, but this is confounded by simultaneously changing contraction amplitudes. One group found that the peak-to-peak amplitude of Mmax in tibialis anterior (TA)increased24 and in soleus decreased33 with reduction in muscle length. Hwang14 excluded four of 15 subjects because Mmax in soleus changed significantly with joint angle. Moreover, a recent study showed that Mmax in soleus increased with a reduction in muscle length when three joint angles were tested.31
Changes in muscle length can occur independently from changes in joint angle. For example, during isometric contractions whole muscle length can decrease considerably even though joint angle remains constant.12 During increasing isometric contractions, one study showed larger Mmax amplitudes,30 whereas a similar study showed no significant changes in Mmax.20 Whether a change in muscle length influences Mmax amplitude during voluntary contractions and simultaneously varying joint angles is unknown. Clearly, the relationship between background contraction and joint angle requires elucidation.
Modeling studies indicate that CMAP amplitude should decrease, and CMAP duration should increase, with increasing muscle length when EMG recordings are made under simple conditions (e.g., a single innervation zone and uniform pennation angle).26,27 However, it is not clear whether muscle length has an appreciable effect on CMAP amplitude under the specific experimental conditions typically used in motor control research. It is of particular interest to determine the relationship between muscle length, contraction level, and CMAP amplitude for the soleus muscle, since much of our understanding of task- and phase-dependent regulation of reflexes is based on studies involving this muscle in humans.28,37 The present experiments were designed to quantify the influence of muscle length and background contraction and the potential interaction between these parameters on the amplitude of CMAPs recorded using surface EMG from muscles that flex and extend the ankle. Moreover, since the distance from the electrodes to the innervation zone and the inclination of muscle fibers influences the recorded signal,5 we recorded surface EMG from multiple sites where it is known that the inclination of muscle fibers are different and at varying distances from the innervation zones.
Therefore, the main objectives of this study were to quantify systematically the amplitude of Mmax in the ankle musculature over the full range of ankle joint positions (muscle lengths) and to assess the effect of voluntary isometric contractions on M-wave and H-reflex amplitudes at different joint angles. A few recording sites for both muscles were used to determine whether length-dependent changes in CMAP amplitude were influenced by pennation angle within a muscle and by the distance from the recording sites to the innervation zone. Furthermore, we studied the effects of joint angle on the average, rectified EMG amplitude recorded during maximal voluntary contractions (MVCs). Data were recorded from both soleus and TA to determine whether the influence of joint angle and background contraction were similar for muscles with markedly different architectures. Some of these data have been published previously in abstract form.7
MATERIALS AND METHODS
Subjects
Seven volunteers (22–40 years of age) of average fitness level (i.e., no competitive athletes) with no known neurological conditions participated after providing informed written consent. The experiments were conducted in accordance with the Declaration of Helsinki and were approved by the University of Alberta Human Research Ethics Board. Each experimental session lasted 2–3 h.
The tibial nerve was stimulated in the popliteal fossa to evoke responses in soleus and the common peroneal nerve was stimulated below the head of the fibula to elicit responses in TA. The stimulation (1-ms square-wave pulses) was delivered using bipolar surface electrodes (2.5 cm2; Kendall, Chicopee, Massachusetts), interelectrode distance of 1 cm, and a Grass S88 stimulator connected in series with SIU5 isolator and CCU1 constant current units (Grass Instruments, AstroMed, Slough, UK). In all stimulation trials current was measured with an electromagnetic current probe (mA-2000 noncontact milliammeter, Bell Technologies, Orlando, Florida).
Surface EMG was recorded from three sites over soleus using pairs of electrodes (2.5 cm2; Kendall; 1 cm interelectrode distance) placed on the lateral, middle, and medial surfaces of soleus and two sites over TA (proximal and distal), as shown in Figure 1A, to determine whether fiber architecture and the distance from recording site to innervation zone influenced surface EMG. The signals were amplified 200–2,000 times and bandpass-filtered at 30–3,000 HZ using Grass P511 amplifiers.
FIGURE 1.

(A) Electrode placement for three (medial, left-most pair; middle, middle pair; lateral, right-most pair) and two (proximal and distal) EMG recording sites on soleus and TA, respectively. (B) Schematic of measurements made on the Mmax wave-form. Integrated EMG amplitude indicated by hatched area.
Protocol
For each subject, data were recorded with the ankle in static positions at 5° increments over the range of ankle movement. Mmax was recorded while subjects remained relaxed and MVCs were performed at these same static positions. Data were collected from soleus and TA muscles in separate sessions. Subjects were seated with the knee at ~110°. The right foot was firmly attached to an adjustable footplate equipped to measure isometric force. The ankle of every subject was first placed where the shank and the foot formed a right angle, which was subsequently termed the neutral or 0° angle. The joint angle was then moved at 5° intervals throughout the range of motion in both flexion and extension. From the neutral angle, flexed positions were assigned negative values and extended positions were assigned positive values. Most subjects achieved a range of −20° to 40°; however, not all subjects comfortably reached 40°, so group analyses and group data in the figures only include −20° to 35°. At each position five M waves were evoked using a supramaximal stimulation intensity (≥2 times Mmax threshold) at an interstimulus interval of 3–5 s. Subjects performed one 3-s MVC at each position. They were provided with feedback of lowpass-filtered EMG activity on an oscilloscope and were given verbal encouragement to perform maximally. At least 1 min of rest was provided between successive MVC trials. The order for testing Mmax and MVC trials at the different joint angles was randomized, as was the order of joint positions within and between subjects.
Recruitment curves were constructed from data recorded at three positions (−10°, 10°, and 30°). At each of these positions 50 stimuli were delivered at intensities ranging from below the threshold for any response to approximately three times Mmax threshold. For TA, data were collected while subjects remained relaxed. For soleus, separate recruitment curves were constructed using data recorded while subjects (n = 5) remained relaxed or maintained one of three contraction levels (low: ~10% MVC; medium: ~20% MVC; high: ~30% MVC). Visual feedback of the contraction levels was provided using lowpass-filtered EMG from the middle soleus only, since this is the site generally recorded in experimental studies. Thus, the relationship between contraction level and joint angle is reported solely for the middle soleus. Stimulation was delivered pseudorandomly once every 1.5–3 s.
Data Acquisition and Analysis
Data were sampled at 5,000 HZ and 1,000 HZ for Mmax and MVC trials, respectively, using a 12-bit A/D converter controlled by custom-written computer software (Labview, National Instruments, Austin, Texas). For Mmax trials, data were collected for 300 ms with a 50-ms pre-stimulus window. Force was recorded using an Omega (LCCB-500, Stamford, Connecticut) force transducer.
Five measurements were made offline from each Mmax trial using custom-written software (Matlab, Natick, Massachusetts), as shown in Figure 1B. The three measurements of amplitude included the peak-to-peak of the unrectified EMG signal, the area under the rectified EMG signal (hatched area under the curve), and peak force. The two other measurements included the latency to the first large EMG peak and the duration measured between the largest positive and negative peaks. For the MVC data, the rectified EMG and force were averaged over a 1-s window centered on the peak force. For recruitment curve analyses, Mmax and Hmax were calculated as the mean of the three largest responses of each type.
One-factor repeated measures analysis of variance (ANOVA) tests were used to identify significant main effects for joint position for all recording sites of soleus and TA. The peak-to-peak and integrated EMG amplitude of Mmax, the latency of first Mmax peak, Mmax duration, twitch and voluntary force values, and the average rectified EMG recorded during MVC were the dependent variables and joint angle and contraction amplitude were the independent variables. A single-factor repeated measures ANOVA was used to identify significant main effects of joint position and contraction level on the peak-to-peak amplitude of Mmax, Hmax, and the Hmax/Mmax ratio of the middle soleus. A two-factor repeated measures ANOVA was used to determine significant main effects for the interaction of joint position and the level of background contraction on the peak-to-peak amplitude of Mmax, Hmax, and the Hmax/Mmax ratio of the middle soleus. Cohen’s d2 was used to calculate effect sizes for parameters of Mmax and MVCs in both muscles between the extremes of joint angles (35° and −20°) across the group. Descriptive statistics are reported as the mean ± SEM. Tukey’s HSD post-hoc test was used to detect differences when significant main effects were identified. Due to high intersubject variability, a single-factor ANOVA was performed for Mmax integrated EMG amplitude of individual subjects. For all tests, significance was accepted at an alpha level of P ≤ 0.05. In addition, effect sizes were used post-hoc to calculate the statistical power range.3 The mean power for Mmax and MVC variables was 0.80 ± 0.05 (mean ± SEM) with a median of 0.96.
RESULTS
Mmax and Joint Angle
The peak-to-peak amplitude of Mmax recorded from relaxed soleus and TA over the full range of joint angles is shown for individual subjects in Figure 2A,B, respectively. The influence of joint angle on soleus Mmax amplitude was not consistent for the three recording sites for the subject shown in Figure 2A; Mmax was highly dependent on joint position for the middle and lateral recording sites, but was unaffected for the medial site. At full extension (shortest soleus muscle length), Mmax was 334%, 418%, and 99% of that at full flexion for the lateral, middle, and medial recording sites, respectively. In TA, Mmax peak-to-peak amplitude was approximately twice as large when the ankle was in full flexion (shortest TA muscle length) compared to full extension for both recording sites for the individual shown in Figure 2B. The waveforms below each graph show that the changes in amplitude were not always associated with major changes in shape or polarity. Figure 3A,B shows M-wave recruitment curves constructed from data from the same subjects as in Figure 2A,B, respectively, for both soleus (middle recording site) and TA (distal recording site). These data show that responses were maximal and that Mmax amplitude was greater at short muscle lengths.
FIGURE 2.

Peak-to-peak amplitude of Mmax increased with a reduction in muscle length. (A) Changes in Mmax peak-to-peak amplitude at different joint angles for the soleus of a single subject for three recording sites. (B) Mmax peak-to-peak amplitude for TA of a single subject for two recording sites. Data points are mean values of five supramaximal stimulations at every joint angle ± SD. Below the graphs are traces showing the mean of five Mmax waveforms recorded at three different joint angles.
FIGURE 3.

M-wave recruitment curves at three joint angles for (A) soleus (middle recording site) and (B) TA (distal recording site) recorded from two separate subjects.
Across subjects, there were significant main effects (P ≤ 0.001) of joint angle on the peak-to-peak amplitude of Mmax for all three recording sites over soleus and the two sites over TA (Fig. 4). Averaged across recording sites, Mmax at the shortest muscle lengths was 155% and 159% of that at the longest lengths for soleus and TA, respectively. In soleus, although it was common for Mmax to be affected differently at the three recording sites, the differences were not consistent between subjects. In TA, changes in Mmax with joint position were generally consistent between the two recording sites across subjects. In contrast, although changes in joint angle markedly affected the integrated Mmax amplitude, the effect was variable between subjects. For the group, across recording sites the effect size for Mmax peak-to-peak amplitude between full flexion and full extension was 3.13 ± 0.47. Across all subjects and electrode sites, the mean coefficient of variation in Mmax integrated EMG amplitude with joint angle was 11.6%. For the group, there was a significant main effect (P ≤ 0.05) of joint angle for the proximal but not the distal TA and no significant main effect (P > 0.05) for any of the three sites over soleus (not shown). For the group, across recording sites the effect size for integrated EMG amplitude between full flexion and extension was 1.28 ± 0.28. However, analysis of data from individual subjects identified significant main effects (P ≤ 0.001) of the integrated amplitude of Mmax at different joint angles in every subject for all recording sites over soleus and TA. The integrated amplitude of Mmax was greater at short muscle lengths in some subjects, but greater at long lengths in others.
FIGURE 4.
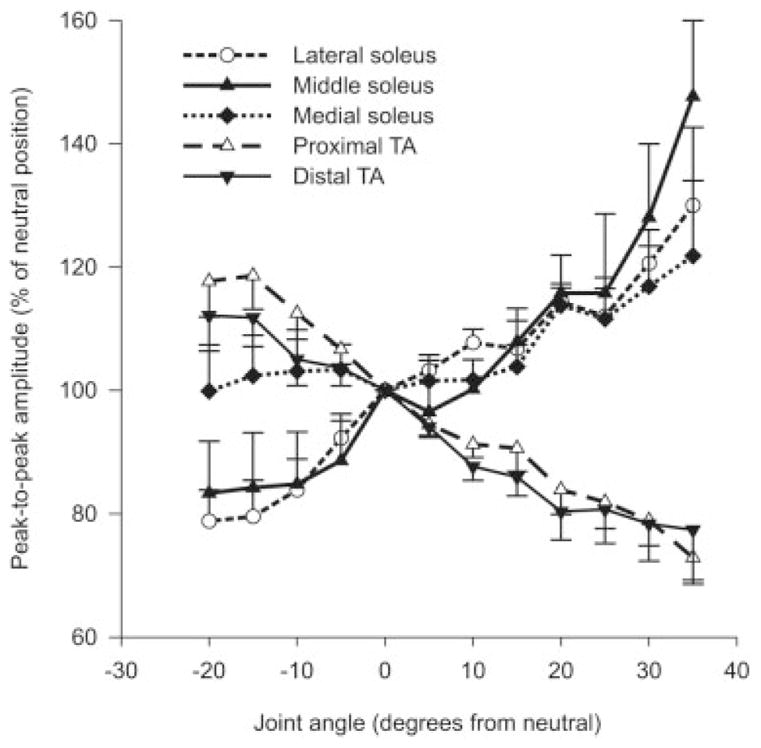
Group data showing changes in Mmax amplitude at different joint angles for three and two recordings sites on soleus and TA, respectively, across subjects. Data points are mean values ± SEM expressed as a percentage of the neutral position (0°).
Mmax duration and the latency of the first peak were variable across recording sites. For instance, there was a significant main effect (P ≤ 0.05) for medial soleus but not for lateral and middle soleus. For TA, there was a significant main effect (P ≤ 0.01) for the distal but not for the proximal recording sites, which may stem from the large variability between subjects for some data points. For the group, across recording sites the effect size for Mmax duration between full flexion and full extension was 3.11 ± 0.56. The latency of the first peak was also significantly reduced at all three recording sites in soleus at short muscle lengths but there were no significant main effects of joint angle for the two sites over TA on Mmax latency. For the group, across recording sites the effect size for the latency of the first peak between full flexion and full extension was 3.23 ± 1.49. Examples of changes in Mmax duration and latency can be observed in Figure 2.
Mmax, Hmax, Background Contraction, and Joint Angle
M/H recruitment curves were obtained from the middle soleus with the ankle at three positions while subjects (n = 5) were relaxed, and during low (12.5 ± 1.3% MVC), medium (20.6 ± 1.9% MVC), and high (27.2 ± 2.2% MVC) contractions. For the individual whose data are displayed in Figure 5, the peak-to-peak amplitudes of Mmax and Hmax during the high force contraction were 167% and 138% of their respective amplitudes at rest at the same joint angles. For the group, there was a significant main effect of background contraction strength on peak-to-peak Mmax (P ≤ 0.01) and Hmax (P ≤ 0.0001) amplitudes as well as the Hmax/Mmax ratio (P ≤ 0.01) for the middle electrode pair (Fig. 6). Post-hoc analysis revealed that low, medium, and high background contractions resulted in significantly greater amplitudes than at rest at all three joint angles. At a given joint angle, Hmax amplitude was significantly greater at high compared to low background forces and the Hmax/Mmax ratio (Fig. 6C) was larger during high force contraction than at rest or during low and medium force contractions. The Hmax/Mmax ratio was also greater at medium background forces than at rest at identical joint angles.
FIGURE 5.

Influence of contraction amplitude on M-wave/H-reflex recruitment curves. (A) M-wave and (B) H-reflex recruitment curves for a single subject recorded with the ankle at 10° from the recording electrodes over middle soleus. Data show peak-to-peak amplitudes recorded at four activation levels.
FIGURE 6.
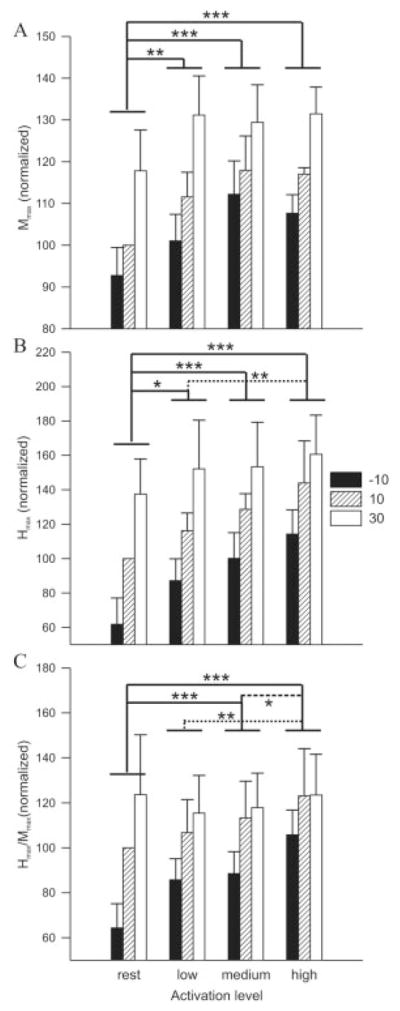
Influence of joint angle and contraction amplitude on (A) Mmax, (B) Hmax, and (C) the Hmax/Mmax ratio in soleus across subjects (n = 5). Solid lines indicate a significant difference from resting amplitudes while dotted and dashed lines represent a significant difference between low and high and medium and high, respectively. Single, double, and triple asterisks indicate significant differences at P ≤ 0.05, 0.01, and 0.001, respectively. Data points are mean values ± SEM at three joint angles and at four activation levels for the middle soleus expressed as a percentage of 10° at rest, across subjects.
There was a significant main effect of joint angle on Hmax (P ≤ 0.001) and Hmax/Mmax ratio (P ≤ 0.01). For Hmax, post-hoc analysis revealed that amplitude was significantly smaller at −10° than at 10° ( P ≤ 0.01), at −10° than at 30° (P ≤ 0.001), and at 10° than at 30° (P ≤ 0.05). The Hmax/Mmax ratio at −10° was significantly lower than at 30° (P ≤ 0.01) and 10° (P ≤ 0.05). There were no significant interactions between joint angle and background contraction for Mmax, Hmax, and the Hmax/Mmax ratio for the soleus middle electrode pair.
MVC Data
Significant main effects for joint angle indicate that the average, rectified EMG amplitude during MVCs was greater at short muscle lengths for the lateral soleus electrode site and both TA sites (Fig. 7A). For the group, across recording sites the effect size for MVC amplitude between full flexion and extension was 0.94 ± 0.23. The force exerted during both Mmax and MVC trials (Fig. 7B) was significantly greater at long than short muscle lengths for both muscles (P ≤ 0.001). For the group, the effect size for force (pooled MVC and Mmax) between full flexion and extension was 11.23 ± 3.10.
FIGURE 7.

For the group (n = 7), MVC amplitude and force data were differently influenced by joint angle. (A) MVC amplitude recorded over three and two sites over soleus and TA, respectively. (B) Force recorded during Mmax and MVC trials gradually increased with an increase in muscle length in both soleus and TA, respectively. Data points are mean values ± SEM expressed as a percentage of the neutral position.
DISCUSSION
The main finding of this study was that the peak-to-peak amplitude of Mmax is largest when the ankle joint position produces a short muscle length or when contraction level is high. Thus, CMAP amplitude should not be used as a measure of neural excitability without first normalizing to the Mmax at the identical joint angle and contraction level, as recommended previously.37 We also showed that the Hmax/Mmax ratio was greater at short muscle lengths, indicating that not all of the change in H-reflex amplitude at different joint angles can be accounted for by peripheral changes at the muscle. These results have implications for the use of Mmax during reflex studies and wider implications for recording and interpreting CMAPs in general.
Influence of Joint Angle and Background Contraction
Although we manipulated joint angle in order to study the influence of muscle length on CMAP amplitude, the relationship between these parameters may not be linear. For example, there could be changes in the length of tendons with different degrees of muscle stretch and contraction. Although this precludes precise quantification of the relationship between muscle length and CMAP characteristics, it does not limit the general implications that can be drawn from this study. The increase in peak-to-peak amplitude of Mmax with reductions in muscle length observed in the present study accords with changes in submaximal9–11 and maximal M-wave24 amplitudes previously reported. Our results contradict those of Sale et al.,33 who found a decrease in Mmax with a reduction in muscle length. However, the purpose of the study by Sale et al.33 was not to investigate changes in Mmax at different joint angles, and extraneous factors such as a change in the effective stimulus strength may have occurred. It is highly unlikely that movement of the stimulating electrode relative to the nerve can account for changes in Mmax in the present experiment. There was no movement at the knee joint and below the head of the fibula, where the tibial and common peroneal nerves were stimulated, respectively. Furthermore, the M-wave recruitment curves in Figure 3 clearly demonstrate that, despite increases in stimulation intensity, there were no increases in the amplitude of Mmax beyond the Mmax threshold. Unlike the Sale et al.33 study we found that Mmax amplitude was similarly influenced by muscle length in both ankle flexors and extensors, despite markedly different pennation angles of the fibers in the two muscles.22,23
Greater background contractions also resulted in larger Mmax amplitudes. In previous studies, Linnamo et al.20 found no effect of activation level on quadriceps (vastus medialis, vastus lateralis, rectus femoris) Mmax amplitude when tested at 45° knee flexion, whereas Nagata and Christianson30 showed that Mmax amplitude increased progressively in TA with increasing contraction level at an ankle angle of −5°. Recently, Lee and Carroll18 showed that there is considerable variation in Mmax at different contraction strengths in the wrist but that this effect was not consistent across subjects. The extent to which muscle length changes with muscle activation at a given joint position may be a key factor influencing changes in Mmax. The influence of background contraction observed in our study may be due to similar mechanisms, such as a change in muscle length, as those responsible for the changes in Mmax at different joint angles. Indeed, even during isometric contractions the muscle can shorten considerably.12
This effect of muscle length, either via changes in joint angle or background contraction, on Mmax amplitude will influence the amplitude of any CMAP, including submaximal M-waves and H-reflexes. The amplitude of submaximal M-waves is frequently used as an indirect measure of effective stimulus intensity for experiments involving the Hoffmann or H-reflex. The stimulus intensity is adjusted to maintain constant M-wave amplitude, with the idea that changes in submaximal M-waves are the result of movement of the stimulating electrode. This is frequently done in experiments involving movement, such as walking or cycling, where joint angle varies considerably during the cycle. However, if changes in M-wave size result from peripheral factors at the recording site, it would be erroneous to modify stimulus intensity in an attempt to maintain a constant afferent volley. H-reflexes are commonly used as measures of central excitability and thus the influence of muscle length must be considered when using these techniques.
The integrated EMG amplitude, which is often regarded as less sensitive than peak-to-peak measurements to changes in M-wave duration and shape, was also affected by changes in joint angle. Previous studies had shown that submaximal M-wave duration increased concomitantly with muscle length9–11 and that the shape of the potential varied,25 thereby affecting the integrated area under the curve. Thus, muscle length has the potential to affect both amplitude and duration, although our data show that the relationship is complex and variable. For example, a decrease in peak-to-peak amplitude was not always accompanied by an increase in duration, and vice versa. Moreover, at different muscle lengths the shape of the potential can widely vary. Therefore, using the integrated amplitude of Mmax will not always avoid problems of response variation at the muscle. The effect of muscle length on M-wave amplitude is opposite to the effect on duration. As muscle length decreases, the amplitude tends to increase and the duration tends to decrease. The effect of changing length on duration is readily explained by the four distinct phases of a muscle action potential: depolarization at the neuromuscular junction, propagation along the sarcolemma, termination of the action potential at the musculotendinous junction, and slow repolarization.17 The relative onset of these four phases are closer in time when the muscle length is shortened, leading to a decreased duration of the compound muscle action potential measured from surface electrodes. Gerilovsky et al.11 also reported that duration measurements are variable when using bipolar electrode configurations. Although monopolar configurations can simplify some aspects of interpretation of surface EMG signals, it is not always possible or desirable to use monopolar systems.
The position of recording electrodes relative to the innervation zone can also have large and predictable effects on the duration and amplitude of CMAPs, although in this study different recording sites with varying distances from the innervation zone generated similar length-dependent effects. Complications arising from this issue cannot always be avoided, even by identification of the motor point. This is because there may be multiple zones of innervation within a muscle that do not correspond directly to the motor point, and because changes in muscle length may cause large changes in the relative location of recording electrodes (on the skin) and innervation zones.
A putative mechanism for the influence of joint angle and background contraction is a change in muscle length, and hence the conformation of the muscle relative to the recording electrodes, which may affect the type and number of motor units or the temporal dispersion of motor unit action potentials (MUAPs). Muscle fibers belonging to a single motor unit are intermingled with fibers from other motor units,1 and as such a conformational change in the muscle may lead to sampling of different motor units of varying sizes, considerably changing the summated M-wave amplitude. Quite simply, at a given stimulus intensity there will be more electrically active muscle tissue near the recording electrodes when the muscle is at a short length than a long length. In addition, the amplitude of MUAPs can increase as the muscle shortens.8,9,11 We speculate that differences in the position of the recording electrodes relative to the muscle at varying joint angles and level of contraction alters the type, number, and temporal dispersion of MUAPs sampled, thus influencing the M-wave. In addition, since these factors can differ from one individual to another it is expected that relative changes in M-wave amplitude vary accordingly.
We found that EMG amplitude recorded during an MVC did not parallel length-dependent changes in Mmax amplitude, although a similar trend toward greater amplitudes at shorter muscle lengths occurred for some electrode arrangements. Voluntary contractions can be influenced by factors that will not affect Mmax such as motor unit recruitment and discharge rate, as well as excitatory and inhibitory feedback from sensory receptors. It is conceivable that some of these factors may also be influenced by changes in joint angle, which could influence the average rectified amplitude in unpredictable ways. Indeed, studies have reported either an increase,13,21,24,36 a decrease,4,32,33 or no change19,29 in EMG recorded during MVCs with a decrease in muscle length. Thus, when using rectified EMG as a measure of voluntary activation, data should be normalized to MVCs performed over the range of joint angles studied.
There is some evidence that H-reflex amplitude increases with a reduction in muscle length.8–11 However, this increase has been associated with a concomitant increase in M-wave9 or MUAP.8,9,11 Thus, it is unclear whether the modulation is due to central or peripheral factors. Two recent studies have demonstrated that soleus Hmax/Mmax ratios are influenced by joint angle.14,31 In the current study the Hmax/Mmax ratio was greater at short muscle lengths and during voluntary contraction. Taken together, these data demonstrate that changes in the H-reflex at different joint angles and during voluntary contractions are not completely due to peripheral changes at the muscle but also to central effects, which may include altered presynaptic inhibition or homosynaptic depression of group Ia afferents. For instance, a reduction in H-reflex amplitude at longer muscle lengths could be due to augmented presynaptic inhibition at the Ia afferent terminal because of increased muscle stretch and activity of group Ia afferents.28,37
CONCLUSIONS
The results of our study indicate that precautions are required when using M-wave size as a measure of stimulus constancy, or when using Mmax to normalize CMAP amplitude. Although the effective strength of an electrical stimulus can change due to movement of the stimulating electrode relative to the nerve, our data show that CMAP amplitude can also be influenced by peripheral factors at the recording site such as muscle length and the level of voluntary activation. These data support the previous recommendation37 that to ensure a consistent afferent volley in reflex studies it is necessary to maintain a constant M-wave amplitude by normalizing its amplitude to Mmax recorded at the same angle and at a similar level of voluntary activation. Similarly, voluntary EMG activity should be normalized to the EMG amplitude obtained during an MVC at the identical joint position. Therefore, the results indicate that all CMAPs, including H-reflexes and MEPs, should be normalized to the amplitude of Mmax recorded at an identical joint position and background contraction level to guarantee that changes in amplitude are due to central and not peripheral mechanisms.
Acknowledgments
We thank Alejandro Ley and Zoltan Kenwell for technical assistance. Supported by the Alberta Heritage Foundation for Medical Research (to D.F.C.), Canadian Institutes of Health Research (to D.F.C.), Natural Sciences and Engineering Research Council of Canada (to D.F.C.), and an Isaac Walton Killam Fellowship (to T.J.C.).
Abbreviations
- ANOVA
analysis of variance
- CMAP
compound muscle action potential
- CNS
central nervous system
- EMG
electromyography
- MEP
motor-evoked potential
- M/H
M-wave/H-reflex
- Mmax
maximal M-wave
- MUAP
motor unit action potential
- MVC
maximal voluntary contraction
- TA
tibialis anterior
References
- 1.Bodine SC, Garfinkel A, Roy RR, Edgerton VR. Spatial distribution of motor unit fibers in the cat soleus and tibialis anterior muscles: local interactions. J Neurosci. 1988;8:2142–2152. doi: 10.1523/JNEUROSCI.08-06-02142.1988. [DOI] [PMC free article] [PubMed] [Google Scholar]
- 2.Cohen J. Some statistical issues in psychological research. In: Wolman BB, editor. Handbook of clinical psychology. New York: McGraw-Hill; 1965. pp. 95–121. [Google Scholar]
- 3.Cohen J. A power primer. Psychol Bull. 1992;112:155–159. doi: 10.1037//0033-2909.112.1.155. [DOI] [PubMed] [Google Scholar]
- 4.Cresswell AG, Loscher WN, Thorstensson A. Influence of gastrocnemius muscle length on triceps surae torque development and electromyographic activity in man. Exp Brain Res. 1995;105:283–290. doi: 10.1007/BF00240964. [DOI] [PubMed] [Google Scholar]
- 5.Farina D, Cescon C, Merletti R. Influence of anatomical, physical, and detection-system parameters on surface EMG. Biol Cybern. 2002;86:445–456. doi: 10.1007/s00422-002-0309-2. [DOI] [PubMed] [Google Scholar]
- 6.Ferris DP, Aagaard P, Simonsen EB, Farley CT, Dyhre-Poulsen P. Soleus H-reflex gain in humans walking and running under simulated reduced gravity. J Physiol (Lond) 2001;530:167–180. doi: 10.1111/j.1469-7793.2001.0167m.x. [DOI] [PMC free article] [PubMed] [Google Scholar]
- 7.Frigon A, Carroll TJ, Jones KE, Zehr EP, Collins DF. Mmax is up to four times larger at short muscle lengths than long lengths in human soleus and tibialis anterior muscles. Soc Neurosci Abstr. 2003 [Google Scholar]
- 8.Garland SJ, Gerilovsky L, Enoka RM. Association between muscle architecture and quadriceps femoris H-reflex. Muscle Nerve. 1994;17:581–592. doi: 10.1002/mus.880170604. [DOI] [PubMed] [Google Scholar]
- 9.Gerilovsky L, Gydikov A, Radicheva N. Changes in the shape of the extraterritorial potentials of tonic motor units, M- and H-responses of triceps surae muscles at different muscle lengths and under conditions of voluntary activation. Exp Neurol. 1977;56:91–101. doi: 10.1016/0014-4886(77)90141-8. [DOI] [PubMed] [Google Scholar]
- 10.Gerilovsky L, Tsvetinov P, Trenkova G. H-reflex potentials shape and amplitude changes at different length of relaxed soleus muscle. Electromyogr Clin Neurophysiol. 1986;26:641–653. [PubMed] [Google Scholar]
- 11.Gerilovsky L, Tsvetinov P, Trenkova G. Peripheral effects on the amplitude of monopolar and bipolar H-reflex potentials from the soleus muscle. Exp Brain Res. 1989;76:173–181. doi: 10.1007/BF00253634. [DOI] [PubMed] [Google Scholar]
- 12.Griffiths RI. Shortening of muscle fibres during stretch of the active cat medial gastrocnemius muscle: the role of tendon compliance. J Physiol (Lond) 1991;436:219–236. doi: 10.1113/jphysiol.1991.sp018547. [DOI] [PMC free article] [PubMed] [Google Scholar]
- 13.Heckathorne CW, Childress DS. Relationships of the surface electromyogram to the force, length, velocity, and contraction rate of the cineplastic human biceps. Am J Phys Med. 1981;60:1–19. [PubMed] [Google Scholar]
- 14.Hwang IS. Assessment of soleus motoneuronal excitability using the joint angle dependent H reflex in humans. J Electromyogr Kinesiol. 2002;12:361–366. doi: 10.1016/s1050-6411(02)00034-2. [DOI] [PubMed] [Google Scholar]
- 15.Kim BJ, Date ES, Park BK, Choi BY, Lee SH. Physiologic changes of compound muscle action potentials related to voluntary contraction and muscle length in carpal tunnel syndrome. J Electromyogr Kinesiol. 2005;15:275–281. doi: 10.1016/j.jelekin.2004.09.002. [DOI] [PubMed] [Google Scholar]
- 16.Larsen B, Voigt M. Changes in the gain of the soleus H-reflex with changes in the motor recruitment level and/or movement speed. Eur J Appl Physiol. 2004;93:19–29. doi: 10.1007/s00421-004-1152-z. [DOI] [PubMed] [Google Scholar]
- 17.Lateva ZC, McGill KC, Burgar CG. Anatomical and electro-physiological determinants of the human thenar compound muscle action potential. Muscle Nerve. 1996;19:1457–1468. doi: 10.1002/(SICI)1097-4598(199611)19:11<1457::AID-MUS10>3.0.CO;2-Q. [DOI] [PubMed] [Google Scholar]
- 18.Lee M, Carroll TJ. The amplitude of Mmax in human wrist flexors varies during different muscle contractions despite constant posture. J Neurosci Methods. 2005;149:95–100. doi: 10.1016/j.jneumeth.2005.03.016. [DOI] [PubMed] [Google Scholar]
- 19.Leedham JS, Dowling JJ. Force-length, torque-angle and EMG-joint angle relationships of the human in vivo biceps brachii. Eur J Appl Physiol Occup Physiol. 1995;70:421–426. doi: 10.1007/BF00618493. [DOI] [PubMed] [Google Scholar]
- 20.Linnamo V, Strojnik V, Komi PV. Electromyogram power spectrum and features of the superimposed maximal M-wave during voluntary isometric actions in humans at different activation levels. Eur J Appl Physiol. 2001;86:28–33. doi: 10.1007/s004210100462. [DOI] [PubMed] [Google Scholar]
- 21.Lunnen JD, Yack J, LeVeau BF. Relationship between muscle length, muscle activity, and torque of the hamstring muscles. Phys Ther. 1981;61:190–195. doi: 10.1093/ptj/61.2.190. [DOI] [PubMed] [Google Scholar]
- 22.Maganaris CN, Baltzopoulos V. Predictability of in vivo changes in pennation angle of human tibialis anterior muscle from rest to maximum isometric dorsiflexion. Eur J Appl Physiol Occup Physiol. 1999;79:294–297. doi: 10.1007/s004210050510. [DOI] [PubMed] [Google Scholar]
- 23.Maganaris CN, Baltzopoulos V, Sargeant AJ. In vivo measurements of the triceps surae complex architecture in man: implications for muscle function. J Physiol (Lond) 1998;512:603–614. doi: 10.1111/j.1469-7793.1998.603be.x. [DOI] [PMC free article] [PubMed] [Google Scholar]
- 24.Marsh E, Sale D, McComas AJ, Quinlan J. Influence of joint position on ankle dorsiflexion in humans. J Appl Physiol. 1981;51:160–167. doi: 10.1152/jappl.1981.51.1.160. [DOI] [PubMed] [Google Scholar]
- 25.Merletti R, Lo Conte LR, Cisari C, Massazza U. Effect of ankle joint position on electrically evoked surface myoelectric signals of the tibialis anterior muscle. Arch Phys Med Rehabil. 1993;74:501–506. doi: 10.1016/0003-9993(93)90114-p. [DOI] [PubMed] [Google Scholar]
- 26.Merletti R, Lo CL, Avignone E, Guglielminotti P. Modeling of surface myoelectric signals. Part I. Model implementation. IEEE Trans Biomed Eng. 1999;46:810–820. doi: 10.1109/10.771190. [DOI] [PubMed] [Google Scholar]
- 27.Merletti R, Roy SH, Kupa E, Roatta S, Granata A. Modeling of surface myoelectric signals. Part II. Model-based signal interpretation. IEEE Trans Biomed Eng. 1999;46:821–829. doi: 10.1109/10.771191. [DOI] [PubMed] [Google Scholar]
- 28.Misiaszek JE. The H-reflex as a tool in neurophysiology: its limitations and uses in understanding nervous system function. Muscle Nerve. 2003;28:144–160. doi: 10.1002/mus.10372. [DOI] [PubMed] [Google Scholar]
- 29.Miyamoto N, Oda S. Mechanomyographic and electromyo-graphic responses of the triceps surae during maximal voluntary contractions. J Electromyogr Kinesiol. 2003;13:451–459. doi: 10.1016/s1050-6411(03)00058-0. [DOI] [PubMed] [Google Scholar]
- 30.Nagata A, Christianson JC. M-wave modulation at relative levels of maximal voluntary contraction. Eur J Appl Physiol Occup Physiol. 1995;71:77–86. doi: 10.1007/BF00511236. [DOI] [PubMed] [Google Scholar]
- 31.Patikas DA, Kotzamanidis C, Robertson CT, Koceja DM. The effect of the ankle joint angle in the level of soleus Ia afferent presynaptic inhibition. Electromyogr Clin Neurophysiol. 2004;44:503–511. [PubMed] [Google Scholar]
- 32.Pinniger GJ, Steele JR, Thorstensson A, Cresswell AG. Tension regulation during lengthening and shortening actions of the human soleus muscle. Eur J Appl Physiol. 2000;81:375–383. doi: 10.1007/s004210050057. [DOI] [PubMed] [Google Scholar]
- 33.Sale D, Quinlan J, Marsh E, McComas AJ, Belanger AY. Influence of joint position on ankle plantarflexion in humans. J Appl Physiol. 1982;52:1636–1642. doi: 10.1152/jappl.1982.52.6.1636. [DOI] [PubMed] [Google Scholar]
- 34.Simonsen EB, Dyhre-Poulsen P. Amplitude of the human soleus H reflex during walking and running. J Physiol (Lond) 1999;515:929–939. doi: 10.1111/j.1469-7793.1999.929ab.x. [DOI] [PMC free article] [PubMed] [Google Scholar]
- 35.Simonsen EB, Dyhre-Poulsen P, Voigt M. Excitability of the soleus H reflex during graded walking in humans. Acta Physiol Scand. 1995;153:21–32. doi: 10.1111/j.1748-1716.1995.tb09830.x. [DOI] [PubMed] [Google Scholar]
- 36.Soderberg GL, Cook TM. Electromyography in biomechanics. Phys Ther. 1984;64:1813–1820. doi: 10.1093/ptj/64.12.1813. [DOI] [PubMed] [Google Scholar]
- 37.Zehr PE. Considerations for use of the Hoffmann reflex in exercise studies. Eur J Appl Physiol. 2002;86:455–468. doi: 10.1007/s00421-002-0577-5. [DOI] [PubMed] [Google Scholar]