

Abstract
The independent relationship between physical inactivity and risk of death after an index chronic obstructive pulmonary disease (COPD) hospitalisation is unknown.
We conducted a retrospective cohort study in a large integrated healthcare system. Patients were included if they were hospitalised for COPD between January 1, 2011 and December 31, 2011. All-cause mortality in the 12 months after discharge was the primary outcome. Physical activity, expressed as self-reported minutes of moderate to vigorous physical activity (MVPA), was routinely assessed at outpatient visits prior to hospitalisation. 1727 (73%) patients were inactive (0 min of MVPA per week), 412 (17%) were insufficiently active (1–149 min of MVPA per week) and 231 (10%) were active (≥150 min of MVPA per week). Adjusted Cox regression models assessed risk of death across the MVPA categories.
Among 2370 patients (55% females and mean age 73±11 years), there were 464 (20%) deaths. Patients who were insufficiently active or active had a 28% (adjusted HR 0.72 (95% CI 0.54–0.97), p=0.03) and 47% (adjusted HR 0.53 (95% CI 0.34–0.84), p<0.01) lower risk of death, respectively, in the 12 months following an index COPD hospitalisation compared to inactive patients.
Any level of MVPA is associated with lower risk of all-cause mortality after a COPD hospitalisation. Routine assessment of physical activity in clinical care would identify persons at high risk for dying after COPD hospitalisation.
Short abstract
Any level of moderate to vigorous physical activity decreases risk of dying over 12 months after COPD hospitalisation http://ow.ly/XZqj0
Introduction
Chronic obstructive pulmonary disease (COPD) is characterised by acute exacerbations which result in poorer health-related quality of life, a faster decline in lung function and increased mortality [1–4]. Hospitalisations due to severe acute exacerbations account for up to 70% of the direct healthcare costs in COPD [5, 6]. Furthermore, COPD is the third most common cause of readmission among Medicare beneficiaries [7]. Re-hospitalisation and death rates are as high as 25% and 21%, respectively, at 1 year in patients who have been hospitalised for an acute exacerbations [8].
The ability to identify individuals at risk for re-hospitalisation and death after hospital admission for an acute exacerbation would allow targeting of high-risk patients for treatment and intervention. Emphasis has focused on identifying modifiable patient, provider and system factors [9]. Although studies have different lengths of follow-up time and differ as to COPD-related versus all-cause outcomes, they have consistently shown older age, male sex, more severe airflow obstruction, dyspnoea, oxygen use, prior hospitalisations and comorbidities to be key patient factors predicting re-hospitalisations and death [8, 10–14]. While several of these variables are already targeted by pharmacological therapy, there is a need to identify other modifiable patient factors.
Physical activity has emerged as a modifiable behaviour that is associated with COPD outcomes. The Global Initiative for Chronic Obstructive Lung Disease guidelines recommend regular physical activity for patients with stable COPD [15]. Higher levels of physical activity are associated with shorter hospital length of stay [16] and decreased risk of acute exacerbations, hospitalisations and death, independent of airflow obstruction [17–21]. In studies looking specifically at persons who had an index COPD hospitalisation, self-reported low physical activity using a research questionnaire [18] and directly measured physical activity using an accelerometer [22] were associated with an increased risk of COPD-related re-hospitalisation [18]. We similarly found that self-reported physical inactivity, assessed during routine clinical care, was associated with a 34% greater risk of 30-day all-cause readmission after an index COPD hospitalisation [23].
Although physical activity level in stable COPD is associated with mortality [24], the relationship between physical activity and risk of death in a high-risk group of patients after an index COPD hospitalisation is unknown. Therefore, our primary aim was to examine the independent relationship between physical activity and all-cause mortality in the 12 months after an index COPD hospitalisation. We hypothesise that higher physical activity at baseline predicts lower risk of all-cause mortality after a COPD hospitalisation. As a secondary aim, we also assessed the independent relationship between physical activity and a composite outcome of all-cause mortality and re-hospitalisation.
Methods
Study design
This was a retrospective cohort study of patients from an integrated healthcare system with 14 medical centres located in southern California. Subject approval was obtained from the Kaiser Permanente Southern California Institutional Review Board (Pasadena, CA, USA). Patients were included if they were hospitalised for COPD and discharged between January 1, 2011 and December 31, 2011. COPD hospitalisations were defined according to the Centres for Medicare and Medicaid Services (CMS) and National Quality Forum proposed criteria: International Classification of Diseases, Ninth Revision principal diagnosis of COPD (491.21, 491.22, 491.8, 491.9, 492.8, 493.20, 493.21, 493.22, and 496) or principal diagnosis of respiratory failure (518.81, 518.82, 518.84 and 799.1) and a secondary diagnosis of acute exacerbation of COPD (491.21, 491.22, 493.21 and 493.22) [25, 26]. We applied the following additional inclusion criteria: age ≥40 years, prescribed a bronchodilator or corticosteroid inhaler in the 12 months prior to the index hospitalisation, alive at discharge, continuously enrolled in the health plan in the 12 months prior to the index hospitalisation, and having physical activity data. All participants were followed for 12 months post discharge or until death.
Outcomes
Primary: death
All-cause mortality in the 12 months after discharge from the index hospitalisation was the primary outcome. Mortality data were obtained from the state and national death indices which provides near complete capture of the date and cause of death. Patients who were re-hospitalised and died during or at any time after the re-hospitalisation were included in the deceased cohort.
Secondary: composite of death and re-hospitalisation
All-cause re-hospitalisation in the 12 months after discharge from the index hospitalisation and death as described above was a secondary outcome. Information on re-hospitalisations was obtained from utilisation or claims data for admissions to Kaiser Permanente medical centres or contracted hospitals, respectively.
Primary independent variable: physical activity
An exercise vital sign is assessed at all outpatient visits. The exercise vital sign has been previously shown to have construct and predictive validity [23, 27, 28]. Patients are asked two questions regarding their regular physical activity: 1) on average, how many days per week do you engage in moderate to strenuous (vigorous) exercise (like a brisk walk)?; and 2) on average, how many minutes do you engage in exercise at this level? These questions are typically asked by medical assistants. Patients' responses are entered into the electronic medical record. Response choices for number of days are categorical (0–7). Minutes are also recorded categorically: 0, 10, 20, 30, 40, 50, 60, 90, 120 and ≥150. The electronic medical record software multiplies the two responses to display total minutes per week of moderate or vigorous physical activity (MVPA).
We categorised patients as inactive (0 min of MVPA per week), insufficiently active (1–149 min of MVPA per week) or active (≥150 min of MVPA per week) according to national physical activity recommendations [29]. We used the exercise vital sign value closest to but prior to the index hospitalisation (median (range) 30 (1–350) days prior to the index hospitalisation). An indicator for time elapsed from exercise vital sign assessment to the index hospitalisation was included in the models to account for the variable timing of the exercise vital sign assessment. We also examined three different summary values of the exercise vital sign: any level of MVPA closest to the index hospitalisation and the median/mode, and highest values of all available exercise vital sign data in the 12 months preceding the index hospitalisation since the two latter values are less influenced by the timing of the exercise vital sign assessment in our sensitivity analyses.
Covariates
We extracted administrative and clinical data in the 12 months (January 1, 2010 to December 31, 2010) prior to the index hospitalisation.
Socio-demographics
We assessed age, sex, marital status, race and insurance status. Education and household income were described at the level of the census tract since this information was not routinely collected in the electronic medical record as part of clinical care.
Comorbidities
Body mass index was obtained from the outpatient visit closest but prior to the index hospitalisation. A Charlson comorbidity score was calculated for each patient [30]. We also examined the presence of anaemia, anxiety, depression and pulmonary hypertension prior to the index hospitalisation, which have been associated with hospitalisation risk in COPD but are not included in the Charlson index [31].
Health resource utilisation
We examined the number of hospitalisations in the 12 months preceding the index hospitalisation. Length of stay, receipt of inpatient palliative care and discharge disposition were all obtained with the index hospitalisation. Pharmacy and durable medical equipment data provided information on use of inhaled bronchodilators, long-term systemic corticosteroids and supplemental oxygen in the 12 months prior to the index hospitalisation. New oxygen use after the index discharge was also assessed.
Health behaviours
Cigarette smoking status was obtained from the outpatient visit closest to the index hospitalisation. Immunisation history included influenza and pneumococcal vaccinations in the previous 1–2 years and 5 years, respectively. Any participation in pulmonary rehabilitation during the 3 years prior to the index hospitalisation was recorded.
Statistical analysis
Comparisons across MVPA categories were performed using a non-parametric Kruskal–Wallis test for continuous variables which were not normally distributed and Chi-squared tests for categorical variables. Cox proportional hazards regression models compared mortality risk across three levels of MVPA (inactive, insufficiently active and active) in the 12 months after a COPD-related hospitalisation. Covariates were examined in unadjusted models and were included in the final adjusted model if they contributed substantially to model fit or were considered clinically important. Kaplan–Meier curves were created to display survival, according to the three levels of MVPA during the 12-month follow-up. An adjusted competing risk model of cause-specific hazard was generated to determine the association between level of physical activity and cause of death (COPD-related versus all other causes). Cox regression was also used for the secondary composite outcome of death and re-hospitalisation.
Several sensitivity analyses were performed by: 1) including only patients who had spirometry data (n=1292) to adjust for disease severity; 2) excluding a subgroup of patients who were never-smokers (n=291) to assess for misclassification of COPD diagnosis; and 3) using three different summary values of the exercise vital sign (any level of MVPA closest to the index hospitalisation, mode/median exercise vital sign or highest exercise vital sign in the 12 months prior to the index hospitalisation). All tests were two-sided with a p-value <0.05 considered statistically significant. Analyses were conducted using SAS 9.3 (SAS Institute Inc., Cary, NC, USA).
Results
Cohort selection and patient characteristics
We identified 3440 patients with COPD as their principal discharge diagnosis or who had acute respiratory failure with a secondary diagnosis of acute exacerbation of COPD from January 1, 2011 to December 31, 2011 (figure 1). The final analytical sample included 2370 patients.
FIGURE 1.

Cohort selection. COPD: chronic obstructive pulmonary disease; ICD-9: International Classification of Diseases, Ninth Revision; CM: clinical modification.
A total of 1727 (73%) persons were inactive, 412 (17%) insufficiently active, and 231(10%) active. Patients had 8.4±7.0 outpatient visits with exercise vital sign data in the 12 months prior to the index hospitalisation. Baseline socio-demographic and clinical characteristics stratified by level of baseline physical activity prior to the index hospitalisation are presented in table 1. Patients who were physically inactive were older, single, had lower education, were obese, were less likely to participate in rehabilitation, used supplemental oxygen, had worse airflow obstruction and more comorbidities, and were more likely to have a COPD hospitalisation in the previous year compared to active patients (p<0.05).
TABLE 1.
Characteristics of patients with index chronic obstructive pulmonary disease (COPD) hospitalisation according to level of moderate to vigorous physical activity
| Inactive 0 min·week−1 | Insufficiently active 1–149 min·week−1 | Active ≥150 min·week−1 | Total | p-value | |
| Subjects n | 1727 | 412 | 231 | 2370 | |
| Age years | 73±10 | 71±11 | 71±10 | 73±11 | <0.001 |
| Female | 963 (56) | 228 (55) | 117 (51) | 1308 (55) | 0.34 |
| Marital status: partnered | 781 (45) | 204 (50) | 124 (54) | 1109 (47) | 0.01 |
| Education | 0.002 | ||||
| High school or less | 760 (44) | 183 (44) | 94 (41) | 1037 (44) | |
| Some college or less | 550 (32) | 129 (31) | 73 (31) | 752 (32) | |
| College or higher | 417 (24) | 100 (24) | 64 (28) | 581 (25) | |
| Median household income $ | 0.36 | ||||
| <50 000 | 717 (42) | 161 (39) | 86 (37) | 964 (41) | |
| 50 000–79 999 | 703 (41) | 177 (43) | 93 (40) | 973 (41) | |
| 80 000–99 999 | 189 (11) | 52 (13) | 35 (15) | 276 (12) | |
| ≥100 000 | 112 (6) | 21 (5) | 17 (7) | 150 (6) | |
| Missing | 6 (0) | 1 (0) | 0 | 7 (0) | |
| Body mass index | 0.02 | ||||
| Underweight <18.5 kg·m−2 | 132 (8) | 25 (6) | 11 (5) | 168 (7) | |
| Normal 18.5–24.9 kg·m−2 | 540 (31) | 144 (35) | 85 (37) | 769 (32) | |
| Overweight 25–29.9 kg·m−2 | 451 (26) | 115 (28) | 76 (33) | 642 (27) | |
| Obese >30 kg·m−2 | 604 (35) | 128 (31) | 59 (26) | 791 (33) | |
| Race | 0.22 | ||||
| White | 1177 (68) | 268 (65) | 161 (70) | 1606 (68) | |
| Black | 248 (14) | 72 (17) | 29 (13) | 349 (15) | |
| Hispanic | 200 (12) | 47 (11) | 26 (11) | 273 (12) | |
| Asian/Pacific Islander | 63 (4) | 22 (5) | 13 (6) | 98 (4) | |
| Others | 12 (1) | 1 (0) | 1 (0) | 14 (1) | |
| Missing | 27 (2) | 2 (0) | 1 (0) | 30 (1) | |
| Insurance | 0.07 | ||||
| Commercial | 355 (21) | 100 (24) | 58 (25) | 513 (22) | |
| Medicaid | 35 (2) | 9 (2) | 2 (1) | 46 (2) | |
| Medicare | 1328 (77) | 296 (72) | 167 (72) | 1791 (76) | |
| Private pay | 9 (1) | 5 (1) | 4 (2) | 18 (1) | |
| Missing | 0 | 2 (0) | 0 | 2 (0) | |
| Smoking status | 0.36 | ||||
| Never | 200 (12) | 56 (14) | 35 (15) | 291 (12) | |
| Passive | 12 (1) | 0 (0) | 1 (0) | 13 (1) | |
| Former | 1154 (67) | 276 (67) | 152 (66) | 1582 (67) | |
| Current | 361 (21) | 80 (19) | 43 (19) | 484 (20) | |
| Immunisation | |||||
| Influenza vaccination | 1354 (78) | 333 (81) | 184 (80) | 1871 (79) | 0.54 |
| Pneumonia vaccination | 1109 (64) | 279 (68) | 151 (65) | 1539 (65) | 0.40 |
| Pulmonary rehabilitation | 103 (6) | 38 (9) | 21 (9) | 162 (7) | 0.02 |
| FEV1 % pred# | 56.1±21.5 | 55.6±21.0 | 62.3±22.3 | 56.6±21.5 | <0.01 |
| FEV1/FVC | 55.5±15.8 | 54.4±15.9 | 56.2±15.2 | 55.3±15.7 | 0.65 |
| GOLD I: ≥80% pred | 112 (6) | 32 (8) | 30 (13) | 174 (7) | 0.03 |
| GOLD II: 50%≤FEV1 <80% pred | 432 (25) | 106 (26) | 63 (27) | 601 (25) | |
| GOLD III: 30%≤FEV1 <50% pred | 278 (16) | 68 (17) | 32 (14) | 378 (16) | |
| GOLD IV: FEV1 <30% pred | 100 (6) | 30 (7) | 9 (4) | 139 (6) | |
| Missing | 805 (47) | 176 (43) | 97 (42) | 1078 (45) | |
| Medications | |||||
| Short-acting beta-agonist | 1595 (92) | 377 (92) | 204 (88) | 2176 (92) | 0.11 |
| Short-acting anticholinergic | 1002 (58) | 231 (56) | 125 (54) | 1358 (57) | 0.45 |
| LABA | 816 (47) | 189 (46) | 104 (45) | 1109 (47) | 0.75 |
| Long-acting anticholinergic | 626 (36) | 157 (38) | 72 (31%) | 855 (36) | 0.21 |
| ICS | 1337 (77) | 313 (76) | 170 (74) | 1820 (77) | 0.39 |
| LAMA and ICS¶ | 546 (32) | 134 (33) | 66 (29) | 746 (31) | 0.57 |
| LABA and ICS¶ | 808 (47) | 188 (46) | 102 (44) | 1098 (46) | 0.72 |
| Long-term systemic corticosteroids | 235 (14) | 55 (13) | 19 (8) | 309 (13) | 0.07 |
| Oxygen use prior to index hospitalisation | 315 (18) | 70 (17) | 24 (10) | 409 (17) | 0.01 |
| New oxygen use post-index hospitalisation | 184 (11) | 52 (13) | 31 (13) | 267 (11) | 0.29 |
| Comorbidities | |||||
| Anaemia present at hospitalisation | 280 (16) | 71 (17) | 29 (13) | 380 (16) | 0.28 |
| Heart failure | 664 (38) | 134 (33) | 48 (21) | 846 (36) | <0.001 |
| Pulmonary hypertension | 243 (14) | 49 (12) | 18 (8) | 310 (13) | 0.02 |
| Diabetes | 590 (34) | 130 (32) | 60 (26) | 780 (33) | 0.04 |
| Depression | 359 (21) | 82 (20) | 35 (15) | 476 (20) | 0.13 |
| Anxiety | 110 (6) | 34 (8) | 12 (5) | 156 (7) | 0.26 |
| Solid tumour without metastasis | 297 (17) | 68 (17) | 41 (18) | 406 (17) | 0.91 |
| Metastatic cancer | 43 (2) | 10 (2) | 2 (1) | 55 (2) | 0.30 |
| Charlson comorbidity index | 4.0±2.6 | 3.7±2.6 | 3.1±2.4 | 3.9±2.6 | <0.001 |
| 0–1 | 332 (19) | 91 (22) | 63 (27) | 486 (21) | <0.01 |
| 2 | 280 (16) | 71 (17) | 49 (21) | 400 (17) | |
| ≥3 | 1115 (65) | 250 (61) | 119 (52) | 1484 (63) | |
| Hospitalisation in prior year | |||||
| COPD-related hospitalisation | 487 (28) | 110 (27) | 44 (19) | 641 (27) | <0.01 |
| 2.0±1.8 | 2.1±1.9 | 1.8±1.8 | 2.0±1.8 | ||
| Non-COPD-related hospitalisation | 380 (22) | 88 (21) | 51 (22) | 519 (22) | 0.05 |
| 2.4±2.2 | 2.3±2.2 | 2.0±1.5 | 2.3±2.2 | ||
| Length of stay for index | 4.9±4.1 | 4.3±3.0 | 4.2±2.9 | 4.7±3.9 | 0.04 |
| Hospitalisation days | |||||
| 1–2 | 389 (23) | 109 (26) | 69 (30) | 567 (24) | |
| 3 | 386 (22) | 108 (26) | 55 (24) | 549 (23) | |
| 4–6 | 636 (37) | 135 (33) | 78 (34) | 849 (36) | |
| 7–13 | 256 (15) | 51 (12) | 25 (11) | 332 (14) | |
| 14–59 | 60 (3) | 9 (2) | 4 (2) | 73 (3) | |
| Discharge disposition for index hospitalisation | 0.001 | ||||
| Home | 1508 (87) | 386 (94) | 221 (96) | 2115 (89) | |
| Post-acute (skilled nursing) | 125 (7) | 16 (4) | 6 (3) | 147 (6) | |
| Hospice | 56 (3) | 5 (1) | 1 (0) | 62 (3) | |
| Hospital | 6 (0) | 0 (0) | 0 (0) | 6 (0) | |
| Other | 11 (1) | 1 (0) | 1 (0) | 13 (1) | |
| Missing | 21 (1) | 4 (1) | 2 (1) | 27 (1) | |
| Palliative care consultation during index hospitalisation | 106 (6) | 15 (4) | 4 (2) | 125 (5) | 0.005 |
Data are presented as mean±sd or n (%), unless otherwise stated. FEV1: forced expiratory volume in 1 s; FVC: forced vital capacity; GOLD: Global Initiative for Chronic Obstructive Lung Disease; LABA: long-acting β-agonist; LAMA: long-acting muscarinic antagonist; ICS: inhaled corticosteroid. #: n=1292; ¶: numbers might not add up as patients are included in the count if they are on an ICS and LABA or LAMA.
There were 464 (20%) deaths and 1028 (43%) re-hospitalisations that did not result in death over 12 months (table 2). A majority of the deaths (74%) were preceded by a re-hospitalisation and approximately half of the deaths occurred within 60 days of the re-hospitalisation. COPD was the primary cause of death (46%), followed by malignancies (21%) and cardiovascular disease (15%).
TABLE 2.
Deaths and re-hospitalisations in the 12 months following index chronic obstructive pulmonary disease hospitalisation according to level of moderate to vigorous physical activity
| Inactive 0 min·week−1 | Insufficiently inactive 1–149 min·week−1 | Active >150 min·week−1 | Total | |
| Subjects n | 1727 | 412 | 231 | 2370 |
| Deaths# | 391 (23) | 53 (13) | 20 (9) | 464 (20) |
| No re-hospitalisation | 104 (6) | 15 (4) | 3 (1) | 122 (5) |
| At, during or after re-hospitalisation | 287 (17) | 38 (9) | 17 (7) | 342 (14) |
| Re-hospitalisations only | 740 (43) | 187 (45) | 101 (44) | 1028 (43) |
Data are presented as n (%), unless otherwise stated. #: 342 (74%) of all deaths were preceded by a re-hospitalisation.
Primary outcome
Unadjusted analyses of the relationship between MVPA with all-cause mortality
Patients meeting the national recommendation of engaging in at least 150 min·week−1 of MVPA had a 65% lower risk of death in the 12 months following an index COPD hospitalisation compared to inactive patients (HR 0.35 (95% CI 0.22–0.55), p<0.001) (table 3). Those who were insufficiently active (1–149 min·week−1 of MVPA) had a 46% lower risk of dying compared to inactive patients (HR 0.54 (95% CI 0.40–0.72), p<0.001).
TABLE 3.
Unadjusted and adjusted Cox proportional hazard regression models predicting mortality 12 months after index chronic obstructive pulmonary disease (COPD) hospitalisation in 2370 patients with COPD
| Factor | Unadjusted models | Adjusted model | ||
| HR (95% CI) | p-value | HR (95% CI) | p-value | |
| Baseline MVPA activity (closest to index hospitalisation) | ||||
| 0 min·week−1 | 1.0 | 1.0 | ||
| 1–149 min·week−1 | 0.54 (0.40–0.72) | <0.001 | 0.72 (0.54–0.97) | 0.03 |
| ≥150 mins·week−1 | 0.35 (0.22–0.55) | <0.001 | 0.53 (0.34–0.84) | <0.01 |
| Physical activity assessment time | ||||
| Increase of 1 day prior to index hospitalisation | 1.00 (0.99–1.00) | 0.89 | 1.00 (0.99–1.00) | 0.91 |
| Age | ||||
| Increase of 1 year | 1.05 (1.04–1.06) | <0.001 | 1.04 (1.02–1.05) | <0.001 |
| Sex | ||||
| Female versus male | 0.82 (0.68–0.98) | 0.03 | 0.76 (0.62–0.93) | <0.01 |
| Marital status | ||||
| Single versus partnered | 1.21 (0.10–1.46) | 0.05 | 1.04 (0.85–1.27) | 0.73 |
| BMI | ||||
| Normal 18.5–24.9 kg·m−2 | 1.0 | 1.0 | ||
| Underweight <18.5 kg·m−2 | 2.14 (1.64–2.81) | <0.001 | 2.40 (1.82–3.16) | <0.001 |
| Overweight 25–29.9 kg·m−2 | 0.64 (0.50–0.81) | <0.001 | 0.70 (0.54–0.89) | <0.01 |
| Obese >30 kg·m−2 | 0.49 (0.39–0.63) | <0.001 | 0.64 (0.49–0.83) | <0.001 |
| Race/ethnicity | ||||
| Non-White versus White | 0.84 (0.69–1.03) | 0.10 | 0.95 (0.77–1.17) | 0.61 |
| Smoking status | ||||
| Never/passive | 1.0 | 1.0 | ||
| Former | 1.53 (1.11–2.09) | 0.01 | 1.34 (0.97–1.85) | 0.07 |
| Current | 1.24 (0.86–1.78) | 0.25 | 1.62 (1.10–2.38) | 0.01 |
| Medications | ||||
| LABA/ICS or LAMA/ICS versus none | 0.90 (0.75–1.08) | 0.27 | 0.87 (0.72–1.06) | 0.16 |
| Systemic corticosteroids versus none | 1.71 (1.36–2.15) | <0.001 | 1.40 (1.10–1.78) | <0.01 |
| Any oxygen use versus none | 1.48 (1.22–1.79) | <0.001 | 1.16 (0.95–1.41) | 0.15 |
| Hospitalisations | ||||
| Any previous hospitalisations versus none | 1.45 (1.21–1.74) | <0.001 | 1.11 (0.91–1.36) | 0.31 |
| Comorbidities | ||||
| Charlson index score | ||||
| 0–1 | 1.0 | 1.0 | ||
| 2 | 1.31 (0.90–1.91) | 0.16 | 1.21 (0.82–1.78) | 0.34 |
| ≥ 3 | 2.43 (1.82–3.25) | <0.001 | 1.75 (1.28–2.39) | <0.001 |
| Pulmonary hypertension | 2.08 (1.67–2.59) | <0.001 | 1.69 (1.34–2.12) | <0.001 |
| Depression | 1.09 (0.88– .36) | 0.44 | 1.05 (0.84–1.33) | 0.65 |
| Pulmonary rehabilitation | ||||
| Yes versus no | 0.33 (0.19–0.58) | <0.001 | 0.47 (0.26–0.85) | 0.01 |
| Palliative care consultation | ||||
| Yes versus no | 4.40 (3.41–5.69) | <0.001 | 1.70 (1.26–2.29) | <0.001 |
| Length of stay days | ||||
| 1–2 | 1.0 | 1.0 | ||
| 3 | 1.20 (0.88–1.63) | 0.25 | 1.27 (0.93–1.74) | 0.13 |
| 4–6 | 1.69 (1.29–2.20) | <0.001 | 1.60 (1.21–2.09) | <0.001 |
| 7–13 | 2.20 (1.62–2.98) | <0.001 | 1.87 (1.35–2.57) | <0.001 |
| 14–59 | 3.20 (2.05–4.99) | <0.001 | 2.48 (1.51–4.08) | <0.001 |
| Disposition | ||||
| Home | 1.0 | 1.0 | ||
| Hospice | 11.25 (8.39–15.1) | <0.001 | 5.23 (3.74–7.34) | <0.001 |
| Post-acute/hospital | 2.64 (1.99–3.51) | <0.001 | 1.37 (0.99–1.90) | 0.06 |
| Other/missing | 2.02 (1.13–3.59) | 0.02 | 1.51 (0.84–2.71) | 0.17 |
The adjusted model included all variables listed in this table. Bold indicates statistical significance. MVPA: moderate to vigorous physical activity; BMI: body mass index; LABA: long-acting β-agonist; ICS: inhaled corticosteroid; LAMA: long-acting muscarinic antagonist.
Multivariate adjusted analyses of the relationship between MVPA and all-cause mortality
After adjustments for all key covariates (socio-demographics, medication use, previous hospitalisations, comorbidities, length of stay, discharge disposition and a palliative care consultation with the index hospitalisation, and previous exposure to pulmonary rehabilitation), patients who reported being insufficiently active or active had a significantly lower risk of death compared to inactive patients (table 3 and figure 2). Specifically, active patients had a 47% lower risk of death in the 12 months following an index COPD hospitalisation compared to inactive patients (HR 0.53 (95% CI 0.34–0.84), p<0.01). Those who were insufficiently active had a 28% lower risk of dying compared to inactive patients (HR 0.72 (95% CI 0.54–0.97), p=0.03). Other significant predictors of mortality in the adjusted model included older age, being underweight, being a current smoking, taking chronic corticosteroids, Charlson index score of ≥3, pulmonary hypertension, longer length of stay, inpatient palliative care and discharge to hospice. Being female, overweight or obese and previous participation in rehabilitation remained protective.
FIGURE 2.
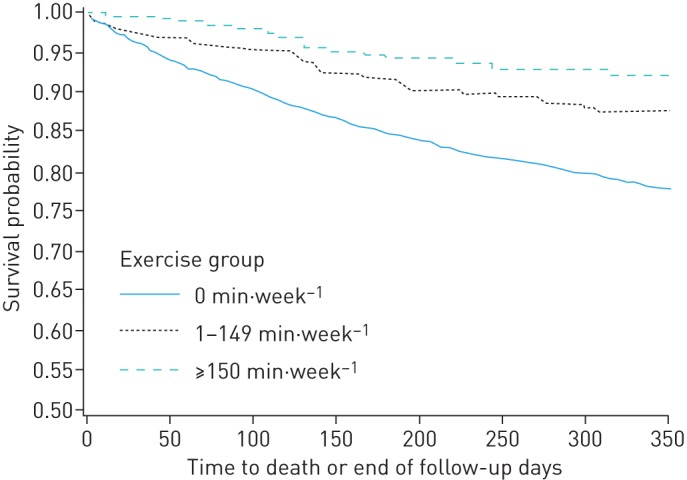
Kaplan–Meier curves of 12-month survival after an index chronic obstructive pulmonary disease-related hospitalisation according to level of moderate and vigorous physical activity (Log rank test, p<0.0001).
Multivariate adjusted competing risk-cause of death analysis
There was a significant relationship between level of MVPA and COPD-related cause of death (p=0.02) after adjustment for a similar set of covariates as the main model above. Specifically, patients who were inactive had almost a four-fold higher risk of dying of COPD-related causes compared to active patients (HR 3.8 (95% CI 1.41–10.42)). Patients who were insufficiently active had a three times higher risk of dying due to COPD compared to active patients (HR 3.0 (95% CI 1.02–8.64)).
Secondary outcome: composite of death and re-hospitalisation
MVPA was significantly associated with death and re-hospitalisation in the 12 months following an index COPD hospitalisation in both unadjusted and adjusted models, though the effects were smaller compared to the main model with death as the only primary outcome (table 4). Additional factors in the multivariate model that were significantly associated with increased risk of death or re-hospitalisation included being underweight, using systemic corticosteroids, previous hospitalisation, Charlson index score of ≥2, pulmonary hypertension, longer length of stay during the index hospitalisation and being discharged to a hospice.
TABLE 4.
Unadjusted and adjusted Cox proportional hazard regression models predicting the composite outcome of mortality and re-hospitalisations 12 months after index chronic obstructive pulmonary disease (COPD) hospitalisation in 2370 patients with COPD
| Factor | Unadjusted models | Adjusted model | ||
| HR (95% CI) | p-value | (HR 95% CI) | p-value | |
| Baseline MVPA (closest to index hospitalisation) | ||||
| 0 min·week−1 | 1.0 | 1.0 | ||
| 1–149 min·week−1 | 0.80 (0.69–0.92) | <0.01 | 0.85 (0.73–0.97) | 0.02 |
| ≥150 min·week−1 | 0.67 (0.55–0.81) | <0.001 | 0.75 (0.62–0.91) | <0.01 |
| Physical activity assessment time | ||||
| Increase of 1 day prior to index hospitalisation | 1.0 (0.99–1.00) | <0.01 | 1.0 (0.99–1.00) | 0.03 |
| Age | ||||
| Increase of 1 year | 1.01 (1.01–1.02) | <0.001 | 1.00 (1.00–1.01) | 0.28 |
| Sex | ||||
| Female versus male | 0.96 (0.86–1.06) | 0.39 | 0.95 (0.85–1.06) | 0.38 |
| Marital status | ||||
| Single versus partnered | 1.10 (0.99–1.22) | 0.07 | 1.06 (0.95–1.18) | 0.32 |
| BMI | ||||
| Normal 18.5–24.9 kg·m−2 | 1.0 | 1.0 | ||
| Underweight <18.5 kg·m−2 | 1.20 (0.98–1.47) | 0.07 | 1.27 (1.03–1.55) | 0.02 |
| Overweight 25–29.9 kg·m−2 | 1.01 (0.88–1.15) | 0.94 | 1.01 (0.88–1.15) | 0.91 |
| Obese >30 kg·m−2 | 0.88 (0.78–1.00) | 0.05 | 0.86 (0.75–0.99) | 0.04 |
| Race/ethnicity | ||||
| Non-White versus White | 1.04 (0.93–1.16) | 0.50 | 1.05 (0.94–1.18) | 0.38 |
| Smoking status | ||||
| Never/passive | 1.0 | 1.0 | ||
| Former | 1.12 (0.96–1.31) | 0.15 | 1.05 (0.89–1.23) | 0.55 |
| Current | 0.84 (0.70–1.01) | 0.07 | 1.00 (0.81–1.22) | 0.96 |
| Medications | ||||
| LABA/ICS or LAMA/ICS versus none | 1.20 (1.08–1.33) | <0.001 | 1.10 (0.99–1.22) | 0.09 |
| Systemic corticosteroids versus none | 1.54 (1.34–1.76) | <0.001 | 1.20 (1.04–1.38) | <0.01 |
| Any oxygen use versus none | 1.13 (1.01–1.26) | 0.04 | 1.02 (0.91–1.14) | 0.80 |
| Hospitalisations | ||||
| Any previous hospitalisations versus none | 1.72 (1.55–1.90) | <0.001 | 1.45 (1.30–1.63) | <0.001 |
| Comorbidities | ||||
| Charlson index | ||||
| 0–1 | 1.0 | 1.0 | ||
| 2 | 1.34 (1.11–1.60) | <0.01 | 1.21 (1.01–1.46) | 0.04 |
| ≥3 | 1.85 (1.61–2.14) | <0.001 | 1.50 (1.28–1.75) | <0.001 |
| Pulmonary hypertension | 1.52 (1.32–1.75) | <0.001 | 1.23 (1.07–1.42) | <0.001 |
| Depression | 1.13 (1.00–1.28) | 0.05 | 1.02 (0.89–1.15) | 0.82 |
| Pulmonary rehabilitation | ||||
| Yes versus none | 0.99 (0.81–1.20) | 0.89 | 1.00 (0.82–1.23) | 0.97 |
| Palliative care consultation | ||||
| Yes versus no | 1.80 (1.47–2.20) | <0.001 | 1.19 (0.95–1.49) | 0.14 |
| Length of stay days | ||||
| 1–2 | 1.0 | 1.0 | ||
| 3 | 1.03 (0.88–1.20) | 0.71 | 1.04 (0.89–1.22) | 0.59 |
| 4–6 | 1.31 (1.15–1.51) | <0.001 | 1.24 (1.08–1.43) | <0.001 |
| 7–13 | 1.47 (1.24–1.74) | <0.001 | 1.33 (1.11–1.58) | <0.001 |
| 14–59 | 2.07 (1.56–2.75) | <0.001 | 1.71 (1.26–2.32) | <0.001 |
| Disposition | ||||
| Home | 1.0 | 1.0 | ||
| Hospice | 2.56 (1.96–3.35) | <0.001 | 1.74 (1.30–2.33) | <0.001 |
| Post-acute/hospital | 1.41 (1.16–1.72) | <0.001 | 1.14 (0.92–1.41) | 0.22 |
| Other/missing | 1.06 (0.71–1.59) | 0.78 | 1.03 (0.69–1.56) | 0.87 |
The adjusted model included all variables listed in this table. Bold indicates statistical significance. MVPA: moderate to vigorous physical activity; BMI: body mass index; LABA: long-acting β-agonist; ICS: inhaled corticosteroid; LAMA: long-acting muscarinic antagonist.
Sensitivity analyses
In the subset of patients with spirometry data, the model that adjusted for forced expiratory volume in 1 s % pred showed that the magnitude of the risk of death was similar to the main model for the active patients (HR 0.53 (95% CI 0.28–1.01), p=0.06) and attenuated for the insufficiently active patients (HR 0.88 (95% CI 0.60–1.28), p=0.50), compared to inactive patients (table 5). In this sensitivity analysis we found that forced expiratory volume in 1 s % pred was a marginally significant predictor of death (p=0.06). When we excluded a subgroup of patients who were never-smokers we found that the risk of death was similar to the main model (active: HR 0.57 (95% CI 0.35–0.90), p=0.02; insufficiently active: HR 0.71 (95% CI 0.52–0.97), p=0.03). Using three different summary values of exercise vital sign, we found risks for death similar to the main model: any MVPA versus no MVPA (HR 0.66 (95% CI 0.51–0.85), p<0.001); mode/median (active: HR 0.62 (95% CI 0.37–1.03), p=0.07; insufficiently active: HR 0.61 (95% CI 0.43–0.88), p<0.01) and highest (active: HR 0.59 (95% CI 0.47–0.76), p<0.001; insufficiently active: HR 0.69 (95% CI 0.55–0.85), p=0.001).
TABLE 5.
Sensitivity analyses for the primary outcome of mortality
| Factor | Subjects n | Adjusted model | p-value |
| HR (95% CI) | |||
| Baseline MVPA (closest to index hospitalisation) | |||
| Patients with spirometry#,¶ | 1292 | ||
| 0 min·week−1 | 1.0 | ||
| 1–149 min·week−1 | 0.88 (0.60–1.28) | 0.50 | |
| ≥150 min·week−1 | 0.53 (0.28–1.01) | 0.06 | |
| Patients with smoking history# | 2066 | ||
| 0 min·week−1 | 1.0 | ||
| 1–149 min·week−1 | 0.71 (0.52–0.97) | 0.03 | |
| ≥150 min·week−1 | 0.57 (0.35–0.90) | 0.02 | |
| Any MVPA# (closest to index hospitalisation) | 2370 | ||
| 0 min·week−1 | 1.0 | ||
| ≥1 min·week−1 | 0.66 (0.51–0.85) | <0.001 | |
| Median/mode MVPA+ | 2370 | ||
| 0 min·week−1 | 1.0 | ||
| 1–149 min·week−1 | 0.61 (0.43–0.88) | <0.01 | |
| ≥150 min·week−1 | 0.62 (0.37–1.03) | 0.07 | |
| Highest MVPA§ | 2370 | ||
| 0 min·week−1 | 1.0 | ||
| 1–149 min·week−1 | 0.69 (0.55–0.85) | <0.001 | |
| ≥150 min·week−1 | 0.59 (0.47–0.76) | <0.001 |
Cox regression models adjusted for age, marital status, race/ethnicity, body mass index, smoking status, disease severity (medications, oxygen use, Charlson comorbidity index, pulmonary hypertension, depression, any hospitalisation in previous 12 months), ever attended pulmonary rehabilitation in the 3 years prior to the index hospitalisation, palliative care consultation during the index hospitalisation, length of stay, discharge disposition and duration of time from assessment of physical activity to index hospitalisation. MVPA: moderate to vigorous physical activity. #: included on indicated models; ¶: forced expiratory volume in 1s % predicted was included in the adjusted model and was not a significant predictor of death; +: based on all physical activity readings over 12 months prior to index hospitalisation; §: highest physical activity reading over 12 months prior to index hospitalisation.
Discussion
Patients with COPD-related hospitalisation who engaged in any level of MVPA prior to the index hospitalisation had a 28–47% lower risk of dying over the subsequent 12 months compared to patients who performed no MVPA. Higher levels of MVPA were significantly associated with a lower risk of dying from COPD but not with other causes of death, with any amount of MVPA being beneficial. We have shown that patient self-reporting physical activity using two simple questions, which can be easily assessed in routine care, has predictive value. Our findings demonstrate the importance of routinely assessing physical activity in clinical care to identify high-risk patients, as well as the need to conduct prospective controlled studies to determine if interventions to increase MVPA improve survival in patients who have been hospitalised for a COPD exacerbation.
Although physical activity has been shown to be a predictor of death in stable outpatient cohorts [17, 18, 20, 24], this is the first study to our knowledge demonstrating low physical activity to be an independent predictor of death in a high-risk cohort hospitalised for an acute exacerbation. Our results also provide an estimate of the magnitude of the risk for death in inactive persons with COPD after a hospitalisation. These findings are pragmatic in informing specific clinical recommendations to patients and have high clinical relevance.
It is important to note that nearly 75% of the deaths were preceded by a hospitalisation for COPD or other causes. When we examined death and re-hospitalisation as a composite outcome, we found that MVPA remained a strong independent predictor. While our findings suggest that physical activity level is another useful predictor of mortality, engagement in any level of MVPA and thus maintenance of a physically active lifestyle in this population could potentially buffer the physical and emotional stresses of repeated hospitalisations due to COPD or other causes. The physiological processes underlying the relationship between physical activity and COPD outcomes are complex and only partially understood. However, it has been hypothesised that physical inactivity leads to cellular and molecular dysregulation [32] via increased inflammatory processes [33–36], which directly contributes to the development and progression of multiple comorbidities [37, 38]. A recent longitudinal study that monitored physical activity for 3 years in stable patients with COPD found that, independent of disease severity, patients who were persistently inactive had greater declines in functional capacity and fat-free mass compared to those who engaged in some level of physical activity [39].
We also identified other lifestyle factors such as active cigarette smoking, no participation in pulmonary rehabilitation and poor nutritional status (represented by low body mass index) as independent predictors of death. Our study emphasises the need for continued multidisciplinary interventions to improve outcomes by promoting long-term behaviour change. Other significant independent predictors of death, such as older age, male sex, use of systemic corticosteroids, history of prior hospitalisations [8, 40], greater numbers of comorbidities [8, 10], pulmonary hypertension [8] and longer length of stay [8] are consistent with previous studies.
The strengths of our study include a relatively well-characterised, large, contemporary, racially diverse and sex balanced sample, and the use of physical activity data that are routinely captured during clinical practice, complete capture of utilisation and claims data, and estimates of the effects of physical activity on death that remain robust to sensitivity analyses.
There are several limitations to this study. Since physical activity was self-reported during routine outpatient encounters, it is possible that patients may have been experiencing an exacerbation when the exercise vital sign data were collected or that, for patients who were later hospitalised, the closest exercise vital sign data already reflected the diminished physical activity associated with their current illness. However, our risk estimates remained robust despite adjustments for the time between the index hospitalisation and exercise vital sign assessment and using different summary values of exercise vital sign that are less affected by timing of the assessment. In addition, we recognise that the classification of MVPA according to the exercise vital sign questions for this clinical population is subjective and only captures patients' actual functional performance not their capacity, which would normally be assessed with objective cardiopulmonary exercise testing. Moreover, patients' level of MVPA is probably dependent on their capacity. Lung function was not assessed in all patients, but our inclusion criteria and sensitivity analysis argue against any significant misclassification. We adhered to the CMS definition of hospitalisation for COPD exacerbations in order to be as generalisable as possible, to allow comparison with other studies and to most accurately reflect real-world settings. Because of the retrospective, observational design that relied on the availability of existing data, we may not have accurately captured all variables of interest, e.g. symptom severity and exercise capacity, and we are not able to make strong inferences about causation.
Conclusions
Using a routine simple exercise vital sign, patients who report engagement in any level of MVPA are at lower risk of dying in the 12 months following an index COPD hospitalisation, compared to those who are physically inactive. Assessment of physical activity should be routinely performed in clinical care to identify high-risk patients.
Footnotes
Support statement: This study was supported by the Kaiser Permanente Southern California Care Improvement Research Team (CIRT) (Pasadena, CA, USA).
Conflict of interest: None declared.
References
- 1.Albert RK, Connett J, Bailey WC, et al. Azithromycin for prevention of exacerbations of COPD. N Engl J Med 2011; 365: 689–698. [DOI] [PMC free article] [PubMed] [Google Scholar]
- 2.Hurst JR, Vestbo J, Anzueto A, et al. Susceptibility to exacerbation in chronic obstructive pulmonary disease. N Engl J Med 2010; 363: 1128–1138. [DOI] [PubMed] [Google Scholar]
- 3.Connors AF Jr, Dawson NV, Thomas C, et al. Outcomes following acute exacerbation of severe chronic obstructive lung disease. The SUPPORT investigators (Study to Understand Prognoses and Preferences for Outcomes and Risks of Treatments). Am J Respir Crit Care Med 1996; 154: 959–967. [DOI] [PubMed] [Google Scholar]
- 4.Seemungal TA, Donaldson GC, Paul EA, et al. Effect of exacerbation on quality of life in patients with chronic obstructive pulmonary disease. Am J Respir Crit Care Med 1998; 157: 1418–1422. [DOI] [PubMed] [Google Scholar]
- 5.Patil SP, Krishnan JA, Lechtzin N, et al. In-hospital mortality following acute exacerbations of chronic obstructive pulmonary disease. Arch Intern Med 2003; 163: 1180–1186. [DOI] [PubMed] [Google Scholar]
- 6.Strassels SA, Smith DH, Sullivan SD, et al. The costs of treating COPD in the United States. Chest 2001; 119: 344–352. [DOI] [PubMed] [Google Scholar]
- 7.Jencks SF, Williams MV, Coleman EA. Rehospitalizations among patients in the Medicare fee-for-service program. N Engl J Med 2009; 360: 1418–1428. [DOI] [PubMed] [Google Scholar]
- 8.McGhan R, Radcliff T, Fish R, et al. Predictors of rehospitalization and death after a severe exacerbation of COPD. Chest 2007; 132: 1748–1755. [DOI] [PubMed] [Google Scholar]
- 9.Sharif R, Parekh TM, Pierson KS, et al. Predictors of early readmission among patients 40 to 64 years of age hospitalized for chronic obstructive pulmonary disease. Ann Am Thorac Soc 2014; 11: 685–694. [DOI] [PMC free article] [PubMed] [Google Scholar]
- 10.Almagro P, Cabrera FJ, Diez J, et al. Comorbidities and short-term prognosis in patients hospitalized for acute exacerbation of COPD: the EPOC en Servicios de medicina interna (ESMI) study. Chest 2012; 142: 1126–1133. [DOI] [PubMed] [Google Scholar]
- 11.Almagro P, Calbo E, Ochoa de Echaguen A, et al. Mortality after hospitalization for COPD. Chest 2002; 121: 1441–1448. [DOI] [PubMed] [Google Scholar]
- 12.Kessler R, Faller M, Fourgaut G, et al. Predictive factors of hospitalization for acute exacerbation in a series of 64 patients with chronic obstructive pulmonary disease. Am J Respir Crit Care Med 1999; 159: 158–164. [DOI] [PubMed] [Google Scholar]
- 13.Groenewegen KH, Schols AM, Wouters EF. Mortality and mortality-related factors after hospitalization for acute exacerbation of COPD. Chest 2003; 124: 459–467. [DOI] [PubMed] [Google Scholar]
- 14.Garcia-Aymerich J, Farrero E, Felez MA, et al. Risk factors of readmission to hospital for a COPD exacerbation: a prospective study. Thorax 2003; 58: 100–105. [DOI] [PMC free article] [PubMed] [Google Scholar]
- 15.Vestbo J, Hurd SS, Agusti AG, et al. Global strategy for the diagnosis, management and prevention of chronic obstructive pulmonary disease: GOLD Executive Summary. Am J Respir Crit Care Med 2013; 187: 347–365. [DOI] [PubMed] [Google Scholar]
- 16.Quintana JM, Unzurrunzaga A, Garcia-Gutierrez S, et al. Predictors of hospital length of stay in patients with exacerbations of COPD: a cohort study. J Gen Intern Med 2015; 30: 824–831. [DOI] [PMC free article] [PubMed] [Google Scholar]
- 17.Vaes AW, Garcia-Aymerich J, Marott JL, et al. Changes in physical activity and all-cause mortality in COPD. Eur Respir J 2014; 44: 1199–1209. [DOI] [PubMed] [Google Scholar]
- 18.Garcia-Aymerich J, Lange P, Benet M, et al. Regular physical activity reduces hospital admission and mortality in chronic obstructive pulmonary disease: a population based cohort study. Thorax 2006; 61: 772–778. [DOI] [PMC free article] [PubMed] [Google Scholar]
- 19.Moy ML, Teylan M, Weston NA, et al. Daily step count predicts acute exacerbations in a US cohort with COPD. PLoS One 2013; 8: e60400. [DOI] [PMC free article] [PubMed] [Google Scholar]
- 20.Waschki B, Kirsten A, Holz O, et al. Physical activity is the strongest predictor of all-cause mortality in patients with chronic obstructive pulmonary disease: a prospective cohort study. Chest 2011; 140: 331–342. [DOI] [PubMed] [Google Scholar]
- 21.Moy ML, Teylan M, Danilack VA, et al. An index of daily step count and systemic inflammation predicts clinical outcomes in chronic obstructive pulmonary disease. Ann Am Thorac Soc 2014; 11: 149–157. [DOI] [PubMed] [Google Scholar]
- 22.Chawla H, Bulathsinghala C, Tejada JP, et al. Physical activity as a predictor of thirty-day hospital readmission after a discharge for a clinical exacerbation of chronic obstructive pulmonary disease. Ann Am Thorac Soc 2014; 11: 1203–1209. [DOI] [PubMed] [Google Scholar]
- 23.Nguyen HQ, Chu L, Liu IL, et al. Associations between physical activity and 30-day readmission risk in chronic obstructive pulmonary disease. Ann Am Thorac Soc 2014; 11: 695–705. [DOI] [PubMed] [Google Scholar]
- 24.Gimeno-Santos E, Frei A, Steurer-Stey C, et al. Determinants and outcomes of physical activity in patients with COPD: a systematic review. Thorax 2014; 69: 731–739. [DOI] [PMC free article] [PubMed] [Google Scholar]
- 25.Stein BD, Bautista A, Schumock GT, et al. The validity of International Classification of Diseases, Ninth Revision, Clinical Modification diagnosis codes for identifying patients hospitalized for COPD exacerbations. Chest 2012; 141: 87–93. [DOI] [PMC free article] [PubMed] [Google Scholar]
- 26.National Quality Forum. NQF #1891 Hospital 30-Day, All-Cause, Risk-Standardized Readmission Rate (RSRR) following Chronic Obstructive Pulmonary Disease (COPD) Hospitalization. Measure submission and evaluation worksheet 5.0 Washington, National Quality Forum, 2012. [Google Scholar]
- 27.Coleman KJ, Ngor E, Reynolds K, et al. Initial validation of an exercise “vital sign” in electronic medical records. Med Sci Sports Exerc 2012; 44: 2071–2076. [DOI] [PubMed] [Google Scholar]
- 28.Grant RW, Schmittdiel JA, Neugebauer RS, et al. Exercise as a vital sign: a quasi-experimental analysis of a health system intervention to collect patient-reported exercise levels. J Gen Intern Med 2014; 29: 341–348. [DOI] [PMC free article] [PubMed] [Google Scholar]
- 29.Prevalence of self-reported physically active adults – United States, 2007. MMWR Morb Mortal Wkly Rep 2008; 57: 1297–1300. [PubMed] [Google Scholar]
- 30.Charlson ME, Pompei P, Ales KL, et al. A new method of classifying prognostic comorbidity in longitudinal studies: development and validation. J Chronic Dis 1987; 40: 373–383. [DOI] [PubMed] [Google Scholar]
- 31.Roberts CM, Stone RA, Lowe D, et al. Co-morbidities and 90-day outcomes in hospitalized COPD exacerbations. COPD 2011; 8: 354–361. [DOI] [PubMed] [Google Scholar]
- 32.Thompson PD, Buchner D, Pina IL, et al. Exercise and physical activity in the prevention and treatment of atherosclerotic cardiovascular disease. Circulation 2003; 107: 542–550. [Google Scholar]
- 33.Moy ML, Teylan M, Weston NA, et al. Daily step count is associated with plasma C-reactive protein and IL-6 in a US Cohort with COPD. Chest 2014; 145: 3109–3116. [DOI] [PubMed] [Google Scholar]
- 34.Troosters T, van der Molen T, Polkey M, et al. Improving physical activity in COPD: towards a new paradigm. Respir Res 2013; 14: 115. [DOI] [PMC free article] [PubMed] [Google Scholar]
- 35.Broekhuizen R, Wouters EF, Creutzberg EC, et al. Raised CRP levels mark metabolic and functional impairment in advanced COPD. Thorax 2006; 61: 17–22. [DOI] [PMC free article] [PubMed] [Google Scholar]
- 36.Agusti A. Systemic effects of chronic obstructive pulmonary disease: what we know and what we don't know (but should). Proc Am Thorac Soc 2007; 4: 522–525. [DOI] [PubMed] [Google Scholar]
- 37.Ford ES. Does exercise reduce inflammation? Physical activity and C-reactive protein among U.S. adults. Epidemiology 2002; 13: 561–568. [DOI] [PubMed] [Google Scholar]
- 38.Watz H, Waschki B, Kirsten A, et al. The metabolic syndrome in patients with chronic bronchitis and COPD: frequency and associated consequences for systemic inflammation and physical inactivity. Chest 2009; 136: 1039–1046. [DOI] [PubMed] [Google Scholar]
- 39.Waschki B, Kirsten AM, Holz O, et al. Disease progression and changes in physical activity in patients with chronic obstructive pulmonary disease. Am J Respir Crit Care Med 2015; 192: 295–306. [DOI] [PubMed] [Google Scholar]
- 40.Garcia-Aymerich J, Monso E, Marrades RM, et al. Risk factors for hospitalization for a chronic obstructive pulmonary disease exacerbation. EFRAM study. Am J Respir Crit Care Med 2001; 164: 1002–1007. [DOI] [PubMed] [Google Scholar]