Abstract
The concentration of hydrogen peroxide (H2O2) in exhaled air has been reported to be elevated in asthma and chronic obstructive pulmonary disease (COPD), but results are inconsistent and difficult to reproduce. As H2O2 occurs in ambient air, we examined its association with exhaled H2O2 in human subjects.
Exhaled breath condensate (EBC) of 12 COPD patients and nine healthy control subjects was collected either with an inhalation filter (efficiency 81%) or without. Ambient air condensate (AAC) was collected in parallel and samples were analysed for H2O2. Additionally, ambient H2O2 was recorded by an atmospheric measuring device (online fluorometric measurement).
H2O2 concentration in AAC was significantly higher (p<0.001) than in EBC. AAC variations were concordant with the data from the atmospheric measuring instrument. In both subjects' groups, the inhalation filter reduced H2O2 values (p<0.01). Despite generally low levels in exhaled air, analysis by a mathematical model revealed a contribution from endogenous H2O2 production.
The low H2O2 levels in exhaled air are explained by the reconditioning of H2O2-containing inhaled air in the airways. Inhaled H2O2 may be one factor in the heterogeneity and limited reproducibility of study results. A valid determination of endogenous H2O2 production requires inhalation filters.
Short abstract
Use of an inhalation filter reduces variability of H2O2 values in exhaled air and shows an endogenous production http://ow.ly/TRmj300ee8t
Introduction
Over the past decades, noninvasive methods for assessing airway inflammation have been extensively studied, among these the analysis of exhaled breath condensate (EBC). A multitude of compounds have been detected in EBC; however, there always remained questions of validity and reproducibility [1]. This also holds for hydrogen peroxide (H2O2) which has been studied in various diseases and conditions such as asthma [2–5], chronic obstructive pulmonary disease (COPD) [1, 6–10] and lung cancer [11, 12]. Some of these studies reported increased concentrations of H2O2 [3, 7, 9, 12, 13], but the questions of reproducibility and publication bias remain [14–16]. In principle, exhaled H2O2 is attractive as a potential marker of neutrophilic inflammation [11] and could be a clinical counterpart to exhaled nitric oxide (FeNO) as a marker often associated with eosinophilic inflammation [2, 11, 17].
H2O2 also occurs in ambient air, predominantly in vapour form, which has been known since the 1870s [18] but has been rarely considered [19]. If the concentrations found in EBC are expressed as vapour in relation to water vapour, it turns out that the concentrations reported by Schöne [18] as well as in meteorological papers [20, 21] are of the same order of magnitude as the values in EBC. Recent findings confirmed this, as H2O2 concentrations measured in exhaled air of calves, particularly in EBC, were significantly correlated with the ones assessed in ambient air [19]. In the present study, we aimed at a critical evaluation of the association between H2O2 concentrations in exhaled air and ambient air in human subjects, taking into account the reconditioning of air during inhalation via a mathematical model. In particular we addressed the question of whether the variability of measurements can be reduced by appropriate technical measures and what the contribution from endogenous H2O2 is relative to the estimated contribution from inhaled ambient air. Basically, the approach was to measure ambient H2O2 with the intention of computing the H2O2 concentration in exhaled air that is to be expected from unaltered inhaled H2O2 utilising a mathematical model and to compare these values with the measured values.
Subjects and methods
Study protocol
The study comprised two parts. The first part aimed at validating the measurement tools. For this purpose, ambient air was measured with a commercial atmospheric measurement device (H2O2 AL2021 monitor; Aero Laser, Garmisch-Partenkirchen, Germany) and a commercial cooling system for collecting EBC (EcoScreen; Jaeger, Hoechberg, Germany; with improved collecting tube). The aim was to assess ambient H2O2 concentrations at varying levels, to establish the empirical relationship between EBC concentrations and atmospheric vapour pressure of H2O2 and to compare this with the theoretically expected relationship. Due to technical constraints, the exhaled air could only be measured via EBC and not by the Aero Laser monitor.
The Aero Laser device detects H2O2 online in the gas phase (ppb; detection limit <50 ppt in the gas phase). Using two enzymatic reactions it separately assesses the contributions from H2O2 and from other peroxides that may have similar fluorescence properties as H2O2 [20–22]. As atmospheric H2O2 rarely reaches very high concentrations, different levels of H2O2 were generated in a work bench (LaminAir HB 2448; Heraeus Instruments, Hanau, Germany) of about 0.5 m3 using whirled solutions of H2O2 concentrations at room temperature. The large volume ensured that the concentrations did not markedly change over the sampling time.
The efficiency of the inhalation filter (filter respirator type: A2B2E2K1HgNOP3 NR D CO; Sperian, Villers-Cotterêts, France) used for the measurements in subjects was assessed by determinations of H2O2 levels of air drawn either through or without the filter. The efficiency turned out to be 0.81, i.e. at maximum 19% of peroxides passed the filter without a reduction of efficiency in the course of our study. Specific measurements for H2O2 indicated an efficiency near 100%.
The second part of the study aimed at assessing the H2O2 contribution from inhaled to exhaled air of human subjects. This was achieved by performing EBC sampling with and without inhalation filter, as well as by using a mathematical model to compute the relationship between inhaled and exhaled H2O2 levels and to estimate a potential endogenous production of H2O2 from these data. For this purpose, we studied 12 patients with stable COPD of stages Global Initiative for Chronic Obstructive Lung Disease (GOLD) I–III (n=2, 5, 5, respectively) aged 60–80 years, and nine healthy nonsmokers aged 25–58 years. Two patients with COPD additionally suffered from asthma according to their medical history. We did not aim at revealing differences between these groups but at testing the applicability of our methods and therefore considered these group sizes as sufficient. Measurements were part of a local extension of a multi-centre COPD study and both had been approved by the local ethics committee.
Measurements
2–4 h prior to the collection of EBC from a subject, condensate sampling from ambient laboratory air was started (ambient air condensate (AAC)). This was achieved via an electric pump (∼4 L·min−1) continuously sucking air through the mouthpiece of the EcoScreen device for 90–240 min resulting in a sample volume of 1.5–6.5 mL. The continuous Aero Laser recordings indicated that ambient air concentrations were fairly stable over this period of time, although H2O2 levels in ambient air are generally known to depend on the time of the day. They also depend on meteorological conditions, e.g., correlate with ozone levels which also could be observed in our study.
After the collection of ambient air the measurements of subjects were started. EBC was collected for 15 min from subjects breathing at rest through a mouthpiece without inhalation filter while wearing a nose clip. After a short pause, a second EBC sample was collected for 15 min but, in this case, subjects inhaled through the filter which was placed at the inlet of a two-way valve. The subjects were allowed to briefly withdraw from the mouthpiece in case of coughing or accumulation of saliva. The mouthpiece of the EcoScreen device was positioned in a way as to avoid contamination of samples with saliva. Custom-made collection tubes were assembled from polypropylene components. All samples, either from ambient air or subjects, were stored immediately after collection in sealed collection tubes at 4°C. The maximum time period until analysis was 3 h for ambient air samples and 1 h for breath samples. By repeated measurements of aliquots of samples we had ensured that H2O2 concentrations were stable. In parallel to condensate sample collection humidity and temperature of room air were recorded (Testo 445; Testo AG, Lenzkirch, Germany), air pressure values were taken from official records.
Analysis of H2O2 in condensate
H2O2 in the condensate was quantified by an optimised method based on that given by Hyslop et al. [23]. The optimisation involved the comparison of consumables from different sources and the identification of those yielding the most reliable and reproducible data. For analysis, the non-fluorescent 4-hydroxyphenylacetic acid (H50004; Sigma Aldrich, St. Louis, MI, USA) was converted by the enzymatic reduction of H2O2 via horseradish peroxidase (p8375; Sigma Aldrich) into the stable, fluorescent product 2,2′-dihydroxybiphenyl-5,5′-diacetate. 96-well plates (237105, Nunc, Roskilde, Denmark) and water of p.a. quality (1.16754.9010, Merck KgaA, Darmstadt, Germany) were used. The fluorescence measurements were done in a plate reader (Varioskan Flash Multimode Reader, Thermo Scientific, Dreieich, Germany). To achieve the required precision in the determination of H2O2 in various matrices, we used standard addition to samples. Specifically, each sample was measured in aliquots including a standard curve of four concentrations. Moreover, assessments were done in duplicate. For data analysis, mean values were taken. Standard additions of water samples were used for the calculation of the detection limit (0.34 µM). Reproducibility was 15% in the lower range of measured values (variation coefficient) and 7% in the mid range.
The H2O2 measurement within the Aero Laser AL2021 is based on the enzymatic reaction described above, which is known to be sensitive to all peroxides in a solution. Moreover, H2O2 is selectively destroyed by catalase (C100; Sigma Aldrich) in a parallel channel. The difference between the two signals yields the H2O2 concentration. As the levels of peroxides other than H2O2 were low, we used the H2O2 signal for all analyses.
Computational model
The purpose of the model was to answer the question, whether there is endogenous production of H2O2 in the lung despite the fact that, empirically and theoretically, H2O2 concentrations in exhaled air are lower than in inhaled air. The dependence of exhaled H2O2 on expiratory flow rate suggests that the major fraction is gaseous and originates in the airways [15]: this can be described by simple physical principles, whereas it does not seem possible within a simple model to accommodate for compounds not in vapour form.
Inhaled air undergoes a change in temperature and humidification in the lung. To compare ambient air with exhaled air, ambient air values were converted to BTPS conditions (body temperature ambient barometric pressure and saturated with vapour), using the measured relative humidity φ (%) and temperature T (K). Due to the humidification of air, i.e. addition of water molecules, H2O2 should be diluted in exhaled relative to inhaled air even if there is no absorption or production in the lung. We assumed that H2O2 and water froze out with the same efficiency in the device used.
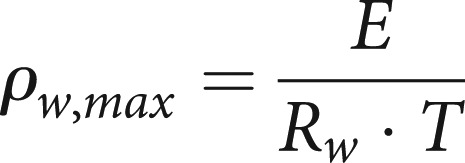
First, we calculated a temperature- and humidity-dependent conditioning factor Γ for water vapour. Using relative humidity φ, vapour pressure e, saturation vapour pressure E, absolute humidity ρw, maximum absolute humidity ρw,max, the gas constant Rw, and temperature T, the basic formulae are:
 |
1 |
 |
2 |
 |
3 |
Using this and the Magnus formula for the calculation of saturation vapour pressure (a good approximation from −45 to 60°C), one obtains for the density of water vapour
 |
4 |
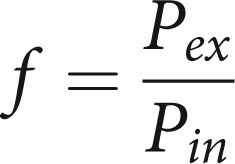
This formula is valid for both inhaled (in) and exhaled (ex) air if the appropriate values for temperature and humidity are put in. The ratio of expiration to inspiration provides a factor for the change in water content due to reconditioning within the lung. The total reconditioning factor Γ has to contain a further factor f representing the change in the total volume of inhaled air resulting from the temperature change and from the change in the relative numbers of molecules at fixed ambient air pressure:
 |
5 |
With Pamb the ambient air pressure, the factor f is:
 |
6 |
 |
7 |
 |
8 |
Where upon
 |
9 |
This formula is based on the general gas equation. The change in volume of the real, isobaric change of state is equal to the pressure change at a theoretical, isochoric change of state. For the pressure e from formula (1) we take the water vapour pressure Pw. Thus the final result for the conditioning factor Γ is:
 |
10 |
Since the amount of H2O2 can be neglected in comparison to water, the ambient air vapour concentrations divided by the factor Γ provide the expected vapour concentrations of H2O2 in exhaled air under the assumption that H2O2 is passed from inhaled to exhaled air without absorption or production. Any deviation from this prediction would point to either net production and/or absorption in the lung, except for the improbable case that absorption exactly balances production.
Data analysis
Mean values and interquartile ranges were used for the description of the data, Mann–Whitney U-tests for the comparisons of groups, and Wilcoxon matched-pairs signed-ranks tests for the comparison of conditions within groups. For the comparison of AAC and Aero Laser measurements, linear regression analysis was employed. The level of statistical significance was assumed at p=0.05, without corrections for the multiplicity of tests. For analysis, the statistical software sigma plot 13.0 (Systat Software Inc., Erkrath, Germany) was used. The model computations were done in Excel (Excel 2010, Microsoft, Redmond, WA, USA).
Results
Validation of H2O2 measurements
The comparison of H2O2 levels of artificially enriched ambient air measured by the two methods showed a linear relationship (AAC = 2.02 × AeroLaser + 2.23; figure 1). This directly allowed expressing H2O2 levels in condensate as equivalent partial pressures or volume fractions of H2O2. The fact that the intercept was greater than zero (95% CI: 0.55–3.91) and the slope greater than one (95% confidence interval: 1.65–2.40) indicated a systematic difference between the two readings, possibly due to the fact that the condensate method is sensitive to all peroxides, not only H2O2. The total peroxide readings from the Aero Laser device were difficult to calibrate in absolute terms and therefore not used.
FIGURE 1.
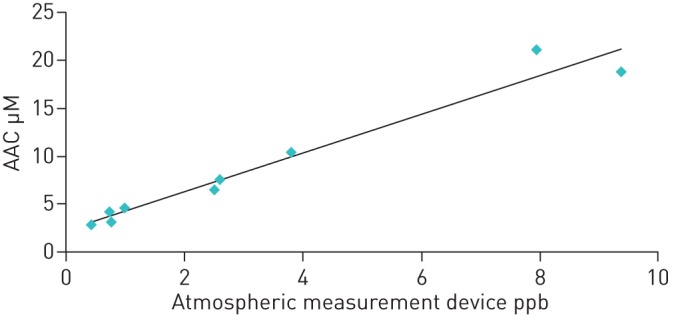
Relationship between values of H2O2 assessed in ambient air condensate (AAC) and by the Aero Laser atmospheric measuring device.
The findings indicated that the major proportion of peroxides measured by the condensate method consisted of H2O2 suggesting that the computations based on vapour properties of inhaled and exhaled H2O2 were justified. The fact that during the measurements in patients ambient air levels of H2O2 correlated with those of ozone (figure 2) was expected from meteorological findings and supported the validity of measurements also in the range of lower H2O2 levels. Ozone data were taken from the records of the nearest measuring station of Munich Ambient Air Monitoring Programme (LfU Bavaria).
FIGURE 2.
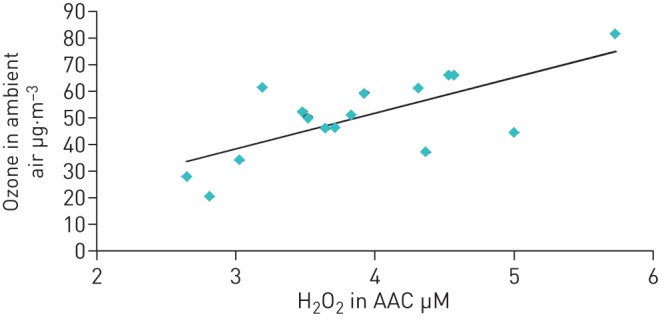
Relationship between ambient air ozone concentrations (outdoor values taken from LfU Bavaria at the nearest measuring site) and ambient air condensate (AAC) concentrations of H2O2 (indoor).
Results in human subjects
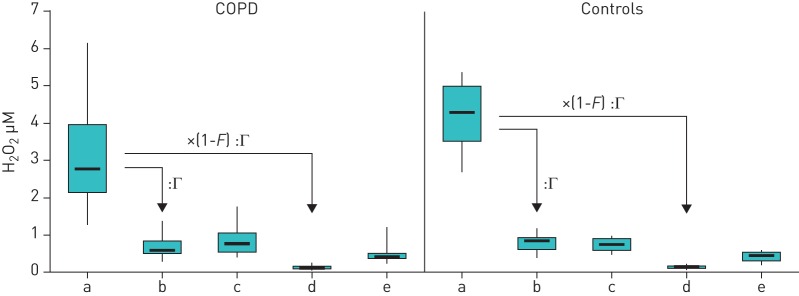
All subjects tolerated the measurements well, including the elevated resistance during inhalation through the filter. None of the subjects interrupted the sampling periods by withdrawing from the mouthpiece. The ambient air levels of H2O2 were not significantly different between the measurements of COPD patients and those of control subjects (figure 3; table 1). The same was true for ambient air pressure and temperature. In addition, neither the values assessed without inhalation filter nor those assessed with inhalation filter were significantly different between the two groups.
FIGURE 3.
Comparison of exhaled H2O2 values in chronic obstructive pulmonary disease (COPD) patients (n=12) and control group (n=9). a) Raw ambient air concentrations. Calculated exhaled equivalents of ambient air concentration (b; taking account of the conditioning factor Γ; see Methods section) can be compared with the values measured in subjects without inhalation filter (c). Moreover, the calculated exhaled equivalents of ambient air concentration with inhalation filter (d; taking account of the conditioning factor Γ and filter efficiency F; see Methods section) can be compared with the values measured in subjects using the inhalation filter (e). Data are presented as box plots, with boxes indicating quartile ranges (25%, 75%), min and max as vertical lines, and median values as solid bars.
TABLE 1.
Measured H2O2 values in chronic obstructive pulmonary disease (COPD) patients (n=12) and healthy control subjects (n=9) under different conditions, as well as relevant ambient air data
| COPD | Controls | |
| Ambient air pressure Torr | 717.1 (4.6) | 716.8 (3.1) |
| Relative atmospheric humidity % | 45.1 (4.4) | 36.2 (4.0) |
| Temperature K | 298.2 (1.5) | 299.2 (1.3) |
| H2O2 in ambient air µM | 2.774 (1.815) | 4.282 (1.473) |
| H2O2 in ambient air/Γ μM | 0.600 (0.343) | 0.864 (0.335) |
| H2O2 in ambient air × (1−F)/Γ μM | 0.114 (0.065) | 0.164 (0.064) |
| H2O2 in EBC while breathing without filter μM | 0.780 (0.510) | 0.748 (0.317) |
| H2O2 in EBC while breathing with filter μM | 0.420 (0.125) | 0.454 (0.222) |
Data are presented as median (interquartile range). EBC: exhaled breath condensate.
The analysis of values within the two groups showed much higher values of ambient H2O2 than exhaled H2O2 without inhalation filter (figure 3a versus c; p<0.001 each). These differences disappeared when the room air values were multiplied with the reconditioning factor Γ (figure 3a versus b; pCOPD=0.403, pcontrol=0.480). In both groups, the levels of exhaled H2O2 with inhalation filter were lower than those without (figure 3e versus c; pCOPD=0.010, pcontrol=0.003). When comparing the values of exhaled H2O2 obtained with inhalation filter with the H2O2 values of room air that had been recalculated using the filtering as well as the reconditioning factor, there were still significant differences (figure 3e versus d; p<0.001 each) suggesting an endogenous contribution to exhaled H2O2.
As there were no statistically significant differences, neither in absolute values nor in changes, between groups, data from both groups were pooled to illustrate the common finding (figure 4).
FIGURE 4.
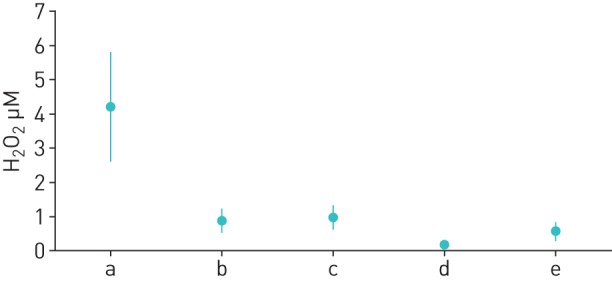
Comparison of exhaled H2O2 values pooled over all study subjects (n=21). a) Raw ambient air concentrations. Calculated exhaled equivalents of ambient air concentration (b; taking account of the conditioning factor Γ; see Methods section) can be compared with the values measured in subjects without inhalation filter (c). Moreover, the calculated exhaled equivalents of ambient air concentration with inhalation filter (d; taking account of the conditioning factor Γ; see Methods section) can be compared with the values measured in subjects using the inhalation filter (e). Data are presented as mean±sd.
Discussion
Our findings indicate that the level of exhaled H2O2 in human subjects significantly depends on its level in inhaled ambient air. This was reflected by the observation that the use of an inhalation filter markedly reduced the levels of exhaled H2O2. At the same time, the difference against the levels to be expected from inhaled H2O2, if these were transformed into equivalent exhaled H2O2 levels, increased. The latter values were derived using a mathematical model that took into account the reconditioning of the inhaled air within the airways by humidification and warming. This reconditioning led to lower values of EBC H2O2, i.e. relative to water vapour, in exhaled compared to ambient air. The measurements of ambient air via the condensate technique were validated by a commercial H2O2 analyser.
Exhaled H2O2 has been assessed in many studies on patients with airway diseases [24] but has been recognised to be difficult to measure [1], and it is not unreasonable to assume a publication bias towards positive associations. Part of the variability could be due to ambient air H2O2 [18] which has rarely been realised by researchers [19]. This would not pose a major problem if the ambient air levels would be much lower than the levels generated via endogenous H2O2 production in the exhaled air. However, the opposite seems true. This becomes obvious if the levels in exhaled air, which are generally given as molar concentrations in a collected fluid, are expressed as partial pressure of gaseous H2O2. This involves the assumption that H2O2 predominantly occurs as vapour in the gas phase which is suggested by the observation that the levels of exhaled H2O2 are flow-dependent [15]. That would be difficult to explain in terms of exhaled aerosols but is quite natural for gaseous H2O2 arising from the airways, in analogy to exhaled nitric oxide (NO) [25].
If one assumes that in the absence of endogenous H2O2 production all of the inhaled H2O2 is exhaled, its concentration in EBC would be lower than in AAC, since water vapour is added within the airways, thereby diluting the H2O2 when measured in solution. This reasoning explains the prima facie surprising fact that in terms of EBC levels the airways appear to be a sink and not a source for H2O2. Moreover, the values of exhaled H2O2 measured in our study were similar to those expected solely from the inhaled ambient air. This would not seem to indicate a measurable endogenous H2O2 production. Assuming that H2O2 is transferred from the mucosa into the lumen by a diffusion process following the concentration gradient, this observation suggests that the mucosal concentration of H2O2 is not much larger than the equivalent arising from ambient air. Indeed, when measured at a very low expiratory flow rate, that was markedly below those achieved in tidal breathing for most of the breathing cycle, H2O2 levels were in the range found in the present study [15]. Under these conditions equilibrium between mucosa and lumen should be approached.
If the fraction of H2O2 in the airway lumen that is due to inhaled H2O2 is reduced by an inhalation filter, the gradient between mucosa and lumen is expected to increase. Accordingly, in our measurements there was a significant difference between the values computed from inhaled H2O2 and the values actually measured. This pointed towards endogenous H2O2 production masked by inhaled H2O2. At the same time, the between-subject variation of the measured values in exhaled air was reduced, again supporting the assumption that part of the well-known variability of H2O2 levels in EBC is due to the variation in inhaled H2O2. When analysing H2O2 values obtained with the inhalation filter, we did not observe a systematic difference between the control group and COPD patients, most of them with mild to moderate disease. This, however, was also true for the values obtained in the conventional manner without filter.
Our findings indicate that exhaled H2O2 levels should not be determined without an inhalation filter removing most of the ambient air H2O2. This suggests a critical re-examination of the bulk of literature on exhaled H2O2 that has been accumulated over the years. Ambient air H2O2 levels are unlikely to be available in the retrospective, but it might be possible to re-analyze data by taking into account ambient air ozone levels which are correlated with H2O2 and much more likely to be available for the site and the time of the measurements.
Footnotes
Support statement: Supported by a grant from Robert Bosch GmbH and performed within the framework of the German Center for Lung Research (DZL), Munich.
Conflict of interest: Disclosures can be found alongside this article at openres.ersjournals.com
References
- 1.van Beurden WJC, Dekhuijzen PNR, Harff GA, et al. Variability of exhaled hydrogen peroxide in stable COPD patients and matched healthy controls. Respiration 2002; 69: 211–216. [DOI] [PubMed] [Google Scholar]
- 2.Horvath I, Donnelly LE, Kiss A, et al. Combined use of exhaled hydrogen peroxide and nitric oxide in monitoring asthma. Am J Respir Crit Care Med 1998; 158: 1042–1046. [DOI] [PubMed] [Google Scholar]
- 3.Emelyanov A, Fedoseev G, Abulimity A, et al. Elevated concentrations of exhaled hydrogen peroxide in asthmatic patients. Chest 2001; 120: 1136–1139. [DOI] [PubMed] [Google Scholar]
- 4.Teng Y, Sun P, Zhang J, et al. Hydrogen peroxide in exhaled breath condensate in patients with asthma: a promising biomarker? Chest 2011; 140: 108–116. [DOI] [PubMed] [Google Scholar]
- 5.Jobsis Q, Raatgeep HC, Hermans PWM, et al. Hydrogen peroxide in exhaled air is increased in stable asthmatic children. Eur Respir J 1997; 10: 519–521. [PubMed] [Google Scholar]
- 6.Effros RM, Su J, Casaburi R, et al. Utility of exhaled breath condensates in chronic obstructive pulmonary disease: a critical review. Curr Opin Pulm Med 2005; 11: 135–139. [DOI] [PubMed] [Google Scholar]
- 7.Dekhuijzen PN, Aben KK, Dekker I, et al. Increased exhalation of hydrogen peroxide in patients with stable and unstable chronic obstructive pulmonary disease. Am J Respir Crit Care Med 1996; 154: 813–816. [DOI] [PubMed] [Google Scholar]
- 8.Lee W, Thomas PS. Oxidative stress in COPD and its measurement through exhaled breath condensate. Clin Transl Sci 2009; 2: 150–155. [DOI] [PMC free article] [PubMed] [Google Scholar]
- 9.Nowak D, Kasielski M, Antczak A, et al. Increased content of thiobarbituric acid-reactive substances and hydrogen peroxide in the expired breath condensate of patients with stable chronic obstructive pulmonary disease: no significant effect of cigarette smoking. Respir Med 1999; 93: 389–396. [DOI] [PubMed] [Google Scholar]
- 10.Montuschi P. Exhaled breath condensate analysis in patients with COPD. Clin Chim Acta 2005; 356: 22–34. [DOI] [PubMed] [Google Scholar]
- 11.Wewel AR, Crusius JA, Gatzemeier U, et al. Time course of exhaled hydrogen peroxide and nitric oxide during chemotherapy. Eur Respir J 2006; 27: 1033–1039. [DOI] [PubMed] [Google Scholar]
- 12.Stolarek RA, Potargowicz E, Seklewska E, et al. Increased H2O2 level in exhaled breath condensate in primary breast cancer patients. J Cancer Res Clin Oncol 2010; 136: 923–930. [DOI] [PMC free article] [PubMed] [Google Scholar]
- 13.Jobsis RQ, Schellekens SL, Fakkel-Kroesbergen A, et al. Hydrogen peroxide in breath condensate during a common cold. Mediators Inflamm 2001; 10: 351–354. [DOI] [PMC free article] [PubMed] [Google Scholar]
- 14.Rahman I, Biswas SK. Non-invasive biomarkers of oxidative stress: reproducibility and methodological issues. Redox Rep 2004; 9: 125–143. [DOI] [PubMed] [Google Scholar]
- 15.Schleiss MB, Holz O, Behnke M, et al. The concentration of hydrogen peroxide in exhaled air depends on expiratory flow rate. Eur Respir J 2000; 16: 1115–1118. [DOI] [PubMed] [Google Scholar]
- 16.Rosias PPR, Dompeling E, Hendriks HJE, et al. Exhaled breath condensate in children: Pearls and pitfalls. Pediatr Allergy Immunol 2004; 15: 4–19. [DOI] [PubMed] [Google Scholar]
- 17.Harrison CM, Andersen CC. Exhaled breath measures of inflammation: are they useful in neonatal chronic lung disease? Arch Dis Child 2005; 90: F6–F10. [DOI] [PMC free article] [PubMed] [Google Scholar]
- 18.Schöne E. Ueber das atmosphärische Wasserstoffhyperoxyd. Berichte der deutschen chemischen Gesellschaft 1874; 7: 1693–1708. [Google Scholar]
- 19.Knobloch H, Becher G, Decker M, et al. Evaluation of H2O2 and pH in exhaled breath condensate samples: methodical and physiological aspects. Biomarkers 2008; 13: 319–341. [DOI] [PubMed] [Google Scholar]
- 20.Acker K, Kezele N, Klasinc L, et al. Atmospheric H2O2 measurement and modeling campaign during summer 2004 in Zagreb, Croatia. Atmos Environ 2008; 42: 2530–2542. [Google Scholar]
- 21.Balasubramanian R, Husain L. Observations of gas-phase hydrogen peroxide at an elevated rural site in New York. J Geophys Res Atmos 1997; 102: 21209–21220. [Google Scholar]
- 22.Lazrus AL, Kok GL, Lind JA, et al. Automated fluorometric method for hydrogen-peroxide in air. Anal Chem 1986; 58: 594–597. [Google Scholar]
- 23.Hyslop PA, Sklar LA. A quantitative fluorimetric assay for the determination of oxidant production by polymorphonuclear leukocytes: its use in the simultaneous fluorimetric assay of cellular activation processes. Anal Biochem 1984; 141: 280–286. [DOI] [PubMed] [Google Scholar]
- 24.Borrill ZL, Roy K, Singh D. Exhaled breath condensate biomarkers in COPD. Eur Respir J 2008; 32: 472–486. [DOI] [PubMed] [Google Scholar]
- 25.Jorres RA. Modelling the production of nitric oxide within the human airways. Eur Respir J 2000; 16: 555–560. [DOI] [PubMed] [Google Scholar]


