

Abstract
Pancreatic ductal adenocarcinoma (PDAC) is an aggressive cancer with low survival rates and limited therapeutic options. Thus elucidation of signaling pathways involved in PDAC pathogenesis is essential for identifying novel potential therapeutic gene targets. Here, we used a systems approach to elucidate those pathways by integrating gene and microRNA profiling analyses together with CRISPR/Cas9 technology to identify novel transcription factors involved in PDAC pathogenesis. FOXA2 transcription factor was found to be significantly downregulated in PDAC relative to control pancreatic tissues. Functional experiments revealed that FOXA2 has a tumor suppressor function through inhibition of pancreatic cancer cell growth, migration, invasion, and colony formation. In situ hybridization analysis revealed miR-199a to be significantly upregulated in pancreatic cancer. Bioinformatics and luciferase analyses showed that miR-199a negatively but directly regulates FOXA2 expression through binding in its 3′-untranslated region (UTR). Evaluation of the functional importance of miR-199a on pancreatic cancer revealed that miR-199a acts as an inhibitor of FOXA2 expression, inducing an increase in pancreatic cancer cell proliferation, migration, and invasion. Additionally, gene ontology and network analyses in PANC-1 cells treated with a small interfering RNA (siRNA) against FOXA2 revealed an enrichment for cell invasion mechanisms through PLAUR and ERK activation. FOXA2 deletion (FOXA2Δ) by using two CRISPR/Cas9 vectors in PANC-1 cells induced tumor growth in vivo resulting in upregulation of PLAUR and ERK pathways in FOXA2Δ xenograft tumors. We have identified FOXA2 as a novel tumor suppressor in pancreatic cancer and it is regulated directly by miR-199a, thereby enhancing our understanding of how microRNAs interplay with the transcription factors to affect pancreatic oncogenesis.
Keywords: FOXA2, miR-199a, CRISPR/Cas9, pancreatic cancer
pancreatic ductal adenocarcinoma (PDAC) accounts for >85% of all cases of pancreatic cancer. For all stages combined, the 1- and 5-yr relative survival rates are 28% and 7%, respectively. More than half of patients (53%) are diagnosed at a late stage, when the 1- and 5-yr survival rates reach 15% and 2%, respectively (44). Recently, there have been significant advances in the development of novel therapeutics based on the rational design of targeted therapies directed at molecular alterations arising in cancer cells (72); however, PDAC remains a lethal disease. Even gemcitabine, the current standard of care chemotherapeutic, produces only a modest increase in survival in patients with PDAC (9). For metastatic disease, the standard of care is a combination four chemotherapeutic drugs known as FOLFIRINOX (folinic acid, fluorouracil, irinotecan hydrochloride, oxaliplatin) (62). These treatments have limited efficacy and significant side effects, often only marginally improving the quality of life of patients (63). Therefore, an urgent need exists to identify novel therapeutic target molecules that a play a key role in pancreatic oncogenesis.
Premalignant lesions, known as pancreatic intraepithelial neoplasms, are of ductal origin (32) and are thought to be precursors of ductal adenocarcinoma because they progress toward increasingly atypical histological stages (40, 51, 55, 68). Multiple combinations of genetic mutations are commonly found in pancreatic adenocarcinomas (64). The KRAS gene, located on chromosome 12p, is one of the most frequently mutated genes in pancreatic cancer. The vast majority of mutations in this gene are at codon 12, leading to activation of the protein product of KRAS (33). KRAS mutations appear to occur very early in pancreatic carcinogenesis, indicating an important role in early initiation of disease (3). In addition to activating mutations, loss-of-function mutations in tumor suppressor genes are also commonly observed in pancreatic carcinomas. Loss of function occurs via inactivation mutations, homozygous deletions, or DNA hypermethylation of the promoter areas of tumor suppressor genes, including p16/CDKN2A, TP53, and SMAD4, which are inactivated in more than 50% of all pancreatic cancers (2, 30, 31, 58). Other pathways involved in PDAC include the Notch signaling pathway (1), the beta-catenin signaling pathway (46), and the phosphoinositide 3-kinase (PI3K)/AKT signaling pathway (7). Although the role of different protein signaling pathways has been examined in pancreatic oncogenesis, the role and function of several transcription factor families has not been extensively evaluated.
Transcription factors affect downstream gene transcription of signal transduction pathways triggered by genetic and epigenetic changes linked to the aggressive nature of cancer (60). For example, the constitutive activation of nuclear factor-κB (NF-κB), which regulates the genes involved in many cellular processes, has also been implicated in the aggressive nature of PDAC (20). Signal transducer and activator of transcription-3 (STAT3) is activated in primary pancreatic cancer and is involved in various physiologic functions, including apoptosis, cell cycle regulation, angiogenesis, and metastasis (12). Negative regulation of STAT3 at the posttranscriptional level leads to attenuation of cell proliferation and invasion of pancreatic carcinoma (69), highlighting the importance of understanding transcriptional regulation in pancreatic oncogenesis. In 2012, Xia et al. (66) identified a transcription factor, Forkhead Box M1 (FOXM1), that is associated with poor prognosis and could be used as a prognostic molecular marker and therapeutic target for pancreatic cancer.
In the present study, we sought to identify key transcriptional regulators that play a functional role in the pathogenesis of pancreatic cancer by performing transcription factor expression profiling followed by functional characterization of selected transcription factors. The aberrant expression of hepatocyte nuclear factor (HNF) family of transcription factors (HNF1, HNF3, HNF4, and HNF6) have been implicated in a variety of solid tumors including lung, colorectal, hepatocellular, and ovarian carcinoma (25, 43, 45, 49, 50, 73). The least studied member of the HNF gene family in cancer is HNF3. The HNF-3 gene family encodes three transcription factors (HNF-3α, HNF-3β, and HNF-3γ) that are important in the regulation of gene expression in normal liver and lung tissue, and were first identified by their ability to bind to important promoter elements in the α1-antitrypsin and transthyretin genes (13). Our molecular and functional analysis revealed that HNF-3β, also known as forkhead box protein A2 (FOXA2), acts as a tumor suppressor gene in pancreatic cancer by affecting pancreatic cancer cell proliferation and invasiveness through regulation of the urokinase plasminogen activator surface receptor (PLAUR) gene. Furthermore, we found that FOXA2 expression is regulated directly by the microRNA miR-199a, whereas inhibition of FOXA2 expression by using the CRISPR/Cas9 (which stands for clustered regularly interspaced short palindromic repeats-CRISPR associated nuclease-9) technology increases tumor growth in pancreatic tumor xenografts. Taken together, the results from our study revealed a novel microRNA-transcription factor signaling pathway involved in the pathogenesis of pancreatic oncogenesis.
MATERIALS AND METHODS
Cell Culture
Human pancreatic cancer cell lines (AsPc-1, BxPC-3, Capan-1, Capan-2, HPAF-II, MIA PaCa-2, and PANC-1) were purchased from American Type Culture Collection (ATCC) (Manassas, VA). Human pancreatic cancer cell line PANC-1 was maintained in DMEM (Gibco) supplemented with 10% FBS, 10 units/ml penicillin, and 100 μg/ml streptomycin. AsPC-1 and BxPC-3 cells were maintained in RPMI-1640 medium (Gibco) supplemented with 10% FBS, 10 units/ml penicillin, and 100 μg/ml streptomycin. Capan-1 cells were maintained in ATCC-formulated Iscove's modified Dulbecco's medium supplemented with 10% FBS, 10 units/ml penicillin, and 100 μg/ml streptomycin. Capan-2 cells were maintained in ATCC-formulated McCoy's 5a Medium Modified supplemented with 10% FBS, 10 units/ml penicillin, and 100 μg/ml streptomycin. HPAF-II cells were maintained in Eagle's Minimum Essential Medium with 10% FBS, 10 units/ml penicillin, and 100 μg/ml streptomycin. MIA PaCa-2 cells were maintained in DMEM medium (Gibco) supplemented with 10% FBS and horse serum to a final concentration of 2.5%, 10 units/ml penicillin, and 100 μg/ml streptomycin.
RNA from PDAC and Control Samples
Human pancreatic tissues were obtained from consenting patients in the Department of Surgery at Stanford University and approved by the Ethics Committee of the Stanford University Medical School. RNA was extracted from eight control (adjacent nontumor) and 14 PDAC tissues using the TRIzol reagent (15596-018; Life Technologies) RNA isolation method and were used for gene profiling. Nineteen control and 17 PDAC tissues were obtained from consenting patients in the Department of Surgery at the University of California, Los Angeles, and approved by the UCLA Ethics Committee and were used to confirm gene expression array data.
Transcription Factor Expression Analysis
To identify transcription factors that were differentially expressed in PDAC, microarray was performed using GeneChip Human Genome U133 Plus 2.0 Arrays. RNA was isolated from 14 PDAC and 8 control tissues. In the list of top differentially expressed genes, FOXA2 was found to be downregulated in PDAC (the cutoff was a twofold change, P < 0.05).
Invasion Assays
We performed invasion assays in PANC-1 and HPAF-II cells at 24 h under different transfection conditions with small interfering RNAs (siRNAs) or microRNAs for 24 h. Invasion of Matrigel was conducted using standardized conditions with BD BioCoat Matrigel invasion chambers (BD Biosciences). Assays were conducted according to the manufacturer's protocol using 10% FBS as the chemoattractant. Noninvading cells on the top side of the membrane were removed, whereas invading cells were fixed and stained with 0.1% crystal violet 16 h postseeding. The cells that invaded through the filter were quantified by counting the entire area of each filter using a grid and an Optech microscope at ×20 magnification. The experiment was repeated three times and the statistical significance was calculated using the Student's t-test.
Migration Assays
PANC-1 and BxPC-3 pancreatic cancer cell lines were used in this assay. The migration assay was performed by starving cells overnight in media containing 0% FBS. The next day, cells were resuspended in media with 0.5% FBS to a concentration of 5 × 10⁵/ml. The upper chamber was loaded with 100 μl of cell suspension and the lower chamber was loaded with 500 μl of medium containing 20% FBS as a chemoattractant. The cells on the bottom of each chamber were fixed with 0.1% glutaraldehyde for 30 min, rinsed briefly with PBS, and stained with 0.2% crystal violet. The number of migrated cells was calculated using ×20 magnification, and the mean for each chamber was determined. The results were calculated as the migration rate compared with the siRNA negative control (or miRNA-NC) cells. Each experimental condition was conducted in triplicate and the experiment was repeated three times.
Colony Formation Assays
PANC-1 cells were transfected with siRNA negative control or siFOXA2#2 for 48 h. Triplicate samples of 105 cells from each cell line were mixed 4:1 (vol/vol) with 2.0% agarose in growth medium to a final concentration of 0.4% agarose. The cell mixture was plated on top of a solidified layer of 0.8% agarose in growth medium. Cells were fed every 6 to 7 days with growth medium containing 0.4% agarose. The number of colonies was counted after 20 days. The experiment was repeated three times and the statistical significance was calculated using the Student's t-test.
In Situ Hybridization
Double-digoxigenin (DIG)-labeled miRCURY LNA probes were used to detect hsa-miR-199a-3p (38481-15; Exiqon, Vedbaek, Denmark) with target sequence ACAGUAGUCUGCACAUUGGUUA. In situ hybridization protocol was used as previously described (34a) with modifications. Formalin-fixed paraffin-embedded sections of control pancreatic and PDAC tissues were deparaffinized with xylene (3 × 5 min) followed by treatment with serial dilutions of ethanol (3 × 100%, 2 × 96%, and 3 × 70%) and by two changes of diethyl pyrocarbonate (DEPC)-PBS. Tissues were then digested with proteinase K (15 μg/ml) for 20 min at 37°C, and rinsed three times with DEPC-PBS. Sections were dehydrated with 3 × 70%, 2 × 96%, and 2 × 100% ethanol, air-dried, and hybridized for 1 h with the hsa-miR-199a probe (40 nM) or the double-DIG-labeled U6 Control Probe (1 nM) (99002-15; Exiqon) diluted in microRNA ISH buffer (90000; Exiqon) at 52°C and 53°C, respectively. Following hybridization, sections were rinsed twice with PBS and 5× saline-sodium citrate (SSC), twice in 1× SSC, and three times in 0.2× SSC for 5 min each at 52°C. The slides were incubated with blocking solution (11585762001; Roche) for 15 min and then with anti-DIG antibody (1:800) in 2% sheep serum (013-000-121; Jackson Immunoresearch) blocking solution for 1 h at room temperature. Following three washes with PBS and 0.1% Tween 20, slides were incubated with the alkaline phosphatase (AP) substrate buffer (NBT-BCIP tablet [11697471001; Roche] in 10 ml of 0.2 mM levamisole [31742; Fluka]) for 2 h at 30°C in the dark. The reaction was stopped with two washes of AP stop solution (50 mM Tris·HCl, 150 mM NaCl, and 10 mM KCl) and two washes with water. Tissues were counterstained with Nuclear Fast Red for 1 min and rinsed with water. Sections were dehydrated with 2 × 70%, 2 × 96%, and 2 × 100% ethanol and mounted with coverslips in Eukitt mounting medium (361894G; VWR). Images were captured with a Nikon 80i Upright Microscope equipped with a Nikon Digital Sight DS-Fi1 color camera using the NIS-Elements image acquisition software. All images were captured and processed using identical settings.
Immunohistochemistry
A pancreas disease spectrum tissue microarray of 103 cases was used (PA2081a; US Biomax) containing 42 cases of PDAC, 3 of pancreatic adenosquamous carcinoma, 1 of pancreatic islet cell carcinoma, 6 of pancreatic metastatic carcinoma, 10 of pancreatic islet cell tumor, 11 if pancreatic inflammation, and 21 if adjacent normal pancreatic tissue, duplicated cores per case. Immunohistochemical (IHC) staining for FOXA2 in control and PDAC cells were deparaffinized with xylene (3 × 5 min) followed by treatment with serial dilutions of ethanol (100%, 100%, 95%, and 95%, 10 min each) and by two changes of double-distilled (dd) H2O. Antigen unmasking was achieved by boiling the slides (95–99°C) for 10 min in 10 mM sodium citrate pH 6.0. Sections were rinsed three times with ddH2O, immersed in 3% H2O2 for 20 min, washed twice with ddH2O and once with TBS-T (TBS and 0.1% Tween 20), and blocked for 1 h with blocking solution (5% normal goat serum [5425] in TBS-T). FOXA2 (sc-6554; Santa Cruz Biotechnology, Santa Cruz, CA) antibody was diluted 1:250 in SignalStain antibody diluent (8112; Cell Signaling Technology) and incubated with the sections overnight at 4°C. Staining for mouse FOXA2 antibody was diluted 1:1,000 in SignalStain antibody diluent (sc-101060; Santa Cruz Biotechnology) and incubated with the sections overnight at 4°C. Following incubation with the antibody, sections were washed three times for 5 min each with TBS-T and incubated for 1 h at room temperature with SignalStain Boost (horseradish peroxidase [HRP, rabbit] 8114; Cell Signaling). Sections were washed three times for 5 min and 22 s each with TBS-T and stained with the diaminobenzidine peroxidase substrate kit (SK-4100; Vector Laboratories, Burlingame, CA) for 30 min, washed, and counterstained with the hematoxylin QS (H-3404; Vector Laboratories). Finally, tissues were dehydrated and mounted in Eukitt medium. Images were captured with a Nikon 80i Upright Microscope equipped with a Nikon Digital Sight DS-Fi1 color camera using the NIS-Elements image acquisition software. All images were captured and processed using identical settings.
Real-Time PCR Analysis
Quantitative real-time RT-PCR was performed to determine the expression levels of FOXA2 in 17 human PDAC tissues and 19 pancreatic control tissues for detection of miR-199a-3p. RNA was isolated using TRIzol according to the manufacturer's instructions (15596-018; Life Technologies). Real-time RT-PCR was assessed on a CFX384 detection system (BioRad, Hercules, CA) using the Exiqon PCR primer sets according to the manufacturer's instructions. MicroRNA expression levels of miR-199a (204536l Exiqon) were normalized to the levels of U6 small nuclear snRNA (203907; Exiqon) and 5S rRNA (203906; Exiqon). Reverse transcription was carried out using the Universal cDNA synthesis kit (203301; Exiqon) and ExiLENT SYBR Green for RT-PCR (203403; Exiqon). Normalized miRNA levels were quantified relative to the levels of a given control tissue. Real-time PCR was employed to determine the expression levels of FOXA2 and PLAUR. Reverse transcription was carried out using the iScript cDNA synthesis kit (1708890; Bio-Rad). Real-time PCR was carried out using iQ SYBR Green Supermix (1708882; Bio-Rad). Gene expression levels were normalized to levels of glyceraldehyde-3-phosphate dehydrogenase (GAPDH) and β-actin. Normalized gene expression levels were quantified to the respective control. The sequences of the primers used were as follows: FOXA2 forward, 5′-ATGCACTCGGCTTCCAGTAT-3′; FOXA2 reverse, 5′-GTTGCTCACGGAGGAGTAGC-3′; PLAUR forward, 5′-GCATTTCCTGTGGCTCATC-3′; PLAUR reverse, 5′-CTTTGGACGCCCTTCTTCA-3′; E-cadherin forward, 5′-GGATTGCAAATTCCTGCCATTC-3′; E-cadherin reverse, 5′-AACGTTGTCCCGGGTGTCA-3′; GAPDH forward, 5′-ATGTTCGTCATGGGTGTGAA-3′; GAPDH reverse, 5′-GGTGCTAAGCAGTTGGTGGT-3′; β-actin forward, 5′-CCCAGCACAATGAAGATCAA-3′; β-actin reverse, 5′-ACATCTGCTGGAAGGTGGAC-3′; IL-6 forward, 5′- CTCTGGGAAATCGTGGAAATGAG -3′; and IL-6 reverse, 5′-CTGTATCTCTCTGAAGGACTCTG-3′.
Luciferase Assay
MIA PaCa-2 cells were transfected with the reporter vectors carrying the 3′-UTR of FOXA2 (S805635; SwitchGear Genomics). The constructs harbored the seed sequence of miR-199a-3p (wild type) or had a mutation of this sequence (miR-199a mutant). At 24 h, the cells were transfected with miR-NC or miR-199a mimic and at 48 h luciferase activity was measured using the Dual Luciferase Reporter Assay System (E1910; Promega, Madison, WI).
Cell Growth Assays
PANC-1 and BxPC-3 pancreatic cancer cell lines were transfected with siFOXA2#2 or miR-199a mimic and their respective control and plated on a 96-well plate (5 × 10² cells/well). Cell growth was assessed using the Cell-Titer Glo Luminescence Cell Viability Assay (G7571; Promega). The xCELLigence RTCA SP system utilizes a 96-well microtiter detection device in which the microelectrode sensor arrays are coated in 96-well microtiter plates and the microtiter plate detection device is connected to the workstation from the inside of the cell incubator. The impedance data from the selected well is exported to the computer and analyzed using RTCA software. A parameter termed cell index is used to quantify cell status on the basis of detected cell-electrode impedance. Cell attachment and proliferation from selected wells of the plate were monitored and recovered every 15 min using the RTCA SP for 120 h. The PANC-1 cells were transfected with miR-NC or miR-199a. Twenty-four hours posttransfection, cells were trypsinized and cells were resuspended at 5 × 10³ cells/100 μl, and 5 × 10³ cells were seeded into each well of the E-plate 96 in quadruplicates.
Mouse Experiments
PANC-1 control or PANC-1 FOXA2Δ cells (5 × 10⁶) were injected subcutaneously in the right flank of NOD/SCID mice (n = 10 mice/group). Tumor growth was monitored every 7 days for a total period of 64 days. Tumor volumes were calculated by the equation V (mm3) = a × b2/2, where a is the largest diameter and b is the perpendicular diameter. In addition, paraffin-embedded tissue sections from pancreatic tissues from male 3-mo-old and 9-mo-old male KrasG12D+/−p48-Cre+/− (KC) mice were provided by Dr. Guido Eibl's laboratory (15). All the mouse studies were approved by the University of California Institutional Animal Care and Use Committee and conformed to the U.S. National Institutes of Health Guide for the Care and Use of Laboratory Animals.
Western Blot Analysis
Protein samples were subjected to SDS-PAGE and transferred to polyvinylidene difluoride membranes in 25 mM Tris, 192 mM glycine. Membranes were blocked with 5% nonfat dry milk in PBS and 0.05% Tween 20 and probed with antibodies (1:1,000) followed by corresponding HRP-labeled secondary antibodies (1:1,000). Blots were developed with enhanced chemiluminescence (ECL) reagent (T) and exposed in Eastman Kodak 440 Image Station.
Antibodies and Reagents
Antibodies.
Two different antibodies against FOXA2 were used. One was used for Western blotting experiments (8189; Cell Signaling) and the other (sc-6554; Santa Cruz Biotechnology) for IHC analysis. PLAUR antibody was used for Western blotting experiments (9692; Cell Signaling). Additionally, phospho-p44/42 MAPK (Erk1/2) (Thr202/Tyr204) was used for Western blotting in PANC-1 and HPAF-II cell lines (4370; Cell Signaling) along with total ERK antibody (4695; Cell Signaling), total AKT (4691S; Cell Signaling), phospho-AKT T308 (13038S; Cell Signaling), and phosphor-AKT S473 (4060S; Cell Signaling). Additionally, CREB and GAPDH antibodies were used as loading controls (9104 and 5174, respectively; both from Cell Signaling).
Small interfering RNAs.
The following siRNAs were used in this study: siRNA negative control (siNC#2, 4390847; Life Technologies) and two different siRNAs against FOXA2 (siFOXA2#1, s6691; and siFOXA2#2, s6692; both from Life Technologies). A single siRNA against PLAUR was siPLAUR used in this study (s10614; Life Technologies).
FOXA2 overexpression vector.
MiaPaCa-2 cells were transfected with vector plasmids as controls (PS100001; OriGene) or plasmids for overexpression of FOXA2 (RC211408; OriGene) according to the manufacturer's protocol.
MicroRNAs.
The following microRNAs were used in this study: miRVana miRNA mimic, negative control #1 (miRNC, 4464059; Life Technologies) and miR-199a miRVana miRNA mimic (4464066 miRVana miRNA mimic; Life Technologies).
3′-UTR FOXA2 vector.
We used pLightSwitch_3UTR for FOXA (S805635; SwitchGear Genomics) containing the miR-199a-3p predicted binding site.
CRISPR/Cas9 system.
The FOXA2 human gene knockout kit via CRISPR was ordered from OriGene (KN204066). Clones were selected using 2 μg/ml puromycin.
Statistical Analysis
All experiments were performed in triplicate unless otherwise stated. Statistical analyses were performed with the use of Origin software version 8.6. A Student's t-test was used to examine the statistical difference in FOXA2 and miR-199a expression between control and PDAC tissues. The correlation significance was determined by means of Spearman and Pearson correlation analyses. A value of P < 0.05 was considered statistically significant (*P < 0.05, **P < 0.01, ***P < 0.001).
Ingenuity Network Software
A gene network was constructed and important hubs were identified using Ingenuity Pathway Analysis (IPA; Ingenuity Systems, Mountain View, CA) based on the differentially expressed genes identified after inhibition of FOXA2 expression by siRNA FOXA2#2 in PANC-1 pancreatic cancer cell line. IPA is a robust and expertly curated database containing updated information on more than 20,000 mammalian genes and proteins, 1.4 million biological interactions, and 100 canonical pathways incorporating more than 6,000 discreet gene concepts. This information is integrated with relevant databases such as Entrez-Gene and Gene Ontology. The experimental data sets were used to query the IPA and to compose a set of interactive networks taking into consideration canonical pathways, the relevant biological interactions, and the cellular and disease processes. Pathways of highly interconnected genes were identified by statistical likelihood using the following equation:
where N is the number of genes in the network of which G are central node genes, for a pathway of s genes, of which f are central node genes. C(n,k) is the binomial coefficient. We considered statistically significant networks those with a score greater than 5 (P < 10−5).
RESULTS
FOXA2 transcription factor is downregulated in human pancreatic cancers.
To evaluate the role of the human transcriptome in pancreatic oncogenesis, we first examined expression levels of all the known transcription factors by performing gene profiling analysis in 8 pancreatic control and 14 PDAC tissues. This analysis revealed 43 transcription factors that were deregulated (greater than 1.5-fold) in PDAC relative to control tissues (Fig. 1A, Table 1). Interestingly, among the top differentially expressed transcription factors were FOXA2 (HNF-3β), HNF-1β, and HNF-6, three members of the HNF family of transcription factors (Fig. 1B). Although the HNF family members are known to be involved in liver oncogenesis (25), their role in pancreatic oncogenesis has not been evaluated. The profiling analysis showed FOXA2 mRNA to be highly downregulated in PDAC relative to control tissues, suggesting a potential tumor suppressor role in PDAC. To further validate the gene expression findings, we performed quantitative real-time PCR to examine FOXA2 mRNA expression levels in 14 control and 14 PDAC tissues in a second cohort of patients with pancreatic cancer. Consistent with our initial findings, FOXA2 mRNA levels were significantly downregulated in PDAC tissues (Fig. 1C). In addition, we performed IHC analysis for FOXA2 in 63 human tissue sections, including 42 PDAC and 21 control pancreatic tissues and found that 31 of 42 (74%) PDAC tumors had no expression of FOXA2, whereas FOXA2 was expressed in all of the control tissues (Fig. 1D), further suggesting a potential tumor suppressor role for FOXA2 in PDAC. To investigate the role of FOXA2 expression in pancreatic oncogenesis, we performed IHC analysis for FOXA2 in 3-mo-old and 9-mo-old KC mice. Consistent with the human data, expression of FOXA2 was decreased in the 9-mo-old mice compared with the 3-mo-old mice (Fig. 1E), suggesting that FOXA2 expression is decreased during pancreatic oncogenesis. Overall, all these data show that FOXA2 mRNA and protein levels are decreased in PDAC.
Fig. 1.

FOXA2 transcription factor is downregulated in human pancreatic cancers. A: pancreatic cancer transcription factor transcriptome. Heat map showing unsupervised clustering of expression Z-scores of mRNA expression of 105 probes from 43 transcription factor genes in 22 human pancreatic tissue (control = 7, cancer = 15). B: expression levels of hepatocyte nuclear factor family transcription factors (FOXA2, HNF-1β, and HNF-6) from the list of 43 transcription factors differentially expressed in pancreatic ductal adenocarcinoma (PDAC). C: FOXA2 mRNA levels by real-time PCR in 28 human pancreatic tissue (control = 14, cancer = 14). D: immunohistochemical (IHC) staining for human FOXA2 in control (top) and PDAC tissue (bottom). E: IHC staining for mouse FOXA2 in 3-mo-old (top) and 9-mo-old KrasG12D+/−p48-Cre+/− (KC) (bottom) mice. Experiments were performed in triplicate and all values are presented as means ± SD. ***P < 0.001, **P < 0.01, *P < 0.05.
Table 1.
Differentially expressed TFs in PDAC vs. control tissues
| Transcription Factor Name | Fold Change, PDAC vs. Control |
|---|---|
| ARNTL2 | 1.830414193 |
| AHR | 1.770715552 |
| BHLHE40 | 1.620227569 |
| CSDC2 | −1.746860866 |
| ELF4 | 2.026515581 |
| ESRRG | −2.499329116 |
| FOXA2 | −1.556944005 |
| FOXF2 | 1.777107854 |
| FOXL1 | 1.861434191 |
| FOXP2 | −1.520345843 |
| GATA4 | −1.824959917 |
| GLIS3 | −1.563211851 |
| HHEX | −1.648626826 |
| HMGA2 | 1.806947596 |
| HNF1B | 1.627896229 |
| HOXA3 | 1.751809197 |
| HOXB2 | 1.593110965 |
| HOXB6 | 1.549874116 |
| HOXB7 | 2.557724696 |
| HOXC9 | 1.683238922 |
| ID1 | 1.653506642 |
| KLF15 | −2.700062809 |
| KLF4 | 1.524845007 |
| KLF5 | 1.728963085 |
| KLF7 | 1.564062549 |
| LEF1 | 1.913189882 |
| MAF | 1.58038649 |
| MXD1 | 1.633748967 |
| NR5A2 | −3.26744002 |
| ONECUT1 | −2.764584396 |
| PDX1 | −1.60514131 |
| PPARG | 1.802035985 |
| PRDM1 | 1.995993975 |
| PRDM16 | −1.858238085 |
| PRDM5 | −1.554285542 |
| PRRX1 | 1.57618735 |
| PROX1 | −2.480756568 |
| SOX6 | −1.615514705 |
| TFAP2A | 2.652273186 |
| TWIST1 | 1.921317868 |
| VDR | 1.755868703 |
| ZBTB16 | −1.687271795 |
PDAC, pancreatic ductal adenocarcinoma; TF, transcription factor.
FOXA2 has tumor suppressor properties in PDAC.
To study the functional role of FOXA2 in pancreatic cancer, we screened a panel of seven (PANC-1, BxPC-3, HPAF-II, Capan-1, Capan-2, AsPC-1, and MiaPaCa-2) different human pancreatic cancer cell lines for FOXA2 expression. Out of the seven cell lines investigated, PANC-1, BxPC-3, and HPAF-II expressed FOXA2 mRNA and were selected for further molecular studies by manipulating FOXA2 expression levels. We silenced FOXA2 expression by using two different siRNAs (PANC-1 and BxPC-3) in two pancreatic cancer cell lines that exhibited increased FOXA2 levels. Cell growth analysis was studied and comparisons were performed relative to the cells transfected with an siRNA negative control (Fig. 2A). Although siRNA#2 had a higher knockdown efficiency than siRNA#1 against FOXA2 (data not shown), when cells were transfected with either siRNA#1 or siRNA#2, a statistically significant increase in cell growth was observed in both PANC-1 and BxPC-3 cell lines 48 h after transfection (Fig. 2A). Because of the higher knockdown efficiency, siRNA#2 was used in the follow-up experiments to manipulate FOXA2 levels in vitro. Specifically, FOXA2 inhibition by siRNA#2 significantly increased the ability of PANC-1 cells to form colonies in soft agar (Fig. 2B). To further explore the functional role of FOXA2 in pancreatic cancer cell properties, we performed cell migration and invasion assays in PANC-1 (Fig. 2, C and D) and BxPC-3 cells (Fig. 2, E and F). A statistically significant higher number of migrating and invading cells were observed upon FOXA2 knockdown, suggesting that inhibition of FOXA2 promotes pancreatic oncogenesis. To explore the role of FOXA2 overexpression on invasion, FOXA2 was overexpressed in MiaPaCa-2 cells, a human pancreatic cancer cell line that does not express basal levels of FOXA2. There was a statistically significant difference in invasion upon FOXA2 overexpression, with a significant decrease in invasion upon FOXA2 overexpression compared with control tissues (Fig. 2G).
Fig. 2.
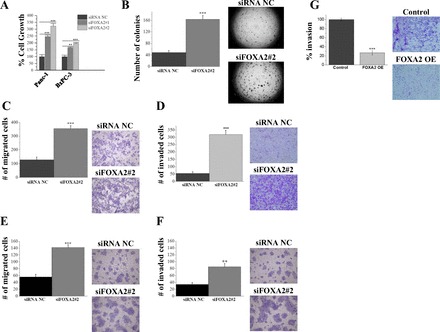
FOXA2 has tumor-suppressor gene properties in PDAC. A: relative percent of cell growth measured in PANC-1 and BxPC-3 cells treated for 48 h with small interfering RNA negative control (siRNA NC) or two different siRNAs against FOXA2 (siFOXA2#1 and siFOXA2#2) using the Cell-Titer Glo Luminescence Cell Viability Assay. B: soft agar colony formation assay of PANC-1 cells treated for 48 h with siRNA NC or siFOXA2#2. Colonies (mean ± SD) 50 mm in size were counted using a microscope 20 days later. C: transwell cell migration assay in PANC-1 cells transfected with siRNA NC or siFOXA2#2, migrating across 8-mm micropore membranes. D: invasion through Matrigel-coated transwell inserts in PANC-1 cells transfected with siRNA NC or siFOXA2#2. E: transwell cell migration assay in BxPC-3 cells transfected with siRNA-NC or siFOXA2#2, migrating across 8-mm micropore membranes. F: invasion through Matrigel-coated transwell inserts in BxPC-3 cells transfected with siRNA NC or siFOXA2#2. G: invasion through Matrigel-coated transwell inserts in MiaPaCa-2 cells transfected with control vector (control) or FOXA2 overexpression vector (FOXA2 OE). Experiments were performed in triplicate and all values are presented as means ± SD. ***P < 0.001, **P < 0.01, *P < 0.05.
MiR-199a negatively regulates FOXA2 expression through binding in its 3′-UTR.
We were interested in identifying the molecular mechanism involved in the suppression of FOXA2 expression in pancreatic cancer. Initial DNA methylation analysis (Infinium HumanMethylation450 BeadChip assay) on 20 PDAC human tissues and 15 cancer-adjacent normal tissues revealed that the FOXA2 promoter region was not differentially methylated in PDAC (data not shown), suggesting that DNA methylation is not the molecular mechanism responsible for FOXA2 reduced expression in pancreatic cancer. According to our previous studies, microRNAs have been found to be essential regulators of transcription factors involved in oncogenesis (34). Bioinformatics analysis by using the TargetScan algorithm revealed that miR-199a-3p has sequence complementarity in the position of 275-81 nt of the 3′-UTR of FOXA2 (Fig. 3A). To examine the direct interaction between miR-199a and FOXA2, we performed a 3′-UTR luciferase assay. MiR-199a was overexpressed in Mia PaCa-2 cells that were cotransfected with a construct harboring the 3′-UTR of FOXA2 under luciferase activity. We found that miR-199a overexpression reduced FOXA2 3′-UTR luciferase activity compared with control and point mutation of the miR-199a binding site in the 3′-UTR FOXA2 luciferase vector abolished the suppressive effects of miR-199a (Fig. 3B). To further validate the interaction between miR-199a and FOXA2 in vitro, miR-199a was overexpressed in PANC-1 cells. We examined FOXA2 mRNA and protein levels and found that FOXA2 levels were significantly decreased in miR-199a-overexpressing pancreatic cancer cells (Fig. 3, C and D). Taken together, these findings suggest that miR-199a is a direct regulator of FOXA2 expression in pancreatic cancer.
Fig. 3.

FOXA2 as a direct target of miR-199a-3p in PDAC. A: sequence complimentarity between miR-199a-3p seed sequence and the 3′-untranslated region (UTR) of FOXA2. B: FOXA2 3′-UTR luciferase activity in MIA PaCa-2 cells transfected with miR-NC or miR-199a, 48 h after transfection. MiR-199a sequence was wild-type (miR 199) or mutated (miR mutant). C: FOXA2 relative mRNA levels in the PANC-1 cell line 24 h after transfection with miR-199a mimic. D: Western blot showing FOXA2 protein levels in the PANC-1 cell line 72 h after transfection with miR-199a mimic. Experiments were performed in triplicate and all values are presented as means ± SD. ***P < 0.001, **P < 0.01, *P < 0.05.
MiR-199a has an oncogenic function in PDAC.
Next, we were interested in investigating the relevance of miR-199a in human pancreatic cancer. We performed real-time PCR analysis in 19 control and 17 PDAC tissues and found a statistically significant upregulation of miR-199a expression in PDAC compared with control tissues (Fig. 4A). To examine the upregulation of miR-199a in histological tissues, we performed in situ hybridization on a tissue microarray containing 25 cases of pancreas adenocarcinoma with matched cancer-adjacent tissue. In situ hybridization revealed 17 of 25 (68%) adenocarcinomas highly expressed miR-199a (Fig. 4B, bottom), but it was not expressed in control tissues (Fig. 4B, top). To explore the functional role of miR-199a in pancreatic oncogenesis we used the xCELLigence technology to monitor cell growth over a period of 120 h, with a measurement taken every 15 min. This assay showed that miR-199a significantly increases the growth of PANC-1 cells (Fig. 4C). Cell growth was also performed with the same experimental samples using the CellTiter-Glo Luminescent Cell Viability assay. MiR-199a overexpression led to a 50% increase in PANC-1 cell growth compared with cells transfected with a microRNA negative control (Fig. 4C). To further assess the functional effects of miR-199a overexpression in pancreatic cancer, we performed migration and invasion assays in PANC-1 cells and found a statistically higher number of migrating and invading cells in the miR-199a-overexpressing PANC-1 cells relative to cells transfected with the microRNA negative control (Fig. 4, D and E).
Fig. 4.
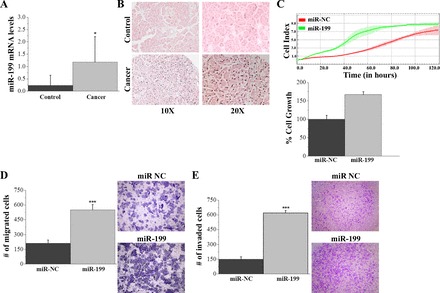
MiR-199a has an oncogenic function in PDAC. A: MiR-199a mRNA levels in human pancreatic control (n = 19) and cancer tissue (n = 17). B: in situ hybridization miR-199 in human pancreatic control and cancer tissue under ×1 and ×2 magnification. C: cell proliferation in PAC-1 cells 24 h after transfection with miRNA negative control (miR-NC) or miR-199a mimic (miR-199) using the xCELLigence system. PANC-1 cells were seeded at a density of 5 × 10³ cells/well in 96-well E-plates and monitored for 120 h. D: percentage of cell growth measured in BxPC-3 cells treated with miR-NC or miR-199a for 24 h, then plated and measured 48 h later using the Cell-Titer Glo Luminescence Cell Viability Assay. E: transwell cell migration assay in PANC-1 cells transfected with miR-NC or miR-199. F: invasion through Matrigel-coated transwell inserts in PANC-1 cells transfected with miR-NC or miR-199. Experiments were performed in triplicate and all values are presented as means ± SD. ***P < 0.001, **P < 0.01, *P < 0.05.
FOXA2-regulated gene network in PDAC.
Our data revealed that FOXA2 has tumor suppressor properties in PDAC and its expression is regulated by miR-199a. To evaluate the molecular mechanisms that are regulated by FOXA2 suppression in PDAC and identify its downstream gene targets, we transiently knocked down FOXA2 using siFOXA2#2 in PANC-1 cells and its corresponding negative control, demonstrating an 80% inhibition of FOXA2 mRNA expression levels (Fig. 5A). Next, we performed gene profiling analysis and found that 372 genes were upregulated, whereas 552 were downregulated (924 genes in total) in siFOXA2#2 PANC-1 cells relative to siRNA negative control by using a cutoff of P < 0.05 and a fold change of 2 (Fig. 5B). IPA software was employed to perform signaling pathway analysis. The results revealed statistically significant enrichment for the cell movement/invasion pathway, cell proliferation, PI3K/AKT, and MAPK signaling pathways (Fig. 5C). To further evaluate these findings we performed gene network analysis by using the 924 differentially expressed genes in the IPA software network analysis and found that the most significant (P = 10−42) gene network was involved in cellular invasion having PLAUR, ERK, and PI3K as central nodes, consistent with our pathway analysis (Fig. 5D). Consistent with IPA network analysis data, inhibition of FOXA2 in HPAF-II cells leads to activation of ERK, demonstrated by ERK phosphorylation (Fig. 5E), suggesting that FOXA2 suppression directly or indirectly leads to ERK activation. Interestingly, PLAUR is a gene known to be related to cancer cell invasiveness and motility (14, 29, 67). To further validate the gene network findings, we examined PLAUR expression levels by real-time PCR after FOXA2 inhibition by siRNA#2. Consistent with our initial findings, FOXA2 inhibition resulted in a significant increase in PLAUR mRNA levels in PANC-1 cells (Fig. 5F). To examine whether PLAUR mediates FOXA2 effects on pancreatic cancer cell invasiveness, we performed an invasion assay knocking down either FOXA2 or both FOXA2 and PLAUR by siRNAs in HPAF-II cells, a pancreatic cell line that expresses basal levels of both FOXA2 and PLAUR. We observed a significant increase in invasion by knockdown of FOXA2, and this increase in invasion was completely reversed when cells were transfected with both an siRNA against FOXA2 and an siRNA against PLAUR (Fig. 5G), suggesting that PLAUR is a major mediator of FOXA2 effects on pancreatic cell invasiveness. Taken together, these data suggest that FOXA2 regulates pancreatic cell invasiveness through regulation of PLAUR expression levels.
Fig. 5.

FOXA2-regulated gene network in PDAC. A: relative FOXA2 mRNA levels in PANC-1 cells transfected with siRNA NC or siFOXA2#2 for gene profiling studies, duplicate experimental samples were performed. B: heat map indicating expression levels of 372 genes upregulated and 552 genes downregulated in siRNA NC compared with siFOXA2#2 samples in the PANC-1 cell line. C: Ingenuity Pathway Analysis (IPA) reveals statistically significant enrichment for the cell movement/invasion pathway, cell proliferation, PI3K/AKT, and MAPK signaling pathways. D: gene network analysis by using the 924 differentially expressed genes in the IPA software network found the most significant (P = 10−42) gene network was involved in cellular invasion having as central nodes PLAUR, ERK, and PI3K, consistent with our gene ontology analysis. E: Western blot indicating phosphorylation of ERK, total ERK, and CREB in PANC-1 cells treated with siRNA NC or siFOXA2#2. F: PLAUR mRNA levels in HPAF-II cells treated with siRNA NC or siFOXA2#2. G: invasion through Matrigel-coated transwell inserts in HPAF-II cells transfected with siRNA NC, siFOXA2#2, or both siFOXA2#2 and siPLAUR. H: relative mRNA levels of IL-6 assessed by real-time PCR in BxPC-3 cells transfected with siRNA NC or siFOXA2#2. Experiments were performed in triplicate and all values are presented as means ± SD. ***P < 0.001, **P < 0.01, *P < 0.05.
Furthermore, it is known that microRNAs have multiple downstream gene targets, and recent studies have shown that the NF-κB pathway, which is affected by miR-199a, cross-talks with the FOXA2 signaling pathway (49). To shed some light on the potential cross-talk between FOXA2 and other common oncogenic pathways such as NF-κB, we examined the expression of IL-6, a downstream target of NF-κB, upon transient inhibition of FOXA2 in the BxPC-3 cell line. Upon knockdown of FOXA2 with siRNA#2, there is a significant increase in IL-6 levels (Fig. 5H), indicating activation of the NF-κB pathway.
Generating a FOXA2Δ pancreatic cell line using the CRISPR/Cas9 system.
We observed the effects of FOXA2 inhibition of expression in vitro through a series of functional and gene expression assays. To study the effects of FOXA2 deletion in vivo, we developed a cell line with a permanent knockout of FOXA2 at the chromosomal level (FOXA2Δ). We used the CRISPR/Cas9 system in which we cotransfected PANC-1 cells with two FOXA2 gRNA vectors containing two different target sequences (Fig. 6A) and the corresponding donor control vector. After clonal selection in puromycin, we validated FOXA2Δ at the protein level (Fig. 6B) and also found a significant increase in PLAUR mRNA levels in FOXA2Δ compared with control tissues (Fig. 6C), consistent with our siRNA experimental setting. Next, we examined the phosphorylation levels of ERK and AKT by Western blot analysis and found both kinases to be activated in FOXA2Δ compared with controls, consistent with our gene network analysis (Fig. 6, D and E). Conclusively, these data demonstrate the high efficiency of the CRISPR/Cas9 system and its consistency with the siRNA system, providing us with a powerful tool for studying the role of FOXA2 in vivo.
Fig. 6.

Generating a FOXA2Δ pancreatic cell line using the CRISPR/Cas9 system. A: sequences of FOXA2 gRNA vectors. PANC-1 cells were transfected with either 1) two gRNA vectors and donor vector (donor vector not shown) referred to as FOXA2Δ or 2) a scramble vector and a donor vector (scramble vector and donor vector not shown) referred to as PANC-1 control. B: Western blot for PANC-1 control and FOXA2Δ-generated cell lines. C: PLAUR mRNA expression levels in PANC-1 control and FOXA2Δ cell lines. D: Western blot indicating phosphorylation of ERK and total ERK plus loading control in PANC-1 control and FOXA2Δ cell lines. E: Western blot indicating phosphorylation of AKT at two phosphorylation sites (Ser473 and Thr308) and total AKT plus loading control in PANC-1 control and FOXA2Δ cell lines. Experiments were performed in triplicate and all values are presented as means ± SD. ***P < 0.001, **P < 0.01, *P < 0.05.
CRISPR/Cas9 FOXA2 inhibition increases pancreatic tumor growth in vivo.
To further support the role of FOXA2 as a tumor suppressor gene in pancreatic cancer, we wanted to test its properties in vivo. We subcutaneously injected NOD/SCID mice with either FOXA2Δ PANC-1 (5 × 10⁵ cells) or its corresponding PANC-1 control cell line (n = 10/group). On day 64, mice were killed and tumors were isolated. The FOXA2Δ tumor volumes (mm3) and weight (g) were significantly larger than the PANC-1 control tumors (Fig. 7, A, B, and C). On day 64, RNA was isolated from each tumor and quantitative real-time PCR showed that FOXA2 was not expressed in the FOXA2Δ tumors relative to controls (Fig. 7D). Furthermore, in accordance with our in vitro findings, FOXA2Δ tumors showed increased PLAUR mRNA levels (Fig. 7E). Moreover, E-cadherin levels decreased in FOXA2Δ tumors, indicating that FOXA2 may also regulate cellular motility (Fig. 7F). Taken together, the in vivo data suggest that inhibition of FOXA2 increases the pancreatic tumorigenicity and aggressiveness.
Fig. 7.

CRISPR/Cas9 FOXA2 inhibition suppresses pancreatic tumor growth in vivo. A: at day 64, tumor volumes (mm3) were measured in PANC-1 control and FOXA2Δ (n = 10/group) tumors. B: at day 64, tumors were excised and tumor weight (g) was measured in PANC-1 control and FOXA2Δ tumors. C: at day 64, PANC-1 control and FOXA2 tumors were excised and photographed (pictured with ruler in mm). D: at day 64, RNA was isolated from tumors and FOXA2 mRNA levels were examined in PANC-1 control and FOXA2Δ tumors. E: PLAUR mRNA levels were examined in PANC-1 control and FOXA2Δ tumors. F: relative E-cadherin mRNA levels in PANC-1 control and FOXA2Δ tumors (n = 10/group). Experiments were performed in triplicate and all values are presented as means ± SD. ***P < 0.001, **P < 0.01, *P < 0.05.
DISCUSSION
Our study revealed FOXA2 to be a novel tumor suppressor gene in pancreatic cancer. FOXA2 is a 455-amino acid member of the forkhead class of DNA-binding proteins and contains a highly conserved winged-helix DNA-binding domain (56). FOXA2 is a transcription factor that was initially identified in hepatocytes, where it binds in the promoter areas of important liver-enriched genes transthyretin, alpha 1-antitrypsin, and albumin (13, 19, 28). It is required for the formation of the node, notochord, nervous system, and endoderm-derived structures (19, 36). In adulthood, FOXA2 has been shown to control metabolic homeostasis and to contribute to insulin resistance (65).
In the last decade, several studies have implicated FOXA2 in solid tumors. FOXA2 has been found to be expressed in all types of neuroendocrine lung tumors (37) and shown to be a key regulator in colorectal liver metastases (43). We found that FOXA2 inhibition induces cancer cell invasiveness, consistent with its function in other cancers. Specifically, in human lung cancer cells, upon transforming growth factor-β1 treatment, FOXA2 levels are decreased, leading to activation of Slug transcription, thus inducing epithelial-mesenchymal transition and promoting invasion (61). More recently, Liu et al. (49) demonstrated FOXA2 phosphorylation by TNFα-induced I kappa B kinase-α (IKKα), which stimulates the NOTCH1 pathway to promote liver cell proliferation and growth, indicating that FOXA2 suppression by phosphorylation plays an important role in TNFα-mediated tumorigenesis (49).
Although dysregulation of FOXA2 has been directly linked to the progression of certain cancers, this class of transcription factors can paradoxically serve as both tumor suppressors and oncogenes (41). Very little is known about the roles of FOXA2 in invasion and tumor metastasis in pancreatic cancer. Our study identifies the transcription factors differentially expressed in PDAC and shows that FOXA2 and other HNFs are significantly downregulated in human PDAC. Knockdown of FOXA2 led to a significant increase in cellular growth, migration, invasion, and colony formation, indicating that FOXA2 harbors tumor suppressive properties.
Recent advances in pancreatic cancer biology have resulted in important roles being identified for microRNAs in regulating tumor responses. MicroRNAs, a class of noncoding RNAs, have emerged as critical players in cancer initiation and progression by modulating many pathological aspects related to tumor development, growth, metastasis, and drug resistance (48). Studies have found that miRNAs control many cellular processes through involvement in development, proliferation, the stress response, apoptosis, cell cycle progression, and differentiation (4, 5a, 6, 16, 47). The major function of miRNAs is to posttranscriptionally regulate gene expression depending on recognition of complementary sequence residing in target mRNAs. Several key oncogenic miRNAs have been identified in pancreatic cancer, including miR-483-3p, miR-155, miR-21/miR-221, miR-27a, miR-371-5p, and miR-21/miR-23a/miR-27a. Inhibition of oncogenic miRNAs reduces functional properties of pancreatic oncogenesis (18, 23, 24, 26, 52, 57). Our data indicate that miR-199a-3p plays an oncogenic role, with a significant increase in expression in PDAC compared with control. In the last decade, investigations have revealed that the expression of miR-199a is altered in several human cancers (22, 42, 70). Specifically, expression of miRNA-199 is increased in ovarian cancer cells and cervical carcinomas (22, 70) in accordance to our data in PDAC. Specifically, overexpression of miR-199a in pancreatic cancer cells led to an increase in pancreatic cell growth, migration, and invasion in vitro, demonstrating miR-199a oncogenic properties in pancreatic cancer.
We found that miR-199a-3p directly regulates FOXA2 mRNA and protein expression through binding in its 3′-UTR. Furthermore, recent studies have identified additional downstream targets of miR-199a in other cancer types. For example, miR-199a targets Frizzled type 7 receptor (FZD7), one of the most important Wnt receptors involved in cancer development and progression (59). Additionally, mTOR, c-MET, IKKβ, MET proto-oncogene, and CD44 have also been identified as direct targets of miR-199a, playing a major role in cancer initiation and progression in different types of cancer (10, 17, 21, 27, 39).
Conventionally, loss-of-function genetic screens in cultured cells is conducted primarily with the aid of RNA interference (RNAi) libraries (8, 71). However, RNAi could only partially and temporary suppress gene expression, and thus its application is limited to knockdown screens (8, 54). Moreover, because of the endogenous nature of the RNAi pathway, it often incurs pervasive off-target events because of the extensive endogenous interactions. These off-target effects may confound the interpretation of screen results (35). Recently, the emergence of the CRISPR/Cas9 technique offers a novel and versatile platform for genetic screen studies (5, 11, 53). For these reasons, we chose the highly efficient CRISPR/Cas9 deletion system to permanently knock out FOXA2 in a pancreatic cancer cell line to study its effects in vivo. In addition, inhibition of FOXA2 expression levels by CRISPR/Cas9 in vitro led to activation of the PLAUR gene, which is known to be involved in cancer invasiveness (38). Importantly, these findings were consistent with our data showing that FOXA2 expression was suppressed by siRNA, suggesting that the CRISPR/Cas9 system is very effective in blocking gene expression in cancer cells. Taken together, our study has revealed a novel signaling pathway, consisting of the miR-199a and FOXA2 tumor suppressor gene, involved in pancreatic oncogenesis.
GRANTS
This study was supported by startup funds and a Pancreatic Cancer Network-AACR (PanCan-AACR) grant to D. Iliopoulos.
DISCLOSURES
No conflicts of interest, financial or otherwise, are declared by the authors.
AUTHOR CONTRIBUTIONS
C.V., M.H., and D.I. conception and design of research; C.V., M.H., M.K., J.W., T.R.D., G.A.P., and G.E. performed experiments; C.V., M.H., and S.M.-J. analyzed data; C.V., M.H., and S.M.-J. interpreted results of experiments; C.V. prepared figures; C.V. drafted manuscript; C.V., M.H., S.M.-J., M.K., J.W., T.R.D., G.A.P., and D.I. edited and revised manuscript; C.V., M.H., S.M.-J., M.K., J.W., T.R.D., G.A.P., G.E., and D.I. approved final version of manuscript.
REFERENCES
- 1.Abel EV, Kim EJ, Wu J, Hynes M, Bednar F, Proctor E, Wang L, Dziubinski ML, Simeone DM. The Notch pathway is important in maintaining the cancer stem cell population in pancreatic cancer. PLoS One 9: e91983, 2014. [DOI] [PMC free article] [PubMed] [Google Scholar]
- 2.Aguirre AJ, Bardeesy N, Sinha M, Lopez L, Tuveson DA, Horner J, Redston MS, DePinho RA. Activated Kras and Ink4a/Arf deficiency cooperate to produce metastatic pancreatic ductal adenocarcinoma. Genes Dev 17: 3112–3126, 2003. [DOI] [PMC free article] [PubMed] [Google Scholar]
- 3.Almoguera C, Shibata D, Forrester K, Martin J, Arnheim N, Perucho M. Most human carcinomas of the exocrine pancreas contain mutant c-K-ras genes. Cell 53: 549–554, 1988. [DOI] [PubMed] [Google Scholar]
- 4.Ambros V. The functions of animal microRNAs. Nature 431: 350–355, 2004. [DOI] [PubMed] [Google Scholar]
- 5.Barrangou R, Fremaux C, Deveau H, Richards M, Boyaval P, Moineau S, Romero DA, Horvath P. CRISPR provides acquired resistance against viruses in prokaryotes. Science 315: 1709–1712, 2007. [DOI] [PubMed] [Google Scholar]
- 5a.Bartel DP. MicroRNAs: genomics, biogenesis, mechanism, and function. Cell 116: 281–297, 2004. [DOI] [PubMed] [Google Scholar]
- 6.Bartel DP. MicroRNAs: target recognition and regulatory functions. Cell 136: 215–233, 2009. [DOI] [PMC free article] [PubMed] [Google Scholar]
- 7.Bondar VM, Sweeney-Gotsch B, Andreeff M, Mills GB, McConkey DJ. Inhibition of the phosphatidylinositol 3′-kinase-AKT pathway induces apoptosis in pancreatic carcinoma cells in vitro and in vivo. Mol Cancer Ther 1: 989–997, 2002. [PubMed] [Google Scholar]
- 8.Boutros M, Ahringer J. The art and design of genetic screens: RNA interference. Nat Rev Genet 9: 554–566, 2008. [DOI] [PubMed] [Google Scholar]
- 9.Burris HA 3rd, Moore MJ, Andersen J, Green MR, Rothenberg ML, Modiano MR, Cripps MC, Portenoy RK, Storniolo AM, Tarassoff P, Nelson R, Dorr FA, Stephens CD, Von Hoff DD. Improvements in survival and clinical benefit with gemcitabine as first-line therapy for patients with advanced pancreas cancer: a randomized trial. J Clin Oncol 15: 2403–2413, 1997. [DOI] [PubMed] [Google Scholar]
- 10.Cheng W, Liu T, Wan X, Gao Y, Wang H. MicroRNA-199a targets CD44 to suppress the tumorigenicity and multidrug resistance of ovarian cancer-initiating cells. FEBS J 279: 2047–2059, 2012. [DOI] [PubMed] [Google Scholar]
- 11.Cong L, Ran FA, Cox D, Lin S, Barretto R, Habib N, Hsu PD, Wu X, Jiang W, Marraffini LA, Zhang F. Multiplex genome engineering using CRISPR/Cas systems. Science 339: 819–823, 2013. [DOI] [PMC free article] [PubMed] [Google Scholar]
- 12.Corcoran RB, Contino G, Deshpande V, Tzatsos A, Conrad C, Benes CH, Levy DE, Settleman J, Engelman JA, Bardeesy N. STAT3 plays a critical role in KRAS-induced pancreatic tumorigenesis. Cancer Res 71: 5020–5029, 2011. [DOI] [PMC free article] [PubMed] [Google Scholar]
- 13.Costa RH, Grayson DR, Darnell JE Jr. Multiple hepatocyte-enriched nuclear factors function in the regulation of transthyretin and alpha 1-antitrypsin genes. Mol Cell Biol 9: 1415–1425, 1989. [DOI] [PMC free article] [PubMed] [Google Scholar]
- 14.Cozzi PJ, Wang J, Delprado W, Madigan MC, Fairy S, Russell PJ, Li Y. Evaluation of urokinase plasminogen activator and its receptor in different grades of human prostate cancer. Hum Pathol 37: 1442–1451, 2006. [DOI] [PubMed] [Google Scholar]
- 15.Dawson DW, Hertzer K, Moro A, Donald G, Chang HH, Go VL, Pandol SJ, Lugea A, Gukovskaya AS, Li G, Hines OJ, Rozengurt E, Eibl G. High-fat, high-calorie diet promotes early pancreatic neoplasia in the conditional KrasG12D mouse model. Cancer Prev Res (Phila) 6: 1064–1073, 2013. [DOI] [PMC free article] [PubMed] [Google Scholar]
- 16.Engels BM, Hutvagner G. Principles and effects of microRNA-mediated post-transcriptional gene regulation. Oncogene 25: 6163–6169, 2006. [DOI] [PubMed] [Google Scholar]
- 17.Fornari F, Milazzo M, Chieco P, Negrini M, Calin GA, Grazi GL, Pollutri D, Croce CM, Bolondi L, Gramantieri L. MiR-199a-3p regulates mTOR and c-Met to influence the doxorubicin sensitivity of human hepatocarcinoma cells. Cancer Res 70: 5184–5193, 2010. [DOI] [PubMed] [Google Scholar]
- 18.Frampton AE, Castellano L, Colombo T, Giovannetti E, Krell J, Jacob J, Pellegrino L, Roca-Alonso L, Funel N, Gall TM, De Giorgio A, Pinho FG, Fulci V, Britton DJ, Ahmad R, Habib NA, Coombes RC, Harding V, Knosel T, Stebbing J, Jiao LR. MicroRNAs cooperatively inhibit a network of tumor suppressor genes to promote pancreatic tumor growth and progression. Gastroenterology 146: 268–277, 2014. [DOI] [PubMed] [Google Scholar]
- 19.Friedman JR, Kaestner KH. The Foxa family of transcription factors in development and metabolism. Cell Mol Life Sci 63: 2317–2328, 2006. [DOI] [PMC free article] [PubMed] [Google Scholar]
- 20.Fujioka S, Sclabas GM, Schmidt C, Frederick WA, Dong QG, Abbruzzese JL, Evans DB, Baker C, Chiao PJ. Function of nuclear factor kappaB in pancreatic cancer metastasis. Clin Cancer Res 9: 346–354, 2003. [PubMed] [Google Scholar]
- 21.Gao Y, Feng Y, Shen JK, Lin M, Choy E, Cote GM, Harmon DC, Mankin HJ, Hornicek FJ, Duan Z. CD44 is a direct target of miR-199a-3p and contributes to aggressive progression in osteosarcoma. Sci Rep 5: 11365, 2015. [DOI] [PMC free article] [PubMed] [Google Scholar]
- 22.Garzon R, Calin GA, Croce CM. MicroRNAs in cancer. Annu Rev Med 60: 167–179, 2009. [DOI] [PubMed] [Google Scholar]
- 23.Gironella M, Seux M, Xie MJ, Cano C, Tomasini R, Gommeaux J, Garcia S, Nowak J, Yeung ML, Jeang KT, Chaix A, Fazli L, Motoo Y, Wang Q, Rocchi P, Russo A, Gleave M, Dagorn JC, Iovanna JL, Carrier A, Pébusque MJ, Dusetti NJ. Tumor protein 53-induced nuclear protein 1 expression is repressed by miR-155, and its restoration inhibits pancreatic tumor development. Proc Natl Acad Sci USA 104: 16170–16175, 2007. [DOI] [PMC free article] [PubMed] [Google Scholar]
- 24.Hao J, Zhang S, Zhou Y, Hu X, Shao C. MicroRNA 483-3p suppresses the expression of DPC4/Smad4 in pancreatic cancer. FEBS Lett 585: 207–213, 2011. [DOI] [PubMed] [Google Scholar]
- 25.Hatziapostolou M, Polytarchou C, Aggelidou E, Drakaki A, Poultsides GA, Jaeger SA, Ogata H, Karin M, Struhl K, Hadzopoulou-Cladaras M, Iliopoulos D. An HNF4alpha-miRNA inflammatory feedback circuit regulates hepatocellular oncogenesis. Cell 147: 1233–1247, 2011. [DOI] [PMC free article] [PubMed] [Google Scholar]
- 26.He D, Miao H, Xu Y, Xiong L, Wang Y, Xiang H, Zhang H, Zhang Z. MiR-371-5p facilitates pancreatic cancer cell proliferation and decreases patient survival. PLoS One 9: e112930, 2014. [DOI] [PMC free article] [PubMed] [Google Scholar]
- 27.Henry JC, Park JK, Jiang J, Kim JH, Nagorney DM, Roberts LR, Banerjee S, Schmittgen TD. miR-199a-3p targets CD44 and reduces proliferation of CD44 positive hepatocellular carcinoma cell lines. Biochem Biophys Res Commun 403: 120–125, 2010. [DOI] [PMC free article] [PubMed] [Google Scholar]
- 28.Herbst RS, Nielsch U, Sladek F, Lai E, Babiss LE, Darnell JE Jr. Differential regulation of hepatocyte-enriched transcription factors explains changes in albumin and transthyretin gene expression among hepatoma cells. New Biol 3: 289–296, 1991. [PubMed] [Google Scholar]
- 29.Hildenbrand R, Schaaf A. The urokinase-system in tumor tissue stroma of the breast and breast cancer cell invasion. Int J Oncol 34: 15–23, 2009. [PubMed] [Google Scholar]
- 30.Hingorani SR, Petricoin EF, Maitra A, Rajapakse V, King C, Jacobetz MA, Ross S, Conrads TP, Veenstra TD, Hitt BA, Kawaguchi Y, Johann D, Liotta LA, Crawford HC, Putt ME, Jacks T, Wright CV, Hruban RH, Lowy AM, Tuveson DA. Preinvasive and invasive ductal pancreatic cancer and its early detection in the mouse. Cancer Cell 4: 437–450, 2003. [DOI] [PubMed] [Google Scholar]
- 31.Hingorani SR, Wang L, Multani AS, Combs C, Deramaudt TB, Hruban RH, Rustgi AK, Chang S, Tuveson DA. Trp53R172H and KrasG12D cooperate to promote chromosomal instability and widely metastatic pancreatic ductal adenocarcinoma in mice. Cancer Cell 7: 469–483, 2005. [DOI] [PubMed] [Google Scholar]
- 32.Hruban RH, Adsay NV, Albores-Saavedra J, Compton C, Garrett ES, Goodman SN, Kern SE, Klimstra DS, Kloppel G, Longnecker DS, Luttges J, Offerhaus GJ. Pancreatic intraepithelial neoplasia: a new nomenclature and classification system for pancreatic duct lesions. Am J Surg Pathol 25: 579–586, 2001. [DOI] [PubMed] [Google Scholar]
- 33.Hruban RH, van Mansfeld AD, Offerhaus GJ, van Weering DH, Allison DC, Goodman SN, Kensler TW, Bose KK, Cameron JL, Bos JL. K-ras oncogene activation in adenocarcinoma of the human pancreas. A study of 82 carcinomas using a combination of mutant-enriched polymerase chain reaction analysis and allele-specific oligonucleotide hybridization. Am J Pathol 143: 545–554, 1993. [PMC free article] [PubMed] [Google Scholar]
- 34.Iliopoulos D, Jaeger SA, Hirsch HA, Bulyk ML, Struhl K. STAT3 activation of miR-21 and miR-181b-1 via PTEN and CYLD are part of the epigenetic switch linking inflammation to cancer. Mol Cell 39: 493–506, 2010. [DOI] [PMC free article] [PubMed] [Google Scholar]
- 34a.Iliopoulos D, Polytarchou C, Hatziapostolou M, Kottakis F, Maroulakou IG, Struhl K, Tsichlis PN. MicroRNAs differentially regulated by Akt isoforms control EMT and stem cell renewal in cancer cells. Sci Signal 2: ra62, 2009. [DOI] [PMC free article] [PubMed] [Google Scholar]
- 35.Jackson AL, Bartz SR, Schelter J, Kobayashi SV, Burchard J, Mao M, Li B, Cavet G, Linsley PS. Expression profiling reveals off-target gene regulation by RNAi. Nat Biotechnol 21: 635–637, 2003. [DOI] [PubMed] [Google Scholar]
- 36.Kaestner KH, Lee KH, Schlondorff J, Hiemisch H, Monaghan AP, Schutz G. Six members of the mouse forkhead gene family are developmentally regulated. Proc Natl Acad Sci USA 90: 7628–7631, 1993. [DOI] [PMC free article] [PubMed] [Google Scholar]
- 37.Khoor A, Stahlman MT, Johnson JM, Olson SJ, Whitsett JA. Forkhead box A2 transcription factor is expressed in all types of neuroendocrine lung tumors. Hum Pathol 35: 560–564, 2004. [DOI] [PubMed] [Google Scholar]
- 38.Kim J, Yu W, Kovalski K, Ossowski L. Requirement for specific proteases in cancer cell intravasation as revealed by a novel semiquantitative PCR-based assay. Cell 94: 353–362, 1998. [DOI] [PubMed] [Google Scholar]
- 39.Kim S, Lee UJ, Kim MN, Lee EJ, Kim JY, Lee MY, Choung S, Kim YJ, Choi YC. MicroRNA miR-199a* regulates the MET proto-oncogene and the downstream extracellular signal-regulated kinase 2 (ERK2). J Biol Chem 283: 18158–18166, 2008. [DOI] [PubMed] [Google Scholar]
- 40.Klein WM, Hruban RH, Klein-Szanto AJ, Wilentz RE. Direct correlation between proliferative activity and dysplasia in pancreatic intraepithelial neoplasia (PanIN): additional evidence for a recently proposed model of progression. Mod Pathol 15: 441–447, 2002. [DOI] [PubMed] [Google Scholar]
- 41.Lee CS, Friedman JR, Fulmer JT, Kaestner KH. The initiation of liver development is dependent on Foxa transcription factors. Nature 435: 944–947, 2005. [DOI] [PubMed] [Google Scholar]
- 42.Lee JW, Choi CH, Choi JJ, Park YA, Kim SJ, Hwang SY, Kim WY, Kim TJ, Lee JH, Kim BG, Bae DS. Altered MicroRNA expression in cervical carcinomas. Clin Cancer Res 14: 2535–2542, 2008. [DOI] [PubMed] [Google Scholar]
- 43.Lehner F, Kulik U, Klempnauer J, Borlak J. The hepatocyte nuclear factor 6 (HNF6) and FOXA2 are key regulators in colorectal liver metastases. FASEB J 21: 1445–1462, 2007. [DOI] [PubMed] [Google Scholar]
- 44.Li D, Xie K, Wolff R, Abbruzzese JL. Pancreatic cancer. Lancet 363: 1049–1057, 2004. [DOI] [PubMed] [Google Scholar]
- 45.Li J, Zhang Y, Gao Y, Cui Y, Liu H, Li M, Tian Y. Downregulation of HNF1 homeobox B is associated with drug resistance in ovarian cancer. Oncol Rep 32: 979–988, 2014. [DOI] [PubMed] [Google Scholar]
- 46.Li J, Zhou BP. Activation of beta-catenin and Akt pathways by Twist are critical for the maintenance of EMT associated cancer stem cell-like characters. BMC Cancer 11: 49, 2011. [DOI] [PMC free article] [PubMed] [Google Scholar]
- 47.Lim LP, Lau NC, Garrett-Engele P, Grimson A, Schelter JM, Castle J, Bartel DP, Linsley PS, Johnson JM. Microarray analysis shows that some microRNAs downregulate large numbers of target mRNAs. Nature 433: 769–773, 2005. [DOI] [PubMed] [Google Scholar]
- 48.Ling H, Fabbri M, Calin GA. MicroRNAs and other non-coding RNAs as targets for anticancer drug development. Nat Rev Drug Discov 12: 847–865, 2013. [DOI] [PMC free article] [PubMed] [Google Scholar]
- 49.Liu M, Lee DF, Chen CT, Yen CJ, Li LY, Lee HJ, Chang CJ, Chang WC, Hsu JM, Kuo HP, Xia W, Wei Y, Chiu PC, Chou CK, Du Y, Dhar D, Karin M, Chen CH, Hung MC. IKKalpha activation of NOTCH links tumorigenesis via FOXA2 suppression. Mol Cell 45: 171–184, 2012. [DOI] [PMC free article] [PubMed] [Google Scholar]
- 50.Liu YN, Lee WW, Wang CY, Chao TH, Chen Y, Chen JH. Regulatory mechanisms controlling human E-cadherin gene expression. Oncogene 24: 8277–8290, 2005. [DOI] [PubMed] [Google Scholar]
- 51.Luttges J, Galehdari H, Brocker V, Schwarte-Waldhoff I, Henne-Bruns D, Kloppel G, Schmiegel W, Hahn SA. Allelic loss is often the first hit in the biallelic inactivation of the p53 and DPC4 genes during pancreatic carcinogenesis. Am J Pathol 158: 1677–1683, 2001. [DOI] [PMC free article] [PubMed] [Google Scholar]
- 52.Ma Y, Yu S, Zhao W, Lu Z, Chen J. miR-27a regulates the growth, colony formation and migration of pancreatic cancer cells by targeting Sprouty2. Cancer Lett 298: 150–158, 2010. [DOI] [PubMed] [Google Scholar]
- 53.Mali P, Yang L, Esvelt KM, Aach J, Guell M, DiCarlo JE, Norville JE, Church GM. RNA-guided human genome engineering via Cas9. Science 339: 823–826, 2013. [DOI] [PMC free article] [PubMed] [Google Scholar]
- 54.Mohr SE, Smith JA, Shamu CE, Neumuller RA, Perrimon N. RNAi screening comes of age: improved techniques and complementary approaches. Nat Rev Mol Cell Biol 15: 591–600, 2014. [DOI] [PMC free article] [PubMed] [Google Scholar]
- 55.Moskaluk CA, Hruban RH, Kern SE. p16 and K-ras gene mutations in the intraductal precursors of human pancreatic adenocarcinoma. Cancer Res 57: 2140–2143, 1997. [PubMed] [Google Scholar]
- 56.Pani L, Overdier DG, Porcella A, Qian X, Lai E, Costa RH. Hepatocyte nuclear factor 3 beta contains two transcriptional activation domains, one of which is novel and conserved with the Drosophila fork head protein. Mol Cell Biol 12: 3723–3732, 1992. [DOI] [PMC free article] [PubMed] [Google Scholar]
- 57.Park JK, Lee EJ, Esau C, Schmittgen TD. Antisense inhibition of microRNA-21 or -221 arrests cell cycle, induces apoptosis, and sensitizes the effects of gemcitabine in pancreatic adenocarcinoma. Pancreas 38: e190–e199, 2009. [DOI] [PubMed] [Google Scholar]
- 58.Rozenblum E, Schutte M, Goggins M, Hahn SA, Panzer S, Zahurak M, Goodman SN, Sohn TA, Hruban RH, Yeo CJ, Kern SE. Tumor-suppressive pathways in pancreatic carcinoma. Cancer Res 57: 1731–1734, 1997. [PubMed] [Google Scholar]
- 59.Song J, Gao L, Yang G, Tang S, Xie H, Wang Y, Wang J, Zhang Y, Jin J, Gou Y, Yang Z, Chen Z, Wu K, Liu J, Fan D. MiR-199a regulates cell proliferation and survival by targeting FZD7. PLoS One 9: e110074, 2014. [DOI] [PMC free article] [PubMed] [Google Scholar]
- 60.Sureban SM, May R, Qu D, Weygant N, Chandrakesan P, Ali N, Lightfoot SA, Pantazis P, Rao CV, Postier RG, Houchen CW. DCLK1 regulates pluripotency and angiogenic factors via microRNA-dependent mechanisms in pancreatic cancer. PLoS One 8: e73940, 2013. [DOI] [PMC free article] [PubMed] [Google Scholar]
- 61.Tang Y, Shu G, Yuan X, Jing N, Song J. FOXA2 functions as a suppressor of tumor metastasis by inhibition of epithelial-to-mesenchymal transition in human lung cancers. Cell Res 21: 316–326, 2011. [DOI] [PMC free article] [PubMed] [Google Scholar]
- 62.Thota R, Pauff JM, Berlin JD. Treatment of metastatic pancreatic adenocarcinoma: a review. Oncology (Williston Park) 28: 70–74, 2014. [PubMed] [Google Scholar]
- 63.Wang Z, Li Y, Ahmad A, Banerjee S, Azmi AS, Kong D, Sarkar FH. Pancreatic cancer: understanding and overcoming chemoresistance. Nat Rev Gastroenterol Hepatol 8: 27–33, 2011. [DOI] [PubMed] [Google Scholar]
- 64.Wilentz RE, Iacobuzio-Donahue CA, Argani P, McCarthy DM, Parsons JL, Yeo CJ, Kern SE, Hruban RH. Loss of expression of Dpc4 in pancreatic intraepithelial neoplasia: evidence that DPC4 inactivation occurs late in neoplastic progression. Cancer Res 60: 2002–2006, 2000. [PubMed] [Google Scholar]
- 65.Wolfrum C, Stoffel M. Coactivation of Foxa2 through Pgc-1beta promotes liver fatty acid oxidation and triglyceride/VLDL secretion. Cell Metab 3: 99–110, 2006. [DOI] [PubMed] [Google Scholar]
- 66.Xia JT, Wang H, Liang LJ, Peng BG, Wu ZF, Chen LZ, Xue L, Li Z, Li W. Overexpression of FOXM1 is associated with poor prognosis and clinicopathologic stage of pancreatic ductal adenocarcinoma. Pancreas 41: 629–635, 2012. [DOI] [PubMed] [Google Scholar]
- 67.Yamamoto M, Sawaya R, Mohanam S, Rao VH, Bruner JM, Nicolson GL, Rao JS. Expression and localization of urokinase-type plasminogen activator receptor in human gliomas. Cancer Res 54: 5016–5020, 1994. [PubMed] [Google Scholar]
- 68.Yamano M, Fujii H, Takagaki T, Kadowaki N, Watanabe H, Shirai T. Genetic progression and divergence in pancreatic carcinoma. Am J Pathol 156: 2123–2133, 2000. [DOI] [PMC free article] [PubMed] [Google Scholar]
- 69.Yan H, Wu J, Liu W, Zuo Y, Chen S, Zhang S, Zeng M, Huang W. MicroRNA-20a overexpression inhibited proliferation and metastasis of pancreatic carcinoma cells. Hum Gene Ther 21: 1723–1734, 2010. [DOI] [PubMed] [Google Scholar]
- 70.Yanaihara N, Caplen N, Bowman E, Seike M, Kumamoto K, Yi M, Stephens RM, Okamoto A, Yokota J, Tanaka T, Calin GA, Liu CG, Croce CM, Harris CC. Unique microRNA molecular profiles in lung cancer diagnosis and prognosis. Cancer Cell 9: 189–198, 2006. [DOI] [PubMed] [Google Scholar]
- 71.Yang X, Boehm JS, Yang X, Salehi-Ashtiani K, Hao T, Shen Y, Lubonja R, Thomas SR, Alkan O, Bhimdi T, Green TM, Johannessen CM, Silver SJ, Nguyen C, Murray RR, Hieronymus H, Balcha D, Fan C, Lin C, Ghamsari L, Vidal M, Hahn WC, Hill DE, Root DE. A public genome-scale lentiviral expression library of human ORFs. Nat Methods 8: 659–661, 2011. [DOI] [PMC free article] [PubMed] [Google Scholar]
- 72.Yauch RL, Settleman J. Recent advances in pathway-targeted cancer drug therapies emerging from cancer genome analysis. Curr Opin Genet Dev 22: 45–49, 2012. [DOI] [PubMed] [Google Scholar]
- 73.Yuan XW, Wang DM, Hu Y, Tang YN, Shi WW, Guo XJ, Song JG. Hepatocyte nuclear factor 6 suppresses the migration and invasive growth of lung cancer cells through p53 and the inhibition of epithelial-mesenchymal transition. J Biol Chem 288: 31206–31216, 2013. [DOI] [PMC free article] [PubMed] [Google Scholar]