

Abstract
Growing evidence shows that mechanisms controlling CNS plasticity extend beyond the synapse and that alterations in myelin can modify conduction velocity, leading to changes in neural circuitry. Although it is widely accepted that newly generated oligodendrocytes (OLs) produce myelin in the adult CNS, the contribution of preexisting OLs to functional myelin remodeling is not known. Here, we show that sustained activation of extracellular signal-regulated kinases 1 and 2 (ERK1/2) in preexisting OLs of adult mice is sufficient to drive increased myelin thickness, faster conduction speeds, and enhanced hippocampal-dependent emotional learning. Although preexisting OLs do not normally contribute to remyelination, we show that sustained activation of ERK1/2 renders them able to do so. These data suggest that strategies designed to push mature OLs to reinitiate myelination may be beneficial both for enhancing remyelination in demyelinating diseases and for increasing neural plasticity in the adult CNS.
SIGNIFICANCE STATEMENT Myelin is a crucial regulator of CNS plasticity, function, and repair. Although it is generally accepted that new myelin production in the adult CNS is initiated by newly generated oligodendrocytes (OLs), great interest remains in additionally driving mature preexisting OLs to make myelin. The ability to induce myelination by the larger population of preexisting OLs carries the potential for enhanced remyelination in demyelinating diseases and increased neural plasticity in the adult CNS. Here, we show that sustained activation of the extracellular signal-regulated kinases 1 and 2 (ERK1/2) signaling pathway is sufficient to drive mature OLs in the adult mouse CNS to reinitiate myelination, leading to new myelin wraps and functional changes.
Keywords: ERK MAP kinase, intracellular signaling, myelin, myelin plasticity, oligodendrocyte, remyelination
Introduction
Myelin, the specialized membrane that wraps concentrically around axons, greatly speeds neurotransmission by enabling efficient action potential propagation. In the CNS, myelin is produced by oligodendrocytes (OLs), the majority of which develop from a proliferative population of oligodendrocyte progenitor cells (OPCs) early in postnatal development. However, a small population of OPCs (∼5% of all CNS cells; Dawson et al., 2003) persists throughout adulthood and provides a continual source of new OLs that generate myelin (Young et al., 2013). Myelination is dynamically regulated by neuronal activity (Demerens et al., 1996; Stevens et al., 1998; Stevens et al., 2002; Dimou et al., 2008; Rivers et al., 2008; Psachoulia et al., 2009; Wake et al., 2011; McKenzie et al., 2014) and changes in myelin thickness, length, and axonal coverage patterns are thought to contribute to fine tuning of neuronal networks by altering the synchronicity of impulse conduction between distant cortical regions (Waxman, 1980, 1997). In fact, new myelin produced by recently differentiated OPCs is required for motor skill learning in mice (McKenzie et al., 2014). New myelin is also generated throughout life in humans, but the low rate of OL turnover suggests that myelin remodeling is performed primarily by mature OLs (Yeung et al., 2014). MRI studies show that white matter changes occur in association with cognitive development (Fields, 2008), during language learning (Schlegel et al., 2012), and after a few weeks of practicing a new skill (Bengtsson et al., 2005; Scholz et al., 2009). Together, these studies point to a role for myelin plasticity in learning and memory. The extent to which functional myelin remodeling in the adult CNS is mediated by newly generated OLs compared with new membrane produced by preexisting OLs remains unclear.
A series of recent, elegant studies show that remyelination, the regenerative response to demyelination in the CNS, is also mediated by newly generated OLs (Kang et al., 2010; Tripathi et al., 2010; Zawadzka et al., 2010), with no contribution from preexisting OLs (Gensert and Goldman, 1997; Keirstead and Blakemore, 1997; Fancy et al., 2004; Crawford et al., 2016). Because differentiating OPCs often become arrested at premyelinating stages during the progressive phase of demyelinating diseases such as multiple sclerosis (Chang et al., 2002; Sim et al., 2002) and the pool of OPCs present in the adult brain is relatively small, it is important to investigate whether the large pool of existing OLs retains any potential for myelin production in the adult CNS.
We and others have shown that the extracellular signal-regulated kinases 1 and 2 (ERK1/2) are critical for proper myelination during development (Ishii et al., 2012; Fyffe-Maricich et al., 2013; Ishii et al., 2013). In the adult, sustained activation of ERK1/2 in OPCs improves remyelination (Fyffe-Maricich et al., 2013) and ERK1/2 signaling is crucial for the maintenance of myelin (Ishii et al., 2014). In this study, we investigated the effects of sustained ERK1/2 activation in preexisting adult OLs by using tamoxifen-inducible transgenic mice that express a constitutively active variant of the ERK1/2 upstream kinase, MEK1, specifically in proteolipid protein (PLP)-expressing OLs (Plp-CreERT;Mek1DD/+). We found that increased levels of activated ERK1/2 in mature OLs resulted in increased myelin thickness, faster conduction speeds, and enhanced contextual fear conditioning. Sustained activation of ERK1/2 also enabled preexisting OLs to contribute to remyelination. Although it is accepted that newly differentiated OLs contribute to myelin plasticity and repair, our studies provide what is, to our knowledge, the first direct evidence that myelin derived from preexisting OLs can also lead to functional changes in both the injured and uninjured adult CNS.
Materials and Methods
Experimental animals
Plp-CreERT/+ mice on a C57BL/6 background (Doerflinger et al., 2003) were interbred with homozygous R26StopFLMek1DD mice (Srinivasan et al., 2009; The Jackson Laboratory) to generate Plp-CreERT;Mek1DD/+ mice, referred to as mutants or MUT, and WT;Mek1DD/+ littermates, referred to as controls or WT. Upon tamoxifen administration, Plp-CreERT;Mek1DD/+ mice exhibit expression of MEK1DD, a mutant form of rat MAPKK1 (the ERK1/2 kinase) that has been rendered constitutively active by two serine to aspartic acid substitutions (S218D/S222D) within the catalytic domain, specifically in PLP+ OLs. Expression of MEK1DD in these mice can be followed due to the addition of an EGFP marker after an internal ribosome entry site. For studies of adult OPCs, Pdgfrα-CreERT/+ mice on a mixed C57BL/6 SJL background (Kang et al., 2010) were crossed with homozygous R26StopFLMek1DD mice. For experiments in which labeling of myelin was required, Plp-CreERT;Mek1DD/+ or Pdgfrα-CreERT;Mek1DD/+ mice were interbred with homozygous Tau-lox-mGfp-Ires-Nls-LacZ-pA (mGFP) mice (Hippenmeyer et al., 2005). For tamoxifen induction, a 10 mg/ml tamoxifen solution was prepared by dissolving 100 mg of tamoxifen (Sigma-Aldrich) in 1 ml of 100% EtOH and 9 ml of sunflower oil and injected intraperitoneally into adult mice at 100 mg/kg once daily for either 5 or 10 consecutive days. Although the recombination rate did not significantly differ between these two paradigms (p = 0.99), all mice within individual experiments were treated in the same manner to maintain consistency. All mice were kept in microisolation in a pathogen-free environment at the University of Pittsburgh and all procedures were conducted according to approved Institutional Animal Care and Use Committee guidelines.
Immunolabeling of frozen sections
Mice were fixed by intracardiac perfusion using 4% PFA/PBS, postfixed overnight, and then cryoprotected overnight in 20% sucrose/PBS. Immunolabeling was performed as described previously (Michel et al., 2015) with slight modifications. Briefly, for myelin basic protein (MBP) or PLP immunostaining, sections were preincubated in 100% EtOH for 10 min. For all other immunostaining, sections were subjected to antigen retrieval in sodium citrate buffer for 5–10 min. Sections were incubated with primary antibodies at 4°C overnight and then incubated with secondary antibodies at room temperature for 1 h. Primary antibodies used were CC1 (1:100; CalbioChem), NG2 (1:250; Millipore), GFP (1:500; Invitrogen, chicken anti-GFP (1:1000; Aves Laboratories), pERK1/2 (1:250; Cell Signaling Technology), MBP (1:500; SMI-99; Covance), PLP (1:500; Abcam), CASPR (1:200; Millipore), NaV1.6 (1:300; Alomone Laboratories), and OLIG2 (1:250; Millipore). Alexa Fluor-conjugated IgG (1:500; Invitrogen) were used for secondary antibodies for all mouse and rabbit primaries. Alexa Fluor-conjugated IgG (1:500; Jackson ImmunoResearch Laboratories) was used for secondaries against chicken primary antibodies. For 5-ethylnyl-2′-deoxyuridine (EdU) labeling and detection, the Click-iT Plus EdU Alexa Fluor 555 imaging kit (Thermo Fisher Scientific) was used before standard immunostaining protocols.
Cell counts
Images were acquired using a Nikon Eclipse C1 microscope and a Nikon DS-Qi1Mc camera. For cell counts from the spinal cord, all cells within the dorsal spinal column were counted from three images each from at least three mice per genotype. For cell counts from the corpus callosum, a standard region of interest (ROI; 67,000 μm2) was used and cells were counted from three images each from at least three mice per genotype. When performing pERK immunostaining intensity analysis, at least 12 cells per mouse and three mice per genotype were individually analyzed in both tissues using Nikon NIS Elements software. When determining the number of nodes of Ranvier, an ROI of 3700 μm2 was used to count at least 200 nodes from each mouse (three images each from at least three mice per genotype) from images taken using a confocal microscope. When measuring paranode and node length in the corpus callosum, at least 100 of each per mouse were analyzed. Data were analyzed using Student's t test with Welch's correction.
Western immunoblotting
Mouse callosum and overlying cortex or thoracic spinal cord were dissected on ice and snap frozen in a dry ice/ethanol bath. Individual samples of at least four mice per genotype were obtained. Snap-frozen tissue (callosum and overlying cortex and thoracic spinal cord) was lysed with RIPA buffer (Sigma-Aldrich) supplemented with 1× protease and phosphatase inhibitor mixture (Halt Protease and Phosphatase Inhibitor Cocktail; Thermo Fisher Scientific) and homogenized by sonication. Lysates were cleared by centrifugation and collected. Briefly, equal amounts of total protein were loaded from 4–5 mice per genotype onto 8–20% SDS-PAGE gels (Invitrogen) and then transferred to PVDF membranes (Millipore). Membranes were blocked in 5% milk powder in TBS/0.2% Tween 20 (TBS-T) for 1 h at room temperature and incubated overnight at 4°C in primary antibodies. Membranes were probed with the following antibodies: GAPDH (1:10,000; Santa Cruz Biotechnology), MBP (SMI-99, 1:5000; Covance), myelin oligodendrocyte glycoprotein (MOG; 1:1000; Santa Cruz Biotechnology), and PLP (1:3000; Abcam). After washing with TBS-T, membranes were incubated with HRP-conjugated secondary antibodies (1:5000; Millipore) in TBS-T with 5% milk for 1 h at room temperature. Blots were washed in TBS-T and developed with WesPico chemiluminescence reagents (Thermo Fisher Scientific). Western blot films were analyzed using ImageJ software and all protein measurements were normalized to blot-specific GAPDH values. Statistical analysis was performed using Student's t test with Welch's correction.
qRT-PCR
Adult mice were anesthetized with isoflurane and cervically dislocated. Tissue samples of callosum and overlying cortex and thoracic spinal cord were collected and snap frozen in a dry ice/ethanol bath. Total RNA from at least three samples per genotype was isolated using TRIzol reagent (Life Technologies), followed by a Qiagen RNeasy clean-up kit. RNA (3 μg) was reverse transcribed to cDNA using SuperScript III First-Strand Synthesis System for RT-PCR (Invitrogen). qRT-PCR was performed using Taqman gene expression assays and master mix (Applied Biosystems). Taqman gene expression assays (primer/probe sets) used were as follows: Gapdh (Mm99999915_g1), Mbp (Mm01266402_m1), Mog (Mm00447824_m1), Plp (Mm04336505_mH), Myrf (Mm01194959_m1), and Ugt8a (Cgt; Mm00495930_m1), and 50–100 ng of cDNA per reaction. Plates were run on the StepOnePlus Real Time PCR System from Applied Biosystems using standard mode and sample results were normalized to corresponding Gapdh values. Statistical analysis was performed using Student's t test with Welch's correction.
Electron microscopy (EM)
Adult mice were perfused with 4% paraformaldehyde (PFA) and spinal cord and brain samples were drop fixed in 4% PFA/2% gluteraldehyde in 0.1 m sodium cacodylate buffer, pH 7.4 (Electron Microscopy Sciences) overnight. Samples were then postfixed in 1% OsO4. Samples were dehydrated through graded ethanol, stained en bloc with uranyl acetate, and embedded in a Poly/Bed812 resin (Electron Microscopy Sciences). Thin (70 nm) sections were stained with toluidine blue and ultrathin (350 nm) sections from matching areas of experimental and control tissue blocks were cut and visualized at 5000×, 10,000×, or 40,000× magnification using an electron microscope (JEOL 1400) at 80 kV. For g-ratio calculations and unmyelinated axon counts, electron micrographs were analyzed from at least three mutant and three control mice. G-ratios were measured using ImageJ software and are presented as the axon diameter/total diameter of the myelinated axon from ∼100 axons per mouse. Linear regression was used for indicating the differences between the groups in myelin thickness across the range of axon diameters. Average g-ratios were compared using Student's t test with Welch's correction.
LC-MS/MS analysis for galactosylceramide (GalC) quantification
Sample preparation.
Tissue samples from at least 3 mice per genotype were weighed before homogenization in 0.6 ml of PBS using 0.5 mm glass beads for 3 min on speed 8 in the Bullet Blender (NextAdvance). A 50 μl aliquot was reserved for protein determination and the rest of the homogenate was brought to a volume of 0.7 ml with PBS and extracted with 3 ml of CHCl3:MeOH (2:1) after the addition of 20 μl of the C18 glucosyl(β) ceramide-d5 (1 μg/ml) internal standard. Samples were vortexed and centrifuged at 2800 rpm for 10 min. The organic layer was dried under N2 and samples were saponified with 1 ml of 1 m NaOH, 90 min at room temperature to hydrolyze interfering complex lipids. Before extraction with 5 ml of diethyl ether, samples were acidified with 100 μl of concentrated HCl. The organic layer was dried under N2 and samples were reconstituted in 300 μl of methanol for LC-MS/MS analysis.
GalC quantification.
Solvent composition consisted of 2 mm ammonium formate in water with 0.1% formic acid (solvent A) and 2 mm ammonium formate in methanol with 0.1% formic acid (solvent B). The gradient was held at 50% solvent B for the first minute and increased to 80% solvent B at 2.3 min. Over the next 8 min, solvent B was ramped to 100% and held for 5 min before returning to initial conditions for an additional 5 min. A targeted method in positive mode was used to trigger an MS2 of the following species: d18:1/24:1, d18:1/24:0, d18:1/22:1, and d18:1/22:0. Mass parameters for the galactosyl ceramides included the following: collision energy 35, 100 ms IT, 35K resolution, and an isolation window of 1.5 m/z.
Galactosyl ceramides (10 μl injection) were analyzed on a Thermo Fisher Scientific Q Exactive mass spectrometer after LC separation using a Phenomenex Kinetex 2.1 × 50 mm, 5 μ column at a flow rate of 0.5 ml/min. Samples were quantified based on a calibration curve using C24:1 β-d-galactosyl ceramide (d18:1/24:1) and C18 glucosyl(β) Ceramide-d5 (d18:1/18:0) standards (Avanti Polar Lipids). Galactosyl ceramides were quantified using the extracted ion current for m/z 264.2685, the characteristic fragment for the d18:1 sphingosine backbone, and are reported as picomoles per milligram of protein. For statistical analysis, Student's t test was performed.
Auditory brainstem responses
For auditory brainstem response (ABR) testing, we followed a protocol described previously (Wang et al., 2011). All mice (n = 10 WT;Mek1DD/+; n = 10 Plp-CreERT;Mek1DD/+) were tested under isoflurane anesthesia (at a concentration of 3% in oxygen for induction and 1.5% for maintenance) for hearing thresholds by recording ABRs to click in a sound-attenuating cubicle. A heating pad was used to maintain a constant body temperature of 37°C. Sound levels for clicks and pure tones were calibrated using Etymotic Low Noise Probe and Microphone (ER10B; TDT). The calibration microphone was interfaced with our close-field speaker (MF1-M; TDT) using a 2 cm plastic tube, which was placed in a sealed (sound isolated) pipette tip (the coupler). All connections between the speaker, tube, coupler, and microphone were airtight to avoid inaccurate calibration. Calibration was performed using the TDT program BioSigRZ. All calibration and ABRs were conducted in a sound-attenuating cubicle (ENV-022SV; Med Associates). ABR testing was conducted using a TDT evoked potential workstation (RZ6 Multi I/O Processor; TDT) and a close-field speaker (MF1-M, TDT). Three register electrodes (an active, reference, and ground) were placed subcutaneously on the midline of the vertex (+), on the cheek toward the ear (−), and on the hind leg (ground). The electrodes were connected to a four-channel low-impedance headstage (RA4 LI; TDT). Sound stimuli signals were generated and analyzed using BioSigRZ software (TDT). Click stimuli lasted 0.1 ms, with a linear rise-fall time of 2.5 ms and no plateau. Evoked potentials were averaged over 1024 sweeps and waveforms were filtered using a band-pass filter of 300–3000 Hz. ABR waveforms were recorded at decreasing intervals of 10 dB from 80 to 50 dB and decreasing intervals of 5 dB from 10 dB down for clicks. Thresholds were measured at 2 months postinjection (mpi). Auditory thresholds for click were determined by blind visual inspection at the lowest intensity at which waves I and II were detectable above noise within a specified time window. The latency and interpeak latency of click ABR waves were analyzed at 80 dB SPL. Results were analyzed by performing Student's t test with Welch's correction.
Behavioral analyses
For all behavioral tests, 2–3 mpi adult mice were acclimated to testing rooms in home cages for 60 min 1–2 d before testing and again for 30–60 min before testing the day of analysis.
Open field.
Adult mice of both genotypes (n = 10 WT;Mek1DD/+; n = 10 Plp-CreERT;Mek1DD/+) were room acclimated for 30 min before testing. Mice were placed singly into open-field arenas with automated photo-beam detection systems (DIG-729; Med Associates) connected to Activity Monitor software (Med Associates). Room lighting was set to 30 lux for general activity observations and data were collected for 60 min total. For analysis, ambulatory distance was calculated for each mouse in 5 min blocks of time for the course of the test, as well as over the entire 60 min. Both male and female mice were used because no significant differences in activity were seen using Student's t test with Welch's correction. To compare activity by genotypes, Student's t test with Welch's correction was performed.
Wire hang.
After acclimation under infrared lighting, adult male mice of both genotypes (n = 9 WT;Mek1DD/+; n = 10 Plp-CreERT;Mek1DD/+) were placed individually on the middle of a wire (1 mm in diameter) so that forepaws were used to grasp to wire. Time to fall from the wire was recorded. If mice reached the end of the wire before the end of the 60 s trial, they were removed and placed at the start position. For statistical analysis, Student's t test with Welch's correction was used.
Dowel walk.
After acclimation under infrared lighting, adult male mice of both genotypes (n = 9 WT;Mek1DD/+; n = 10 Plp-CreERT;Mek1DD/+) were placed individually in the center of a 30 cm dowel measuring 7 mm in diameter for 2 min. The number of times that each mouse reached an end of the dowel was recorded. When a mouse reached one end of the dowel where a support platform was, they were turned around to make their way across the dowel in the opposite direction until the end of the 2 min trial. Statistical analysis was performed using Student's t test with Welch's correction.
Complex ladder.
The complex ladder assay was adapted from Farr et al. (2006). Adult male mice (n = 9 WT;Mek1DD/+; n = 10 Plp-CreERT;Mek1DD/+) were acclimated under infrared lighting and then placed on one end of a complex ladder with a bright light directed toward the rear, encouraging the mice to traverse the ladder toward their home cage and cage mates placed at the other end. Mice traversed the complex ladder three times sequentially and were recorded using a 10 MP camera to observe foot slips. Foot slips were counted for each mouse and a two-way ANOVA with Sidak's multiple-comparisons post hoc test was performed for analysis.
Rotarod.
For assessment of motor learning, adult male WT and mutant mice (n = 8 WT;Mek1DD/+; n = 10 Plp-CreERT;Mek1DD/+) were trained on an accelerating rotarod (IITC Life Science) at 4–40 RPM over 5 min. Mice were room acclimated under infrared lighting then allowed to acclimate to the rotarod for 60 s before rotation began and trained for 4 trials with 20–30 min intertrial intervals daily for 5 d in a row. Latency to fall was recorded for each trial run and averaged for the four trials for each mouse. Statistical analyses were performed using two-way ANOVA with Tukey's or Sidak's multiple-comparisons post hoc test.
Novel object recognition (NOR).
For NOR testing, rubber tubs 24 inches in diameter were used as test arenas with removable plastic bottoms designed to hold desired objects in place. Female mice of both genotypes (n = 7 WT;Mek1DD/+; n = 7 Plp-CreERT;Mek1DD/+) were room acclimated to a lighting level of 40 lux and acclimated to empty testing tubs for 30 min. Mice were then familiarized to two identical objects for a duration of 15 min and video recorded with Panasonic WV-BP334 cameras before being removed to home cages for a retention interval of 30 min. Mice were then returned to a clean arena with one familiar object and one novel object and explorations were recorded for 10 min. For analysis, Limelight software (Actimetrics) was used to score interactions with familiar and novel objects manually to calculate preference. Student's t test with Welch's correction was used to analyze differences in performance statistically by genotype.
Conditioned fear.
For conditioned fear testing, adult mice of both genotypes (10 WT;Mek1DD/+; 10 Plp-CreERT;Mek1DD/+) were room acclimated to a lighting level of 10 lux. On the day of testing, mice were placed individually into habitat isolation cubicles (#H10–24; Coulbourn Instruments) that were lit by dim white light and contained Plexiglas chambers custom-fitted to shock grids (Coulbourn Instruments). FreezeFrame software (Coulbourn Instruments) was used to collect video data from Panasonic WV-BP334 cameras mounted to the top of each Plexiglas chamber and control tone and shock timing. Mice experienced the following paradigm on training day: initial period (90 s), 80 dB tone (30 s), 0.4 mA foot shock (last 3 s of 30 s tone), intertrial interval (90 s), 80 dB tone (30 s), 0.4 mA foot shock (last 3 s of 30 s tone), and final period (30 s). On the test day (24 h later), mice were first tested for context association by being placed in the same environment as was presented during training. Mice were video recorded as before for 5 min without tone or shock. Two hours later, mice were tested for cue association by being placed in a new environment (dim yellow lighting in cubicles, new cleaning solution and room scent, patterns attached to Plexiglas chamber walls, shock grids removed). Mice were video recorded over the duration of the test, which ran as follows: exploratory period of 180 s, followed by an 80 dB tone for 30 s. For analysis, FreezeView software (Coulbourn Instruments) was used to determine freezing automatically (bouts defined as ≥1.5 s; thresholds for motion detection were set manually). For context testing, baseline freezing (obtained from initial period of training day) was subtracted from observed freezing during the trial. For cue testing, baseline freezing (exploratory period) was subtracted from observed freezing during the tone. Because no significant differences were found in male and female performance, both sexes were used for analysis. Student's t test with Welch's correction was performed for statistical analyses.
Demyelination by lysolecithin (LPC) injection
All LPC injections were performed on sex-matched pairs of control and mutant adult mice (both males and females; n = 3–5 per genotype) 3 months of age or older. Dorsal laminectomy was performed at the T11/T12 level and 1.5 μl of 1% LPC (L-α-lysophosphatidyl-choline; Sigma-Aldrich) in a 0.9% sodium chloride solution was microinjected with a beveled Hamilton needle (33 gauge, 1.5 inch length; Hamilton Robotics) into the dorsal column of the spinal cord at a rate of 5 nL/s using a Pump 11 Elite (Harvard Apparatus). To prevent liquid reflux at the completion of the injection, the needle was left in place for 3 min before removal. Importantly, charcoal was used to mark the site of LPC injection so that the area of tissue at the lesion center could be unambiguously identified even after remyelination was complete. When detection of proliferating cells was desired, a 5 mg/ml solution of 5-ethylnyl-2′-deoxyuridine from the Click-iT Plus EdU Alexa Fluor 555 imaging kit (Thermo Fisher Scientific) was prepared in ddH2O. Lesioned mice were administered EdU (3 mg/kg) intraperitoneally once daily for 2 d postlesion (dpl).
Statistical analysis
For experiments simply comparing two treatment groups (or genotypes), Student's t test with Welch's correction was used to analyze the data. The one exception to this was LC-MS/MS GalC quantification, which was analyzed using the Student's t test assuming equal SDs. In rotarod and complex ladder behavior tests, two variables were accounted for (time and treatment group) and a two-way ANOVA with Sidak's multiple-comparisons test was used for analysis.
Results
Sustained activation of ERK1/2 in OLs of adult mice drives myelin sheath expansion through the addition of new myelin to existing sheaths
WT;Mek1DD/+ (WT) and Plp-CreERT;Mek1DD/+ (MUT) littermate mice were injected with tamoxifen at adulthood (postnatal day 60, P60) to induce recombination and the subsequent expression of MEK1DD. Mice were harvested either 21 dpi or 2 mpi. Immunostaining using antibodies against CC1 (a marker of mature OLs) and GFP (a reporter of MEK1DD expression) indicated that ∼60% of OLs expressed MEK1DD in both spinal cord white matter and the corpus callosum, consistent with recombination rates reported in previous studies using Plp-CreERT mice (Guo et al., 2010). To confirm that the expression of MEK1DD drove enhanced phosphorylation of ERK1/2 (pERK1/2) in mature OLs, tissue sections from the corpus callosum and spinal cord at 2 mpi were double-immunostained with antibodies against CC1 and pERK1/2. The percentage of mature OLs that colabeled for pERK1/2 in Plp-CreERT;Mek1DD/+ mice was significantly increased compared with littermate controls in both the spinal cord (WT = 15.5 ± 2.9%, MUT = 55.0 ± 3.2%, p = 0.0001) and corpus callosum (WT = 12.4 ± 2.8%, MUT = 30.9 ± 1.9%, p = 0.008; Fig. 1A,B). Interestingly, the percentage of pERK1/2+ OLs was significantly lower in the corpus callosum than in the spinal cord of mutant mice (p = 0.0007) despite the fact that recombination rates were similar in both tissues. In addition, analysis of pERK immunostaining intensity in individual CC1+ cells confirmed that mutant mice displayed a significant 176.59% increase in pERK levels in the spinal cord and 34.27% increase in the corpus callosum. Finally, numbers of mature OLs did not differ between Plp-CreERT;Mek1DD/+ and control littermates in either the dorsal column of the spinal cord (WT = 83.1 ± 7.1, MUT = 89.2 ± 4.2, p = 0.51) or corpus callosum (WT = 78.4 ± 4.1, MUT = 78 ± 6.3, p = 0.96), suggesting that increased levels of pERK1/2 do not affect baseline OL survival (Fig. 1C).
Figure 1.
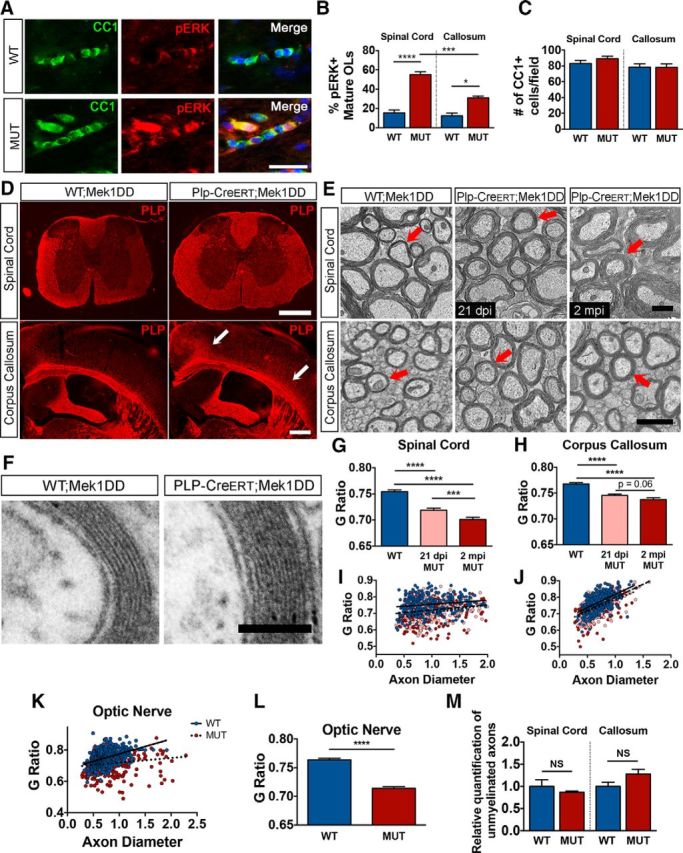
Plp-CreERT; Mek1DD/+ mice demonstrate increased myelin thickness as a result of the addition of new myelin wraps to existing myelin sheaths. A, Matched corpus callosum (CC) sections from adult WT;Mek1DD/+ (WT) and Plp-CreERT;Mek1DD/+ (MUT) mice at 2 mpi stained with CC1 (green) and pERK (red). Scale bar, 25 μm. B, Quantification confirms a significant increase in the percentage of CC1+ cells that colabeled with pERK in MUT mice in both spinal cord (SC) and CC. C, Quantification of the total number of CC1+ mature OLs in the dorsal column of the SC and the CC at 2 mpi demonstrates no significant difference between WT and MUT mice. D, Matched SC and CC sections immunolabeled with anti-PLP reveal enlargement of white matter structures in MUT mice. Arrows point to expanded areas of the CC. Scale bars, 500 μm. E, Electron micrographs of SC and CC show increased myelin thickness in MUT mice compared with control littermates at 21 dpi and at 2 mpi. Arrows indicate example axons of similar diameter. Scale bar for SC, 2 μm; CC, 1 μm. F, High-magnification electron micrographs reveal that the additional myelin wraps seen in MUT mice appear ultrastructurally normal. Scale bar, 100 nm. G, H, Analysis of SC electron micrographs by g-ratio calculation shows significantly decreased g-ratios (thicker myelin) in both 21 dpi MUT (pink) and 2 mpi MUT (red) mice compared with WT (blue) controls, with a significant decrease from 21 dpi to 2 mpi. I, J, g-ratio calculation from CC electron micrographs indicates significantly decreased g-ratios in both 21 dpi MUT (pink) and 2 mpi MUT (red) mice compared with WT (blue) controls. K, Analysis of optic nerve (ON) EM shows significantly decreased g-ratios in 2 mpi MUT (red) mice compared with WT (blue) controls. L, Average ON g-ratios show overall significantly decreased g-ratios observed in MUT (red) mice versus WT (blue) controls. M, Examining the number of unmyelinated axons in SC and CC electron micrographs shows no difference between WT (blue) and 2 mpi MUT (red) mice. ****p < 0.0001, ***p < 0.001, *p < 0.05. Data are shown as mean ± SEM. At least three mice per genotype were used for all analyses; at least 100 axons per mouse were analyzed for g-ratio calculations.
To determine whether increased pERK1/2 expression was sufficient to cause hypermyelination and white matter tract expansion, matched sections from spinal cord and brain were immunostained for PLP, a major myelin protein. Plp-CreERT;Mek1DD/+ mice displayed a dramatic expansion of the thoracic spinal cord white matter accompanied by subtle expansion of the medial and lateral aspects of the corpus callosum (Fig. 1D). Myelin thickness was assessed using EM, followed by g-ratio calculation (axon diameter/total outer diameter of myelinated fiber). Plp-CreERT;Mek1DD/+ mice demonstrated significantly lower g-ratios (thicker myelin) at 21 dpi in both spinal cord (WT = 0.754 ± 0.003, MUT = 0.719 ± 0.004, p = 9.69 × 10⁻¹¹) and corpus callosum (WT = 0.768 ± 0.003, MUT = 0.746 ± 0.003, p = 4.18 × 10⁻⁸; Fig. 1E,G–J). In addition, myelin thickness increased slowly over time in the mutant spinal cord, as demonstrated by a decrease in the g-ratio with increasing age (21 dpi MUT = 0.719 ± 0.004, 2 mpi MUT = 0.701 ± 0.004, p = 0.002; Fig. 1G,I). Average g-ratios in the corpus callosum showed a similar trend of decreasing over time (21 dpi MUT = 0.746 ± 0.003, 2 mpi MUT = 0.738 ± 0.004, p = 0.06; Fig. 1H,J). High-power magnification revealed similar myelin ultrastructure between mutant mice and control littermates, demonstrating that the increased myelin thickness was due to the addition of new myelin wraps (Fig. 1F). Importantly, similar numbers of mature OLs in Plp-CreERT;Mek1DD/+ and control littermates suggests that the increased myelin thickness in mutants resulted from enhanced myelin production by individual OLs (Fig. 1C).
The adult corpus callosum contains >70% unmyelinated axons (Sturrock, 1980), making it difficult to determine whether sustained ERK1/2 activation drove myelination of normally unmyelinated axons or addition of myelin to existing sheaths. To distinguish between these possibilities, we examined adult mouse optic nerve, which consists almost entirely of myelinated axons (Honjin et al., 1977; Bartsch et al., 1997; Dangata and Kaufman, 1997). If excess pERK1/2 solely enabled OLs to myelinate normally unmyelinated axons, then we would not expect to see hypermyelination in the optic nerve. However, EM analysis of optic nerve at 2 mpi revealed significantly decreased g-ratios in Plp-CreERT;Mek1DD/+ mice compared with control littermates (WT = 0.750 ± 0.003, MUT = 0.714 ± 0.003, p = 8.73 × 10⁻¹⁶), suggesting that increased pERK1/2 drives addition of new myelin to existing sheaths (Fig. 1K–M). Furthermore, analysis of electron micrographs from 2 mpi spinal cord and corpus callosum revealed no significant differences in the relative numbers of unmyelinated axons between Plp-CreERT;Mek1DD/+ and WT;Mek1DD/+ mice (Fig. 1M). These data indicate that sustained ERK1/2 activation induces addition of new myelin to existing sheaths rather than de novo myelination of naked axons.
Global hypermyelination in Plp-CreERT;Mek1DD/+ mice is largely mediated by preexisting mature OLs
Although the Plp promoter is active primarily in mature OLs, adult Plp-CreERT mice also express Cre recombinase in a small percentage (5–20%) of OPCs (Guo et al., 2010). These data raise the possibility that the hypermyelination observed in the Plp-CreERT;Mek1DD/+ mice may be mediated by excess myelin generated by a small population of recently differentiated MEK1DD+ adult OPCs rather than by preexisting OLs. To address this question, we used an inducible Pdgfrα-CreERT (Kang et al., 2010) to express MEK1DD specifically in adult OPCs. Tamoxifen was administered to adult (P60) WT;Mek1DD/+ (WT) and Pdgfrα-CreERT;Mek1DD/+ (MUT2) mice to induce recombination. Double-immunostaining for GFP and the OPC marker NG2 in MUT2 mouse corpus callosum confirmed that a large number (∼55%) of OPCs had recombined after injection with tamoxifen (Fig. 2A). Over the course of 2 months, these recombined OPCs differentiated into mature CC1+ OLs that expressed high levels of pERK1/2 (Fig. 2B) and made up ∼20% of the total mature OL population, consistent with previous work examining adult OPC differentiation in WT mice (Young et al., 2013). These results suggest that the increased pERK did not result in accelerated differentiation, which is also consistent with previously published in vivo studies (Fyffe-Maricich et al., 2013; Ishii et al., 2013). Immunostaining of matched spinal cord sections at 2 mpi using antibodies against MBP revealed that the overall size of the white matter appeared similar across genotypes, suggesting that upregulation of pERK1/2 in adult OPCs is not sufficient to cause white matter expansion within this time frame (Fig. 2C). In addition, EM analysis of the corpus callosum at 2 mpi demonstrated comparable g-ratios between WT;Mek1DD/+ and Pdgfrα-CreERT;Mek1DD/+ mice (WT = 0.770 ± 0.002, MUT2 = 0.771 ± 0.003, p = 0.72; Fig. 2D,E). Therefore, we conclude that new myelin generated by preexisting, mature OLs in the Plp-CreERT;Mek1DD/+ mice must contribute significantly to the hypermyelination phenotype.
Figure 2.
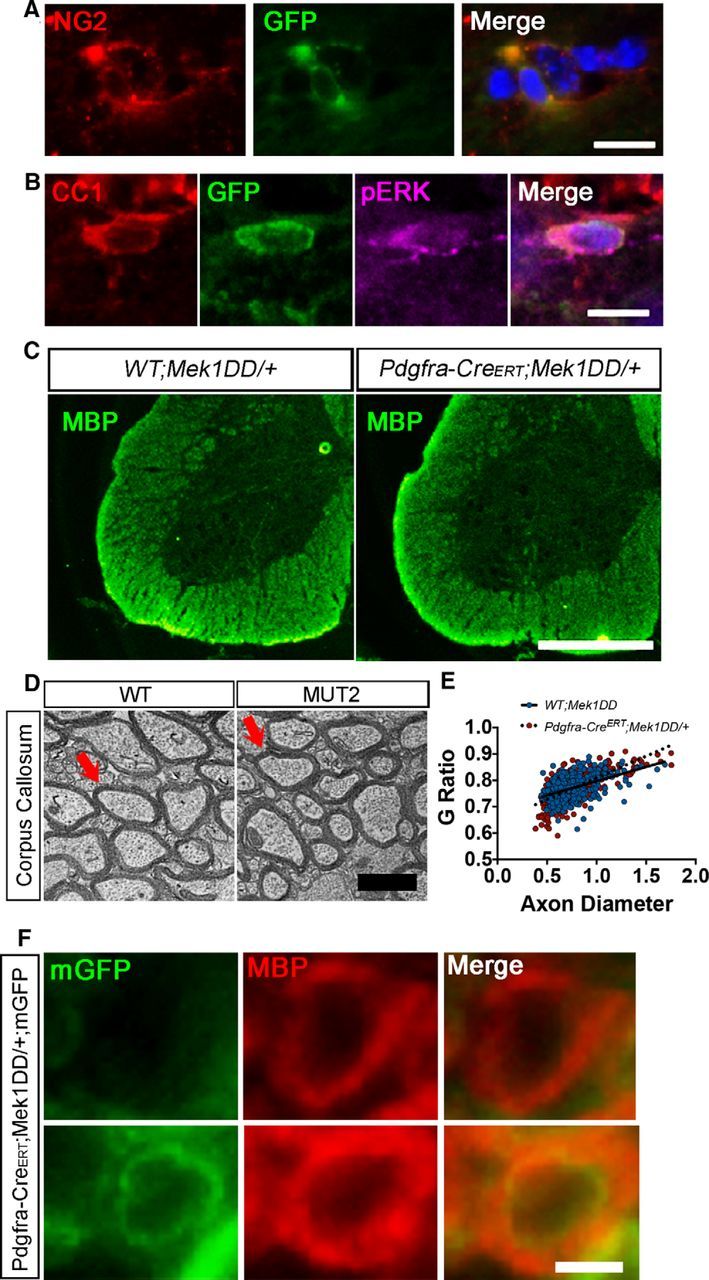
Increased pERK1/2 in adult OPCs, but not preexisting OLs, does not cause global hypermyelination. A, Immunostaining of Pdgfrα-CreERT;Mek1DD/+ corpus callosum with antibodies against NG2 (red) and GFP (green) confirms that adult OPCs have recombined to activate the expression of MEK1DD and the GFP reporter. DAPI marks cell nuclei in blue. Scale bar, 10 μm. B, CC1, GFP, and pERK triple immunostaining of 2 mpi Pdgfrα-CreERT;Mek1DD/+ corpus callosum confirms that MEK1DD expressing adult OPCs differentiate into mature oligodendrocytes with elevated pERK1/2. DAPI marks cell nuclei in blue. Scale bar, 10 μm. C, MBP immunostaining of matched spinal cord sections from WT;Mek1DD/+ and Pdgfra-CreERT;Mek1DD/+ mice at 2 mpi demonstrates that there is no significant expansion of the white matter tracts. Scale bar, 500 μm. D, Electron micrographs from the corpus callosum at 2 mpi reveals comparable myelin thickness in WT;Mek1DD/+ and Pdgfra-CreERT;Mek1DD/+ mice. Scale bar, 2 μm. Arrows indicate representative axons. E, Scatter plot depicting similar g-ratios from WT;Mek1DD/+ (blue) and Pdgfra-CreERT;Mek1DD/+ (red) mice in relation to axon diameter. F, Immunostaining with antibodies against MBP and mGFP reveals thicker myelin produced by a recombined newly generated OL versus an unrecombined OL. Scale bar, 1 μm. At least three mice per genotype were used for all analyses; at least 100 axons per mouse were analyzed for g-ratio calculations.
Although overall myelin thickness was not altered in the Pdgfrα-CreERT;Mek1DD/+ mice, we hypothesized that increased levels of pERK1/2 were sufficient to drive increased thickness of new myelin sheaths that was undetectable globally. To test this hypothesis, Pdgfrα-CreERT;Mek1DD/+ mice were crossed to reporter mice that express a membrane-bound GFP after Cre-mediated recombination (Tau-lox-mGfp-Ires-Nls-LacZ-pA; Hippenmeyer et al., 2005) so that myelin generated by newborn OLs is labeled green. Myelin produced by newborn OLs with sustained activation of ERK1/2 (mGFP signal localized to the inner tongue, but was excluded from compact myelin as seen in Young et al., 2013) appeared thick, visualized by an expansion of the MBP signal compared with adjacent axons of similar caliber that were mGFP− (Fig. 2F). More than 70 mGFP+ myelinated axons were analyzed visually and compared with non-mGFP+ myelinated axons. The majority of mGFP+ myelinated axons appeared visibly thicker (79.92 ± 1.37%) and those that did not were likely the result of de novo myelination that had just begun. These data suggest that increased levels of pERK1/2 are sufficient to drive excess myelin production by newly generated OLs in the adult CNS, consistent with previously published studies using Cnp-Cre;Mek1DD/+ mice (Fyffe-Maricich et al., 2013; Ishii et al., 2013). However, due to the fact that the amount of new myelin produced over the 2 month period is such a small percentage of the total amount of CNS myelin, the hypermyelination remains undetectable on a global level.
ERK1/2 signaling in mature OLs drives the production of both myelin proteins and lipids
Previous studies from us and others show that ERK1/2 signaling is necessary for transcription of MBP and PLP (Ishii et al., 2012; Ishii et al., 2014) and for translation of MBP after demyelination (Michel et al., 2015). To determine whether sustained ERK1/2 activation in mature OLs of the adult CNS is sufficient to drive increased transcription and/or translation of major myelin proteins, we quantified protein expression from Plp-CreERT;Mek1DD/+ and WT;Mek1DD/+ cortex and underlying corpus callosum at 2 mpi using Western blot analysis. Mutant mice exhibited significant increases in MOG and PLP expression compared with control littermates (Fig. 3A,B). Although the overall levels of MBP were not significantly increased (p = 0.27), separate examination of heavy (21.5 kDa) and light (18 kDa) MBP isoforms revealed a significant increase specifically in the 18 kDa isoform (27.9 ± 10.7%, p = 0.04; Fig. 3B). To determine whether these changes in myelin protein expression were the result of transcriptional changes, we next performed qRT-PCR and found significant increases in Mog and Plp mRNA expression (Fig. 3C). However, Mbp levels were comparable between Plp-CreERT;Mek1DD/+ and WT;Mek1DD/+ controls, suggesting that regulation of MBP occurs at the level of translation in these mice (Fig. 3C).
Figure 3.

Enhanced ERK1/2 signaling in mature OLs of adult mice drives the synthesis of excess myelin proteins and lipids. A, B, Western blot analysis of corpus callosum and overlying cortex at 2 mpi reveals increased levels of the myelin proteins MOG, PLP, and the 18.5 kDa isoform of MBP in Plp-CreERT;Mek1DD/+ (MUT) mice compared with WT;Mek1DD/+ (WT) littermate controls. C, qRT-PCR from corpus callosum and overlying cortex at 2 mpi shows significantly increased Mog and Plp transcripts in MUT (red) mice compared with WT (blue) controls. D, Quantification of the major myelin lipid GalC species using mass spectrometry shows a significant increase in the relative concentration of GalC in MUT (red) compared with WT (blue) corpus callosum, each d18:1 species is normalized to itself in WT. E, qRT-PCR results demonstrate a significant upregulation of Myrf and Cgt at 2 mpi in MUT (red) mice. F, Similar 1RT-PCR analysis at an earlier time point of 14 dpi indicates a significant increase in Cgt, but not Myrf, in MUT (red) corpus callosum compared with littermate (blue) controls. ***p < 0.001, **p < 0.01, *p < 0.05. Data are shown as mean ± SEM. Four to five mice per genotype were used for Western blot analysis; at least three mice per genotype were used for qRT-PCR and LC-MS/MS analysis.
Although myelin is composed of ∼20% protein, the remaining 80% is made up of lipids, one of which is GalC, a glycosphingolipid commonly used to identify OLs. GalC and its sulfated derivative make up nearly 30% of the lipid content of myelin (Norton and Cammer, 1984). To determine whether elevated levels of pERK1/2 in OLs increase myelin lipids, GalC species were quantified in the Plp-CreERT;Mek1DD/+ corpus callosum at 2 mpi. Total GalC (defined as the sum of the four most prevalent GalC species in the CNS; d18:1/22:1, d18:1/24:1, d18:1/22:0, and d18:1/24:0) was increased by 68.3 ± 12.5% (p = 0.007) in mutants compared with littermate controls. Separate analysis of each of the GalC species also revealed significant increases in d18:1/22:0, d18:1/22:1, and d18:1/24:1 (Fig. 3D).
Deletion of Erk1/2 from mature OLs of adult mice causes downregulation of myelin regulatory factor (Myrf), a master transcriptional regulator of myelin proteins, and ceramide UDP-galactosyltransferase (Cgt), an enzyme critical for GalC synthesis (Ishii et al., 2014). To determine whether sustained ERK1/2 activation upregulated Myrf and/or Cgt transcription, we performed qRT-PCR using cDNA from cortex and underlying corpus callosum of WT;Mek1DD/+ and Plp-CreERT;Mek1DD/+ mice at 2 mpi. Myrf and Cgt transcript levels were increased by 36.9 ± 6.5% (p = 0.04) and 122.5 ± 33.3% (p = 0.03), respectively, in Plp-CreERT;Mek1DD/+ mice (Fig. 3E). Because these transcriptional changes were observed at the relatively late time point of 2 mpi, we wondered whether Myrf and Cgt were likely to be direct targets of ERK1/2 or if they were simply upregulated as a secondary consequence of actively growing myelin sheaths. To address this question, transcript levels were quantified from corpus callosum using qRT-PCR 4 d after the last dose of tamoxifen (14 dpi). At this relatively early time point, Myrf mRNA levels were comparable in Plp-CreERT;Mek1DD/+ mice and control littermates, whereas Cgt transcript levels were increased by 47.8 ± 11.9% (p = 0.04; Fig. 3F). These data show that ERK1/2 activation in OLs of adult mice causes early and sustained increases in Cgt transcription, leading to increased production of the major myelin lipid GalC. The fact that changes in Myrf transcript levels were not detected at the early time point suggests that Myrf may not be a primary target of ERK1/2 signaling.
Plp-CreERT;Mek1DD/+ mice develop expanded paranodal regions but shorter nodes of Ranvier
Nodes of Ranvier along myelinated axons are small regions between individual myelin internodes where the axonal membrane and its clustered Na+ channels are exposed to the extracellular space. During myelin growth, the innermost tongue of the myelin sheath spirally wraps the axon, resulting in addition of new myelin layers with lateral-cytoplasm-containing edges. Each new layer then extends longitudinally, pushing the lateral cytoplasmic loops toward the edges of the myelin sheath until they finally align in a set of closely apposed paranodal loops (Snaidero et al., 2014). Therefore, we set out to determine whether the increased levels of pERK1/2 reinitiated myelin growth in mature OLs by driving the inner tongue forward, creating excess myelin wraps and additional paranodal loops. If this were true, then we would expect to find expanded paranodal regions in Plp-CreERT;Mek1DD/+ mice. Coronal brain sections of Plp-CreERT;Mek1DD/+ mice and littermate controls at 2 mpi were immunostained using antibodies against contactin-associated protein (CASPR) and Na+ channel 1.6 (NaV1.6) to visualize and then measure paranodal and nodal lengths, respectively, in the corpus callosum (Fig. 4A). CASPR immunostaining was significantly longer in Plp-CreERT;Mek1DD/+ mice compared with littermate controls (WT = 3.68 ± 0.05 μm, MUT = 3.87 ± 0.05 μm, p = 0.04; Fig. 4C), whereas NaV1.6 immunostaining was significantly shorter (WT = 1.14 ± 0.01 μm, MUT = 1.02 ± 0.02 μm, p = 0.02; Fig. 4D). The absolute number of nodes of Ranvier, however, was unchanged (WT = 87.8 ± 3.3, MUT = 83.4 ± 6.5, p = 0.60; Fig. 4B). These data suggest that the average internode length increases slightly in Plp-CreERT;Mek1DD/+ mice due to an expansion of the paranodal region, which is in contrast to the decrease in the length of myelin internodes produced by newly generated OLs in the adult CNS (Young et al., 2013). EM analysis of the paranodal regions in the corpus callosum demonstrated suitable adhesion between the innermost paranodal loops and the axolemma in mutant mice and did not reveal any notable ultrastructural abnormalities (Fig. 4E). These data indicate that sustained ERK1/2 activation in Plp-CreERT;Mek1DD/+ mice drives addition of new myelin wraps to existing sheaths, resulting in new paranodal loops that are appropriately anchored to the axon accompanied by concurrent shortening of the nodal region. Together, these changes result in an overall stable density of nodes.
Figure 4.
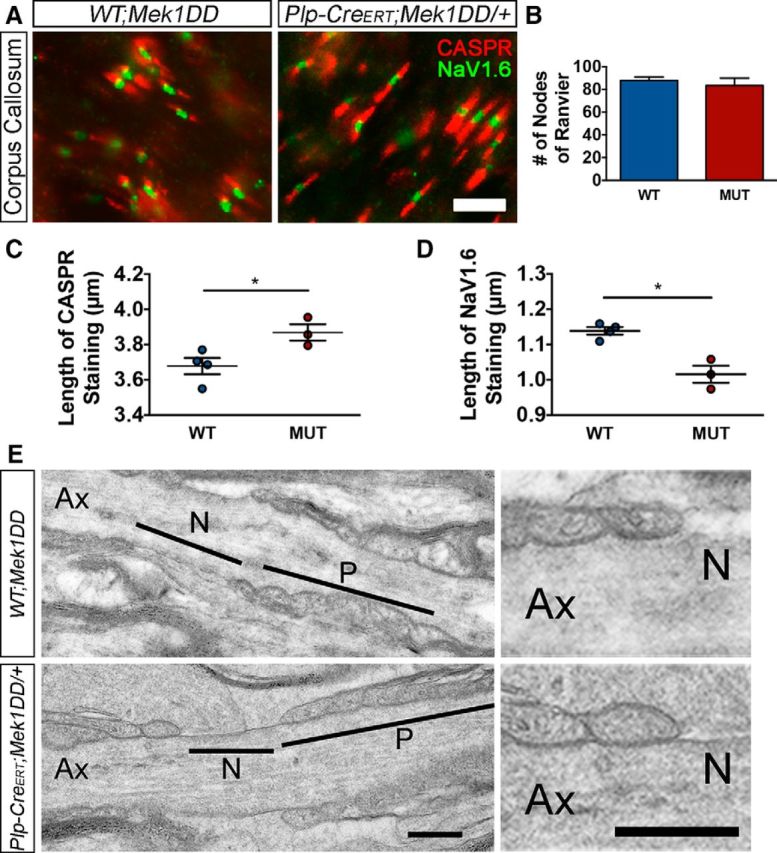
ERK1/2-mediated hypermyelination results in reciprocal changes to the length of the nodal and paranodal regions. A, CASPR (red) and NaV1.6 (green) immunostaining of matched sections of corpus callosum from WT;Mek1DD/+ (WT) and Plp-CreERT;Mek1DD/+ (MUT) littermates at 2 mpi. Scale bar, 5 μm. B, Quantification of the number of nodes of Ranvier demonstrates a comparable overall density of nodes in WT and MUT mice. C, Measurement of the length of CASPR staining indicates an increase in paranode length in MUT mice, whereas measurement of NaV1.6 staining (D) reveals a concurrent decrease in node length in MUT corpus callosum. E, High-magnification electron micrographs of representative paranodes from corpus callosum demonstrate a comparable ultrastructure of WT and MUT paranodes. Ax, Axon; N, node; P, paranode. Scale bars, 400 nm. *p < 0.05. Data are shown as mean ± SEM. At least three mice per genotype were used for all analyses; at least 100 nodes or paranodes per mouse were measured for length analysis.
ERK1/2-induced myelin expansion results in increased conduction velocity (CV)
We hypothesized that the increased myelin thickness, along with the changes in nodes of Ranvier, would lead to increased CV in Plp-CreERT;Mek1DD/+ mice. In particular, the observed shortening of the node length likely results in increased Na+ channel clustering, leading to changes in axonal membrane ion permeability that affect the speed of signal propagation (Arancibia-Carcamo and Attwell, 2014). Because temporal accuracy is particularly critical in the auditory system (Seidl, 2014), we chose to measure in vivo ABRs to obtain a sensitive, noninvasive measure of potential electrophysiologic differences in 2 mpi Plp-CreERT;Mek1DD/+ mice. Recording from five anatomical areas (I = auditory nerve, II = cochlear nucleus, III = cochlear nucleus/superior olivary complex, IV = lateral lemniscus, and V = inferior colliculus) along the auditory pathway uncovered a significant increase in CV in the CNS of Plp-CreERT;Mek1DD/+ mice (Fig. 5A). Recordings made after 80 dB click stimulation showed significant decreases in absolute latency to peaks II (WT = 2.08 ± 0.06 ms, MUT = 1.90 ± 0.05 ms, p = 0.03), III (WT = 2.91 ± 0.03 ms, MUT = 2.79 ± 0.02 ms, p = 0.002), and V (WT = 4.84 ± 0.08 ms, MUT = 4.59 ± 0.08 ms, p = 0.04) of the CNS, as visualized by a leftward shift for peaks II–V (corresponding to the CNS portions of the pathway; Fig. 5A,B). In addition, a significant decrease in the interpeak latency between peaks I and V was observed (WT = 3.56 ± 0.06 ms, MUT = 3.34 ± 0.07 ms, p = 0.02; Fig. 5C). These data provide evidence that ERK1/2-induced changes in myelin thickness have functional consequences because they result in increased CV in the adult CNS.
Figure 5.
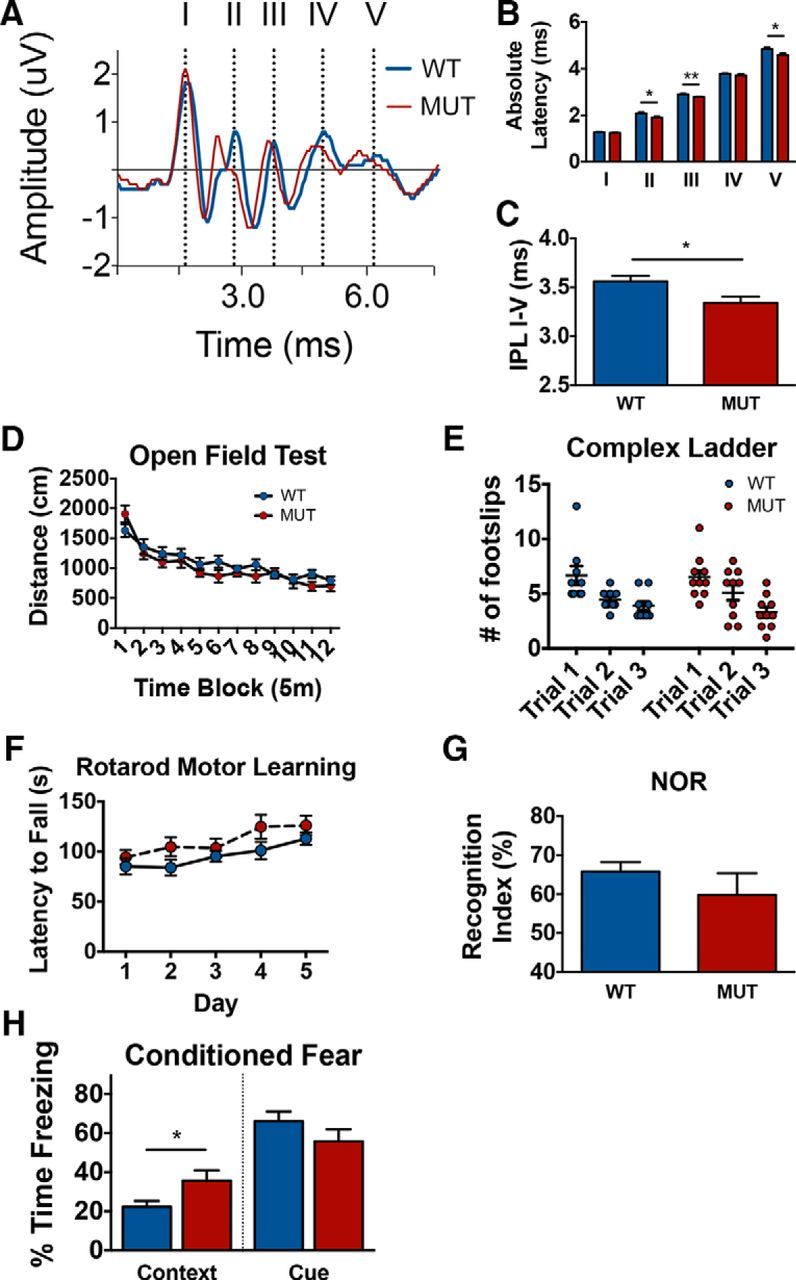
Plp-CreERT;Mek1DD/+ mice exhibit increased CV in the CNS that does not significantly affect motor function but does enhance specific forms of hippocampal-based learning. A, Average ABR traces from WT;Mek1DD/+ (WT, blue) and Plp-CreERT;Mek1DD/+ (MUT, red) mice at 2 mpi after 80 dB click stimulation show a visible leftward shift of the peaks in MUT mice, demonstrating increased conduction speed along axons. B, Quantification of results shown in A reveals a statistically significant decrease in the absolute latency to peaks II, III, and V of MUT (red) mice compared with WT (blue) controls. C, Interpeak latency after 16 kHz stimulation between peaks II–IV is also decreased in MUT (red) mice. D, Data from open-field test showing no differences in the distance (cm) traveled over blocks of time (5 min each) between WT (blue) and MUT (red) mice at 2 mpi. E, Complex ladder analysis shows no significant differences in the number of foot slips made by WT (blue) MUT (red) mice over three consecutive trials. F, Rotarod testing shows no differences between WT (blue) and MUT (red) mice in their latency to fall over the course of 5 training days, revealing no differences in motor coordination or learning. G, NOR testing shows no difference in percentage time exploring the novel object between WT (blue) and MUT (red) mice, suggesting no differences in novelty discrimination. H, Conditioned fear data showing no difference in percentage freezing between WT (blue) and MUT (red) mice in the cue trial, but indicating a significant difference in percentage freezing between WT and MUT mice in the context trial. **p < 0.01, *p < 0.05. Data are shown as mean ± SEM. Ten mice of each genotype were used for most analyses, including ABR trials; at least seven mice of each genotype were used for behavioral analyses.
ERK1/2-induced hypermyelination leads to enhanced hippocampal-dependent emotional learning
Temporal accuracy of neuronal communication is essential to ensure appropriate information processing (Gerstner et al., 1997). The global hypermyelination and enhanced CV in the CNS seen in Plp-CreERT;Mek1DD/+ mice might therefore improve learning and memory or motor skills. Alternatively, these changes might disrupt the delicate balance in signaling synchrony and lead to behavioral deficits. To address these possibilities, we performed behavioral tests focused on exploring both motor function and learning and memory. Plp-CreERT;Mek1DD/+ mice showed general activity levels that were comparable to littermate controls when measured in an open-field apparatus (Fig. 5D) and performed equally well as WT;Mek1DD/+ controls when scored on the wire-hang test (time hanging: WT = 44.7 ± 7.9 s, MUT = 40.0 ± 7.5 s, p = 0.67) and dowel-walk test (side touches: WT = 6 ± 0.61, MUT = 6.5 ± 0.5, p = 0.45). These data suggest that ERK1/2-induced hypermyelination does not affect motor strength or coordination. Mutant mice also did not exhibit differences in the number of foot slips when scored on a complex ladder task over the course of three consecutive trials, showing similar motor coordination and working memory to control mice (Fig. 5E). In addition, results from a motor learning accelerating rotarod assay did not reveal any significant differences between WT;Mek1DD/+ and Plp-CreERT;Mek1DD/+ mice in latency to fall on the initial day of testing (WT = 85.1 ± 8.1 s, MUT = 94.3 ± 7.2 s, p = 0.96) or over five days of training (day 5, WT = 112.9 ± 6.2 s, MUT = 126.1 ± 9.8 s, p = 0.83), indicating that mutant mice do not have altered motor coordination or learning (Fig. 5F).
Plp-CreERT;Mek1DD/+ mice were next examined using NOR, a classic memory test in which mice tend to spend a greater percentage of time exploring a novel object over a familiar object. Mutant mice were found to perform comparably to WT;Mek1DD/+ control littermates (Fig. 5G). To assess associative memory formation, we performed the conditioned fear test in WT;Mek1DD/+ and Plp-CreERT;Mek1DD/+ mice, in which a noxious stimulus (foot shock) is paired with a cue (tone) or with the surrounding context (environment). The successful association of these stimuli with the foot shock elicits a measurable fear freezing response from trained mice that are placed into the associated context or exposed to the associated cue 24 h later. Although mutant mice performed comparably to WT controls during the cue trial, a significant increase in freezing by Plp-CreERT;Mek1DD/+ mice was observed after they were placed into a conditioned environment, suggesting that they experienced increased hippocampal-dependent associative emotional memory formation (Fig. 5H).
Preexisting OLs with sustained activation of ERK1/2 contribute to remyelination
Several studies have demonstrated that mature, preexisting OLs do not normally contribute to myelin repair (Keirstead and Blakemore, 1997; Blakemore and Keirstead, 1999; Crawford et al., 2016). To determine whether forced activation of ERK1/2 in preexisting mature OLs enabled these cells to contribute to remyelination, we crossed Plp-CreERT;Mek1DD/+ mice to a membrane-bound GFP (mGFP) reporter strain (Hippenmeyer et al., 2005). Tamoxifen administered to ∼3-month-old Plp-CreERT;+/+;mGFP (control; CTRL) and Plp-CreERT;Mek1DD/+;mGFP (MUT) mice activated mGFP and Mek1DD expression in mutants and mGFP in control mice. Fourteen days later, demyelination was induced via LPC injection into the dorsal column of the thoracic spinal cord. This strategy enabled us to visualize and identify new myelin generated by prelabeled surviving OLs after a demyelinating lesion. At 2 dpl, both genotypes exhibited comparable lesions with very little mGFP or MBP immunoreactivity within the lesion, indicating a similar loss of preexisting myelin (Fig. 6A,B). Small areas of mGFP and MBP immunoreactivity remained in mice of both genotypes, likely due to incomplete clearance of myelin debris at this early time point. In support of previous work showing that enhanced activation of ERK1/2 in oligodendrocytes does not alter OL survival after LPC-induced demyelination (Fyffe-Maricich et al., 2013), we found similar numbers of oligodendrocyte lineage transcription factor 2 (OLIG2)+ cells in the lesioned dorsal column at 2 dpl (CTRL = 64.78 ± 14.09, MUT = 67 ± 13.09, p = 0.91; Fig. 6C,D). To investigate whether there were changes in OPC proliferation in response to injury in the mutant mice, we administered the thymidine analog EdU to mice at 1 and 2 dpl before killing, thereby labeling cycling cells across this time period via its incorporation into DNA during replication. We found that the percentage of EdU+ OLIG2+ cells in the lesioned dorsal column did not differ between Plp-CreERT;+/+;mGFP and Plp-CreERT;Mek1DD/+;mGFP mice (CTRL = 19.77 ± 0.84%, MUT = 25.04 ± 3.88%, p = 0.31; Fig. 6C,E), indicating no significant differences in OPC proliferation, which is similar to what has been reported previously in CNP-Cre; Mek1DD mice at 2dpl (Fyffe-Maricich et al., 2013). In agreement with previous work showing that preexisting OLs do not contribute to repair in wild-type mice (Crawford et al., 2016), Plp-CreERT;+/+;mGFP control mice exhibited very little mGFP+ myelin in the lesioned area at 42 dpl, when remyelination is virtually complete (Fig. 7A,B, left). In contrast, Plp-CreERT;Mek1DD/+;mGFP mice showed a dramatic increase in GFP+ immunoreactivity in the previously demyelinated area, particularly around the edges of the lesion (Fig. 7A,B, right). Small amounts of mGFP immunoreactivity were occasionally seen scattered throughout the lesion in control mice (Fig. 7D) because the Plp promoter is expressed in ∼5% of OPCs in adult mice that are >3 months old (Guo et al., 2010). Therefore, a very small fraction of myelin from newly generated OLs is seen as green in both control and mutant mice. When mGFP+ regions in Plp-CreERT;Mek1DD/+;mGFP mice were examined at a higher magnification, colocalization of mGFP and MBP was apparent in rings around axons (Fig. 7D), suggesting that the sustained activation of ERK1/2 in preexisting mature OLs enables them to contribute to remyelination. Areas of MBP+ but mGFP− myelin rings in the Plp-CreERT;Mek1DD/+;mGFP mice (particularly near the center of the lesion), however, demonstrate that, even though preexisting OLs contributed to remyelination, a significant amount of myelin was still produced by newly generated OLs. Together, these data indicate that the sustained activation of ERK1/2 is sufficient to enable preexisting OLs to extend processes into lesioned areas and contribute to myelin repair by wrapping axons.
Figure 6.
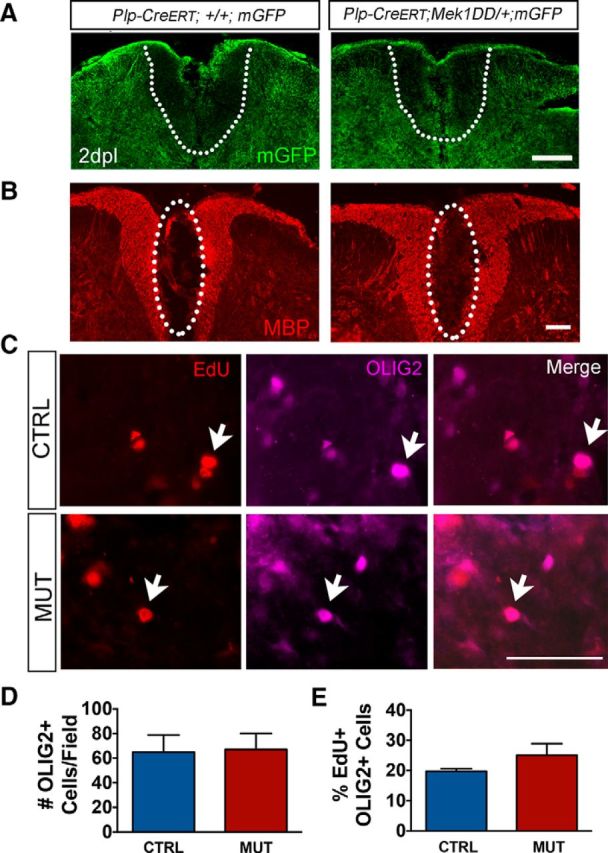
Sustained activation of ERK1/2 in mature oligodendrocytes does not alter the immediate consequences of toxin-induced demyelination. A, Immunostaining with antibodies against mGFP at 2 dpl indicates a loss of preexisting myelin (demyelination) leading to a lesioned area within the dorsal column of the spinal cord (SC). Scale bar, 100 μm. Dotted lines demarcate the dorsal column. B, MBP immunostaining at 2 dpl confirms an equivalent demyelinated area in the dorsal column of the SC in Plp-CreERT;+/+;mGFP and Plp-CreERT;Mek1DD/+;mGFP mice. Scale bar, 100 μm. Dotted elliptical demarcates the lesioned area. C, Colabeling the lesioned dorsal column with EdU and OLIG2 reveals EdU+, OLIG2+-colabeled cells. Scale bar, 50 μm. D, E, Sustained activation of ERK1/2 in OLs does not lead to a change in the total number of OLIG2+ cells or in the percentage of EdU+, OLIG2+-colabeled cells divided by the total number of OLIG2+ cells at 2 dpl, revealing no differences in OL survival or OPC proliferation between Plp-CreERT;+/+;mGFP (blue) and Plp-CreERT;Mek1DD/+;mGFP (red) mice. Three to five mice per genotype were used for all analyses.
Figure 7.
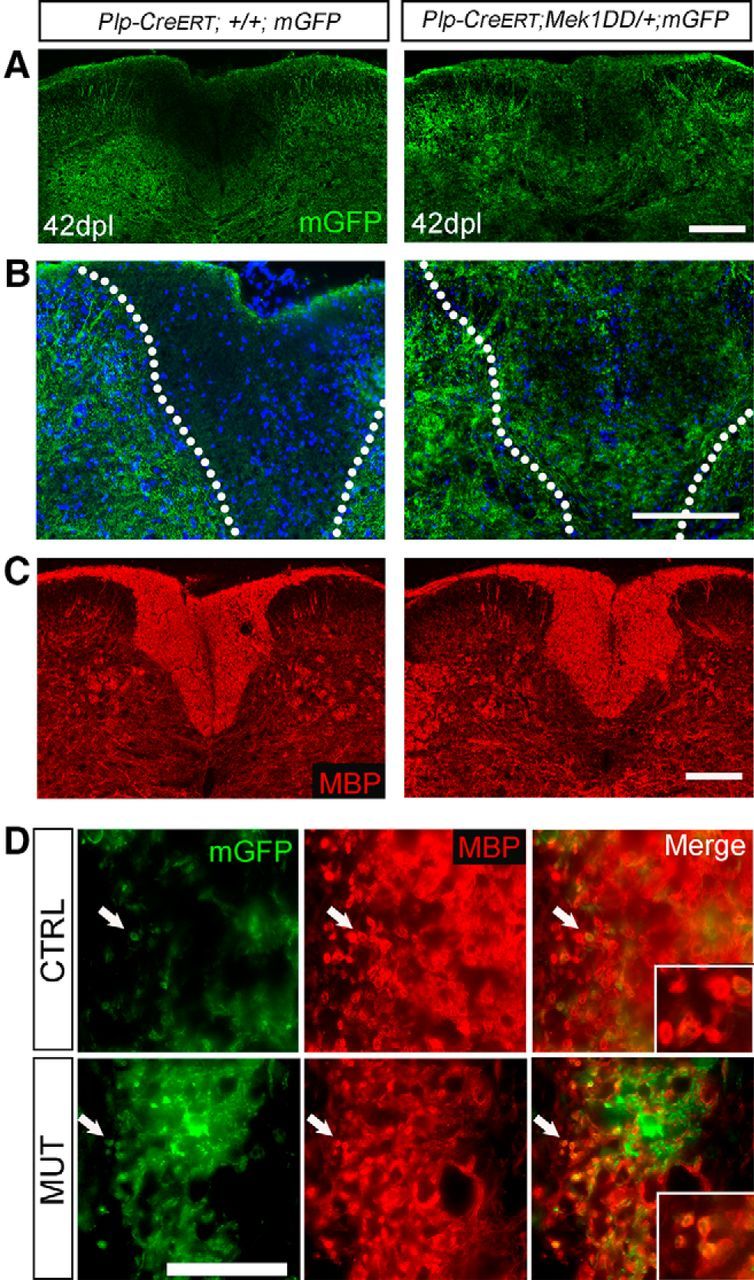
Sustained activation of ERK1/2 in preexisting mature oligodendrocytes enables them to contribute to remyelination after toxin-induced demyelination. A, At 42 dpl, control mice exhibit no visible mGFP+ process extension into the lesioned area, whereas Plp-CreERT;Mek1DD/+;mGFP mice show considerable mGFP+ process extension by preexisting OLs into the previously demyelinated area. Scale bar, 100 μm. B, Higher-magnification images of 42 dpl mGFP immunostaining further exemplifies data seen in A. DAPI marks cell nuclei in blue. Scale bar, 100 μm. Dorsal column is demarcated by dotted lines. C, MBP immunostaining at 42 dpl indicates complete remyelination in both Plp-CreERT;+/+;mGFP and Plp-CreERT;Mek1DD/+;mGFP spinal cord dorsal columns. Scale bar, 100 μm. D, MUT mice exhibit mGFP+ process extension into the lesioned area with nearby axons surrounded by MBP+, mGFP+ rings indicated by arrows (also see inset panels); these appear rarely in WT controls. Scale bar, 50 μm. Three to five mice per genotype were used for all analyses.
Discussion
Synaptic plasticity and integration require that action potential arrival times occur with millisecond precision (Dan and Poo, 2006), so the regulation of conduction time is a critical variable for the formation and maintenance of important neuronal networks. Myelin greatly affects the speed of action potential propagation, promoting recent attention to how changes in myelin may contribute to nervous system plasticity, cognitive processing, and learning (recently reviewed by Chang et al., 2016 and Fields, 2015). Although it is widely accepted that newly differentiated OLs contribute to myelin plasticity and repair, whether preexisting OLs can also lead to functional changes in both the injured and uninjured adult CNS remains unknown. In this study, we used transgenic mice with sustained activation of ERK1/2 in mature OLs to demonstrate that preexisting OLs can reinitiate active myelination in the adult CNS, resulting in increased CV that leads to enhanced contextual fear learning and contributes to remyelination.
Increased levels of pERK1/2 trigger myelin growth that results in global CNS hypermyelination. We determined that this hypermyelination was mediated primarily by preexisting OLs because increasing pERK1/2 in adult OPCs, but not preexisting OLs, did not lead to white matter expansion. Interestingly, the majority of myelin growth occurs within the first 21 d after ERK1/2 activation and the accompanying white matter expansion is more robust in the spinal cord compared with the corpus callosum. Myelin thickness continues to increase over time, but does so at such a slow rate that, even after 2–3 months, the modest accumulation of myelin does not appear to become pathologic. These data are in contrast to the excessive myelin overgrowth and abnormalities observed in transgenic mice that overexpress AKT (Flores et al., 2008), lack PTEN (Harrington et al., 2010), or overactivate MAPK signaling in the peripheral nervous system (Sheean et al., 2014). It is possible that inhibitory factors such as phosphatases provide continuous negative regulation of ERK1/2 signaling by counteracting the effects of constitutively active MEK1; further studies are needed to address this issue.
Re-initiation of myelination seen in adult Plp-CreERT;Mek1DD/+ mice supports the earlier finding that myelin growth can be reactivated experimentally in adult mice by conditionally deleting PTEN to activate PI3K/AKT signaling (Goebbels et al., 2010). How is it that new myelin membrane can be added to previously formed sheaths? Recent studies show that an elaborate system of cytoplasmic channels exists within the growing myelin sheath to enable the trafficking of newly synthesized myelin membrane components to the leading edge of the expanding sheath (Snaidero et al., 2014). Importantly, these channels are dynamic and can reopen during adulthood in response to PI3K activation, along with elevated levels of its lipid product, phosphatidyl inositol triphosphate [PI(3,4,5)P3; Snaidero et al., 2014]. In addition, new myelin growth appears to be driven from the inner tongue as a result of actin cytoskeleton rearrangement (Snaidero et al., 2014; Zuchero et al., 2015) and it has been hypothesized that the release of gelsolin and cofilin from membrane-bound PIP2 triggers the actin depolymerization necessary for myelin wrapping (Zuchero et al., 2015). It is possible that ERK1/2 signaling similarly drives myelin wrapping through the regulation of actin dynamics. Furthermore, the parallel consequences of upregulating or downregulating PI3K/AKT/mTOR and ERK1/2 signaling pathways on myelination during development (Flores et al., 2008; Goebbels et al., 2010; Ishii et al., 2012; Ishii et al., 2013; Bercury et al., 2014; Lebrun-Julien et al., 2014; Wahl et al., 2014) suggests significant crosstalk between these two pathways (Dai et al., 2014; Gaesser and Fyffe-Maricich, 2016). Although the mechanisms behind how ERK1/2 drives myelin wrapping remain unclear, it seems likely that this pathway acts in conjunction with PI3K/AKT/mTOR signaling at multiple points of convergence to regulate myelination. The specific mechanisms and downstream targets of ERK1/2 that control myelin wrapping represent important areas for future research.
New findings suggest that myelin abnormalities occur in a variety of psychiatric illnesses and neurodevelopmental disorders such as autism, implicating myelin in cognitive function (Fields, 2008; Liu et al., 2012; Makinodan et al., 2012). The correlation of myelin abnormalities with cognitive deficits in these diseases, however, is complicated by the fact that significant primary neuronal dysfunction occurs concurrently. Here, our genetic mouse model of ERK1/2-mediated hypermyelination provided a unique opportunity to assess the consequences of primary increases in myelin thickness on mouse behavior in the absence of significant neuronal pathology. Cognitive function testing using the NOR revealed that mutants performed comparably to control littermates. NOR is an established test of recognition memory involving the hippocampus and portions of the medial temporal lobe such as the perirhinal cortex and parahippocampal gyrus (Antunes and Biala, 2012). Short-term retention intervals similar to what we used in this study are thought to involve primarily hippocampal-independent mechanisms of recognition (Hammond et al., 2004; Balderas et al., 2008; Oliveira et al., 2010). Therefore, our data suggest that hippocampal-independent recognition memory is unaffected by ERK1/2-induced hypermyelination. Conditioned fear testing focuses on long-term learning and memory based in the hippocampus and amygdala and relies on the association of a cue or environment with a noxious stimulus (foot shock; Phillips and LeDoux, 1992). Interestingly, the conditioned freezing response is known to depend on activity-dependent plasticity mechanisms (Fanselow and Kim, 1994; Maren et al., 2003; Sindreu et al., 2007; Rozeske et al., 2015). Plp-CreERT;Mek1DD/+ mice did not exhibit changes in freezing during the cue trial, indicating no abnormalities in memory formation involving the amygdala. However, in the context trial, which relies heavily on hippocampal-based memory formation (Sanders et al., 2003), mutant mice exhibited significantly increased freezing, suggesting that hippocampal-based emotional memory is enhanced in mice with ERK1/2-induced hypermyelination. Future studies will address why the hippocampus seems to be more sensitive to increased myelination compared with other structures. Additional experiments investigating the consequences of hypermyelination on more complex behaviors such as social interaction, anxiety, and depression are currently under way.
Surprisingly, Plp-CreERT;Mek1DD/+ mice did not exhibit changes in general activity or motor coordination and strength despite a significant expansion of the spinal cord white matter. Together, the results from our behavioral analyses demonstrate that subtle global hypermyelination does not lead to obvious motor or cognitive deficits. Despite increased myelin thickness and accompanied faster conduction speeds, it seems that the synchronicity of impulses was not sufficiently altered to affect a number of behaviors negatively in Plp-CreERT;Mek1DD/+ mice. These data are in contrast to the detrimental effects that occur after the loss of myelin, including deficits in motor function, social behavior, and cognitive function (Kujala et al., 1997; Gootjes et al., 2004; Fields, 2008; Liu et al., 2012; Makinodan et al., 2012; Ishii et al., 2014). The fact that the CNS appears to be somewhat tolerant of global increases in myelin thickness is promising from a therapeutic standpoint. For example, in patients with multiple sclerosis, demyelinated lesions appear throughout the CNS and are variable in their location. Without invasive brain surgery, even specialized small-molecule therapeutics targeting the OL population would inevitably lead to new myelin production in both affected and unaffected areas throughout the CNS.
In addition to positive effects on associative emotional memory formation, the ability to reinitiate myelination appears beneficial in the context of demyelinating injury. We show that preexisting OLs do not normally contribute to remyelination, a finding that agrees with data from a number of previous studies (Gensert and Goldman, 1997; Keirstead and Blakemore, 1997; Carroll et al., 1998; Blakemore and Keirstead, 1999; Crawford et al., 2016), but that sustained ERK1/2 activation enables them to extend process into the lesion area and contribute to remyelination. Studies are currently under way to determine whether these MBP+, mGFP+ wraps contribute in a functional way to the process of myelin repair. Although surviving OLs in Plp-CreERT;Mek1DD/+;mGFP mice were clearly able to extend processes that surround axons within the area of demyelination, a large number of remyelinated axons were covered by MBP+, mGFP− wraps (particularly in the center of the lesioned area where preexisting OLs do not survive), demonstrating that they were generated by newly generated OLs. This suggests that myelin generated solely by preexisting OLs is unlikely to be sufficient for complete remyelination and that any strategy designed to harness the potential of these preexisting cells should also aim to target newly generated OLs. Fortunately, CNP-Cre;Mek1DD mice, which have increased levels of pERK1/2 in both preexisting and newly generated OLs, show accelerated myelin repair after injury and are able to generate thick myelin sheaths around remyelinated axons (Fyffe-Maricich et al., 2013). In light of our observations here, it is tempting to speculate that myelin generated by both preexisting and newly born OLs contributed to the enhanced myelin repair seen in CNP-Cre;Mek1DD mice.
In summary, our results illuminate the potential of downstream effectors in the ERK1/2 signaling pathway as novel therapeutic targets for enhancing myelin plasticity and myelin repair in a broad range of neural disorders. Future work will focus on determining these key OL-specific ERK1/2 downstream targets.
Footnotes
This work was supported by the National Institutes of Health (Grant 1S10OD016236-01 to the Center for Biologic Imaging at the University of Pittsburgh, a National Multiple Sclerosis Society Career-Transition Fellowship to S.F-M., Grant R01 NS091084 to S.F.-M., and National Institute on Deafness and Other Communication Disorders Grant 013048 to M.R.) We thank Mara Sullivan and the Center for Biologic Imaging at University of Pittsburgh for assistance in obtaining transmission EM sections and images; Laura Miller, Edda Thiels, and the Rodent Behavioral Analysis Core at the University of Pittsburgh for assistance in performing behavior tests and analyzing data; Luther Loose and Shil Patel for technical assistance in experiments; and Stephen Maricich, Jenna Gaesser, and Lilly Laemmle for helpful discussions and comments on this manuscript.
The authors declare no competing financial interests.
References
- Antunes M, Biala G. The novel object recognition memory: neurobiology, test procedure, and its modifications. Cogn Process. 2012;13:93–110. doi: 10.1007/s10339-011-0430-z. [DOI] [PMC free article] [PubMed] [Google Scholar]
- Arancibia-Carcamo IL, Attwell D. The node of Ranvier in CNS pathology. Acta Neuropathol. 2014;128:161–175. doi: 10.1007/s00401-014-1305-z. [DOI] [PMC free article] [PubMed] [Google Scholar]
- Balderas I, Rodriguez-Ortiz CJ, Salgado-Tonda P, Chavez-Hurtado J, McGaugh JL, Bermudez-Rattoni F. The consolidation of object and context recognition memory involve different regions of the temporal lobe. Learn Mem. 2008;15:618–624. doi: 10.1101/lm.1028008. [DOI] [PMC free article] [PubMed] [Google Scholar]
- Bartsch S, Montag D, Schachner M, Bartsch U. Increased number of unmyelinated axons in optic nerves of adult mice deficient in the myelin-associated glycoprotein (MAG) Brain Res. 1997;762:231–234. doi: 10.1016/S0006-8993(97)00484-8. [DOI] [PubMed] [Google Scholar]
- Bengtsson SL, Nagy Z, Skare S, Forsman L, Forssberg H, Ullén F. Extensive piano practicing has regionally specific effects on white matter development. Nat Neurosci. 2005;8:1148–1150. doi: 10.1038/nn1516. [DOI] [PubMed] [Google Scholar]
- Bercury KK, Dai J, Sachs HH, Ahrendsen JT, Wood TL, Macklin WB. Conditional ablation of raptor or rictor has differential impact on oligodendrocyte differentiation and CNS myelination. J Neurosci. 2014;34:4466–4480. doi: 10.1523/JNEUROSCI.4314-13.2014. [DOI] [PMC free article] [PubMed] [Google Scholar]
- Blakemore WF, Keirstead HS. The origin of remyelinating cells in the central nervous system. J Neuroimmunol. 1999;98:69–76. doi: 10.1016/S0165-5728(99)00083-1. [DOI] [PubMed] [Google Scholar]
- Carroll WM, Jennings AR, Ironside LJ. Identification of the adult resting progenitor cell by autoradiographic tracking of oligodendrocyte precursors in experimental CNS demyelination. Brain. 1998;121:293–302. doi: 10.1093/brain/121.2.293. [DOI] [PubMed] [Google Scholar]
- Chang A, Tourtellotte WW, Rudick R, Trapp BD. Premyelinating oligodendrocytes in chronic lesions of multiple sclerosis. N Engl J Med. 2002;346:165–173. doi: 10.1056/NEJMoa010994. [DOI] [PubMed] [Google Scholar]
- Chang KJ, Redmond SA, Chan JR. Remodeling myelination: implications for mechanisms of neural plasticity. Nat Neurosci. 2016;19:190–197. doi: 10.1038/nn.4200. [DOI] [PMC free article] [PubMed] [Google Scholar]
- Crawford AH, Tripathi RB, Foerster S, McKenzie I, Kougioumtzidou E, Grist M, Richardson WD, Franklin RJ. Preexisting mature oligodendrocytes do not contribute to remyelination following toxin-induced spinal cord demyelination. Am J Pathol. 2016;186:511–516. doi: 10.1016/j.ajpath.2015.11.005. [DOI] [PMC free article] [PubMed] [Google Scholar]
- Dai J, Bercury KK, Macklin WB. Interaction of mTOR and Erk1/2 signaling to regulate oligodendrocyte differentiation. Glia. 2014;62:2096–2109. doi: 10.1002/glia.22729. [DOI] [PMC free article] [PubMed] [Google Scholar]
- Dan Y, Poo MM. Spike timing-dependent plasticity: from synapse to perception. Physiol Rev. 2006;86:1033–1048. doi: 10.1152/physrev.00030.2005. [DOI] [PubMed] [Google Scholar]
- Dangata YY, Kaufman MH. Myelinogenesis in the optic nerve of (C57BL x CBA) F1 hybrid mice: a morphometric analysis. Eur J Morphol. 1997;35:3–17. doi: 10.1076/ejom.35.1.3.13057. [DOI] [PubMed] [Google Scholar]
- Dawson MR, Polito A, Levine JM, Reynolds R. NG2-expressing glial progenitor cells: an abundant and widespread population of cycling cells in the adult rat CNS. Mol Cell Neurosci. 2003;24:476–488. doi: 10.1016/S1044-7431(03)00210-0. [DOI] [PubMed] [Google Scholar]
- Demerens C, Stankoff B, Logak M, Anglade P, Allinquant B, Couraud F, Zalc B, Lubetzki C. Induction of myelination in the central nervous system by electrical activity. Proc Natl Acad Sci U S A. 1996;93:9887–9892. doi: 10.1073/pnas.93.18.9887. [DOI] [PMC free article] [PubMed] [Google Scholar]
- Dimou L, Simon C, Kirchhoff F, Takebayashi H, Götz M. Progeny of Olig2-expressing progenitors in the gray and white matter of the adult mouse cerebral cortex. J Neurosci. 2008;28:10434–10442. doi: 10.1523/JNEUROSCI.2831-08.2008. [DOI] [PMC free article] [PubMed] [Google Scholar]
- Doerflinger NH, Macklin WB, Popko B. Inducible site-specific recombination in myelinating cells. Genesis. 2003;35:63–72. doi: 10.1002/gene.10154. [DOI] [PubMed] [Google Scholar]
- Fancy SP, Zhao C, Franklin RJ. Increased expression of Nkx2.2 and Olig2 identifies reactive oligodendrocyte progenitor cells responding to demyelination in the adult CNS. Mol Cell Neurosci. 2004;27:247–254. doi: 10.1016/j.mcn.2004.06.015. [DOI] [PubMed] [Google Scholar]
- Fanselow MS, Kim JJ. Acquisition of contextual Pavlovian fear conditioning is blocked by application of an NMDA receptor antagonist D, L-2-amino-5-phosphonovaleric acid to the basolateral amygdala. Behav Neurosci. 1994;108:210–212. doi: 10.1037/0735-7044.108.1.210. [DOI] [PubMed] [Google Scholar]
- Farr TD, Liu L, Colwell KL, Whishaw IQ, Metz GA. Bilateral alteration in stepping pattern after unilateral motor cortex injury: a new test strategy for analysis of skilled limb movements in neurological mouse models. J Neurosci Methods. 2006;153:104–113. doi: 10.1016/j.jneumeth.2005.10.011. [DOI] [PubMed] [Google Scholar]
- Fields RD. White matter in learning, cognition and psychiatric disorders. Trends Neurosci. 2008;31:361–370. doi: 10.1016/j.tins.2008.04.001. [DOI] [PMC free article] [PubMed] [Google Scholar]
- Fields RD. A new mechanism of nervous system plasticity: activity-dependent myelination. Nat Rev Neurosci. 2015;16:756–767. doi: 10.1038/nrn4023. [DOI] [PMC free article] [PubMed] [Google Scholar]
- Flores AI, Narayanan SP, Morse EN, Shick HE, Yin X, Kidd G, Avila RL, Kirschner DA, Macklin WB. Constitutively active Akt induces enhanced myelination in the CNS. J Neurosci. 2008;28:7174–7183. doi: 10.1523/JNEUROSCI.0150-08.2008. [DOI] [PMC free article] [PubMed] [Google Scholar]
- Fyffe-Maricich SL, Schott A, Karl M, Krasno J, Miller RH. Signaling through ERK1/2 controls myelin thickness during myelin repair in the adult central nervous system. J Neurosci. 2013;33:18402–18408. doi: 10.1523/JNEUROSCI.2381-13.2013. [DOI] [PMC free article] [PubMed] [Google Scholar]
- Gaesser JM, Fyffe-Maricich SL. Intracellular signaling pathway regulation of myelination and remyelination in the CNS. Exp Neurol. 2016 doi: 10.1016/j.expneurol.2016.03.008. In press. [DOI] [PMC free article] [PubMed] [Google Scholar]
- Gensert JM, Goldman JE. Endogenous progenitors remyelinate demyelinated axons in the adult CNS. Neuron. 1997;19:197–203. doi: 10.1016/S0896-6273(00)80359-1. [DOI] [PubMed] [Google Scholar]
- Gerstner W, Kreiter AK, Markram H, Herz AV. Neural codes: firing rates and beyond. Proc Natl Acad Sci U S A. 1997;94:12740–12741. doi: 10.1073/pnas.94.24.12740. [DOI] [PMC free article] [PubMed] [Google Scholar]
- Goebbels S, Oltrogge JH, Kemper R, Heilmann I, Bormuth I, Wolfer S, Wichert SP, Möbius W, Liu X, Lappe-Siefke C, Rossner MJ, Groszer M, Suter U, Frahm J, Boretius S, Nave KA. Elevated phosphatidylinositol 3,4,5-trisphosphate in glia triggers cell-autonomous membrane wrapping and myelination. J Neurosci. 2010;30:8953–8964. doi: 10.1523/JNEUROSCI.0219-10.2010. [DOI] [PMC free article] [PubMed] [Google Scholar]
- Gootjes L, Teipel SJ, Zebuhr Y, Schwarz R, Leinsinger G, Scheltens P, Möller HJ, Hampel H. Regional distribution of white matter hyperintensities in vascular dementia, Alzheimer's disease and healthy aging. Dement Geriatr Cogn Disord. 2004;18:180–188. doi: 10.1159/000079199. [DOI] [PubMed] [Google Scholar]
- Guo F, Maeda Y, Ma J, Xu J, Horiuchi M, Miers L, Vaccarino F, Pleasure D. Pyramidal neurons are generated from oligodendroglial progenitor cells in adult piriform cortex. J Neurosci. 2010;30:12036–12049. doi: 10.1523/JNEUROSCI.1360-10.2010. [DOI] [PMC free article] [PubMed] [Google Scholar]
- Hammond RS, Tull LE, Stackman RW. On the delay-dependent involvement of the hippocampus in object recognition memory. Neurobiol Learn Mem. 2004;82:26–34. doi: 10.1016/j.nlm.2004.03.005. [DOI] [PubMed] [Google Scholar]
- Harrington EP, Zhao C, Fancy SP, Kaing S, Franklin RJ, Rowitch DH. Oligodendrocyte PTEN is required for myelin and axonal integrity, not remyelination. Ann Neurol. 2010;68:703–716. doi: 10.1002/ana.22090. [DOI] [PMC free article] [PubMed] [Google Scholar]
- Hippenmeyer S, Vrieseling E, Sigrist M, Portmann T, Laengle C, Ladle DR, Arber S. A developmental switch in the response of DRG neurons to ETS transcription factor signaling. PLoS Biol. 2005;3:e159. doi: 10.1371/journal.pbio.0030159. [DOI] [PMC free article] [PubMed] [Google Scholar]
- Honjin R, Sakato S, Yamashita T. Electron microscopy of the mouse optic nerve: a quantitative study of the total optic nerve fibers. Arch Histol Jpn. 1977;40:321–332. doi: 10.1679/aohc1950.40.321. [DOI] [PubMed] [Google Scholar]
- Ishii A, Fyffe-Maricich SL, Furusho M, Miller RH, Bansal R. ERK1/ERK2 MAPK signaling is required to increase myelin thickness independent of oligodendrocyte differentiation and initiation of myelination. J Neurosci. 2012;32:8855–8864. doi: 10.1523/JNEUROSCI.0137-12.2012. [DOI] [PMC free article] [PubMed] [Google Scholar]
- Ishii A, Furusho M, Bansal R. Sustained activation of ERK1/2 MAPK in oligodendrocytes and schwann cells enhances myelin growth and stimulates oligodendrocyte progenitor expansion. J Neurosci. 2013;33:175–186. doi: 10.1523/JNEUROSCI.4403-12.2013. [DOI] [PMC free article] [PubMed] [Google Scholar]
- Ishii A, Furusho M, Dupree JL, Bansal R. Role of ERK1/2 MAPK signaling in the maintenance of myelin and axonal integrity in the adult CNS. J Neurosci. 2014;34:16031–16045. doi: 10.1523/JNEUROSCI.3360-14.2014. [DOI] [PMC free article] [PubMed] [Google Scholar]
- Kang SH, Fukaya M, Yang JK, Rothstein JD, Bergles DE. NG2+ CNS glial progenitors remain committed to the oligodendrocyte lineage in postnatal life and following neurodegeneration. Neuron. 2010;68:668–681. doi: 10.1016/j.neuron.2010.09.009. [DOI] [PMC free article] [PubMed] [Google Scholar]
- Keirstead HS, Blakemore WF. Identification of post-mitotic oligodendrocytes incapable of remyelination within the demyelinated adult spinal cord. J Neuropathol Exp Neurol. 1997;56:1191–1201. doi: 10.1097/00005072-199711000-00003. [DOI] [PubMed] [Google Scholar]
- Kujala P, Portin R, Ruutiainen J. The progress of cognitive decline in multiple sclerosis: a controlled 3-year follow-up. Brain. 1997;120:289–297. doi: 10.1093/brain/120.2.289. [DOI] [PubMed] [Google Scholar]
- Lebrun-Julien F, Bachmann L, Norrmén C, Trötzmüller M, Köfeler H, Rüegg MA, Hall MN, Suter U. Balanced mTORC1 activity in oligodendrocytes is required for accurate CNS myelination. J Neurosci. 2014;34:8432–8448. doi: 10.1523/JNEUROSCI.1105-14.2014. [DOI] [PMC free article] [PubMed] [Google Scholar]
- Liu J, Dietz K, DeLoyht JM, Pedre X, Kelkar D, Kaur J, Vialou V, Lobo MK, Dietz DM, Nestler EJ, Dupree J, Casaccia P. Impaired adult myelination in the prefrontal cortex of socially isolated mice. Nat Neurosci. 2012;15:1621–1623. doi: 10.1038/nn.3263. [DOI] [PMC free article] [PubMed] [Google Scholar]
- Makinodan M, Rosen KM, Ito S, Corfas G. A critical period for social experience-dependent oligodendrocyte maturation and myelination. Science. 2012;337:1357–1360. doi: 10.1126/science.1220845. [DOI] [PMC free article] [PubMed] [Google Scholar]
- Maren S, Ferrario CR, Corcoran KA, Desmond TJ, Frey KA. Protein synthesis in the amygdala, but not the auditory thalamus, is required for consolidation of Pavlovian fear conditioning in rats. Eur J Neurosci. 2003;18:3080–3088. doi: 10.1111/j.1460-9568.2003.03063.x. [DOI] [PubMed] [Google Scholar]
- McKenzie IA, Ohayon D, Li H, de Faria JP, Emery B, Tohyama K, Richardson WD. Motor skill learning requires active central myelination. Science. 2014;346:318–322. doi: 10.1126/science.1254960. [DOI] [PMC free article] [PubMed] [Google Scholar]
- Michel K, Zhao T, Karl M, Lewis K, Fyffe-Maricich SL. Translational control of myelin basic protein expression by ERK2 MAP kinase regulates timely remyelination in the adult brain. J Neurosci. 2015;35:7850–7865. doi: 10.1523/JNEUROSCI.4380-14.2015. [DOI] [PMC free article] [PubMed] [Google Scholar]
- Norton WT, Cammer W. Isolation and characterization of myelin. In: Morell P, editor. Myelin. New York: Springer; 1984. pp. 147–195. [Google Scholar]
- Oliveira AM, Hawk JD, Abel T, Havekes R. Post-training reversible inactivation of the hippocampus enhances novel object recognition memory. Learn Mem. 2010;17:155–160. doi: 10.1101/lm.1625310. [DOI] [PMC free article] [PubMed] [Google Scholar]
- Phillips RG, LeDoux JE. Differential contribution of amygdala and hippocampus to cued and contextual fear conditioning. Behav Neurosci. 1992;106:274–285. doi: 10.1037/0735-7044.106.2.274. [DOI] [PubMed] [Google Scholar]
- Psachoulia K, Jamen F, Young KM, Richardson WD. Cell cycle dynamics of NG2 cells in the postnatal and ageing brain. Neuron Glia Biol. 2009;5:57–67. doi: 10.1017/S1740925X09990354. [DOI] [PMC free article] [PubMed] [Google Scholar]
- Rivers LE, Young KM, Rizzi M, Jamen F, Psachoulia K, Wade A, Kessaris N, Richardson WD. PDGFRA/NG2 glia generate myelinating oligodendrocytes and piriform projection neurons in adult mice. Nat Neurosci. 2008;11:1392–1401. doi: 10.1038/nn.2220. [DOI] [PMC free article] [PubMed] [Google Scholar]
- Rozeske RR, Valerio S, Chaudun F, Herry C. Prefrontal neuronal circuits of contextual fear conditioning. Genes Brain Behav. 2015;14:22–36. doi: 10.1111/gbb.12181. [DOI] [PubMed] [Google Scholar]
- Sanders MJ, Wiltgen BJ, Fanselow MS. The place of the hippocampus in fear conditioning. Eur J Pharmacol. 2003;463:217–223. doi: 10.1016/S0014-2999(03)01283-4. [DOI] [PubMed] [Google Scholar]
- Schlegel AA, Rudelson JJ, Tse PU. White matter structure changes as adults learn a second language. J Cogn Neurosci. 2012;24:1664–1670. doi: 10.1162/jocn_a_00240. [DOI] [PubMed] [Google Scholar]
- Scholz J, Klein MC, Behrens TE, Johansen-Berg H. Training induces changes in white-matter architecture. Nat Neurosci. 2009;12:1370–1371. doi: 10.1038/nn.2412. [DOI] [PMC free article] [PubMed] [Google Scholar]
- Seidl AH. Regulation of conduction time along axons. Neuroscience. 2014;276:126–134. doi: 10.1016/j.neuroscience.2013.06.047. [DOI] [PMC free article] [PubMed] [Google Scholar]
- Sheean ME, McShane E, Cheret C, Walcher J, Müller T, Wulf-Goldenberg A, Hoelper S, Garratt AN, Krüger M, Rajewsky K, Meijer D, Birchmeier W, Lewin GR, Selbach M, Birchmeier C. Activation of MAPK overrides the termination of myelin growth and replaces Nrg1/ErbB3 signals during Schwann cell development and myelination. Genes Dev. 2014;28:290–303. doi: 10.1101/gad.230045.113. [DOI] [PMC free article] [PubMed] [Google Scholar]
- Sim FJ, Zhao C, Penderis J, Franklin RJ. The age-related decrease in CNS remyelination efficiency is attributable to an impairment of both oligodendrocyte progenitor recruitment and differentiation. J Neurosci. 2002;22:2451–2459. doi: 10.1523/JNEUROSCI.22-07-02451.2002. [DOI] [PMC free article] [PubMed] [Google Scholar]
- Sindreu CB, Scheiner ZS, Storm DR. Ca2+-stimulated adenylyl cyclases regulate ERK-dependent activation of MSK1 during fear conditioning. Neuron. 2007;53:79–89. doi: 10.1016/j.neuron.2006.11.024. [DOI] [PMC free article] [PubMed] [Google Scholar]
- Snaidero N, Möbius W, Czopka T, Hekking LH, Mathisen C, Verkleij D, Goebbels S, Edgar J, Merkler D, Lyons DA, et al. Myelin membrane wrapping of CNS axons by PI(3,4,5)P3-dependent polarized growth at the inner tongue. Cell. 2014;156:277–290. doi: 10.1016/j.cell.2013.11.044. [DOI] [PMC free article] [PubMed] [Google Scholar]
- Srinivasan L, Sasaki Y, Calado DP, Zhang B, Paik JH, DePinho RA, Kutok JL, Kearney JF, Otipoby KL, Rajewsky K. PI3 kinase signals BCR-dependent mature B cell survival. Cell. 2009;139:573–586. doi: 10.1016/j.cell.2009.08.041. [DOI] [PMC free article] [PubMed] [Google Scholar]
- Stevens B, Tanner S, Fields RD. Control of myelination by specific patterns of neural impulses. J Neurosci. 1998;18:9303–9311. doi: 10.1523/JNEUROSCI.18-22-09303.1998. [DOI] [PMC free article] [PubMed] [Google Scholar]
- Stevens B, Porta S, Haak LL, Gallo V, Fields RD. Adenosine: a neuron-glial transmitter promoting myelination in the CNS in response to action potentials. Neuron. 2002;36:855–868. doi: 10.1016/S0896-6273(02)01067-X. [DOI] [PMC free article] [PubMed] [Google Scholar]
- Sturrock RR. Myelination of the mouse corpus callosum. Neuropathol Appl Neurobiol. 1980;6:415–420. doi: 10.1111/j.1365-2990.1980.tb00219.x. [DOI] [PubMed] [Google Scholar]
- Tripathi RB, Rivers LE, Young KM, Jamen F, Richardson WD. NG2 glia generate new oligodendrocytes but few astrocytes in a murine experimental autoimmune encephalomyelitis model of demyelinating disease. J Neurosci. 2010;30:16383–16390. doi: 10.1523/JNEUROSCI.3411-10.2010. [DOI] [PMC free article] [PubMed] [Google Scholar]
- Wahl SE, McLane LE, Bercury KK, Macklin WB, Wood TL. Mammalian target of rapamycin promotes oligodendrocyte differentiation, initiation and extent of CNS myelination. J Neurosci. 2014;34:4453–4465. doi: 10.1523/JNEUROSCI.4311-13.2014. [DOI] [PMC free article] [PubMed] [Google Scholar]
- Wake H, Lee PR, Fields RD. Control of local protein synthesis and initial events in myelination by action potentials. Science. 2011;333:1647–1651. doi: 10.1126/science.1206998. [DOI] [PMC free article] [PubMed] [Google Scholar]
- Wang H, Yin G, Rogers K, Miralles C, De Blas AL, Rubio ME. Monaural conductive hearing loss alters the expression of the GluA3 AMPA and glycine receptor alpha1 subunits in bushy and fusiform cells of the cochlear nucleus. Neuroscience. 2011;199:438–451. doi: 10.1016/j.neuroscience.2011.10.021. [DOI] [PMC free article] [PubMed] [Google Scholar]
- Waxman SG. Determinants of conduction velocity in myelinated nerve fibers. Muscle Nerve. 1980;3:141–150. doi: 10.1002/mus.880030207. [DOI] [PubMed] [Google Scholar]
- Waxman SG. Axon-glia interactions: building a smart nerve fiber. Curr Biol. 1997;7:R406–R410. doi: 10.1016/S0960-9822(06)00203-X. [DOI] [PubMed] [Google Scholar]
- Yeung MS, Zdunek S, Bergmann O, Bernard S, Salehpour M, Alkass K, Perl S, Tisdale J, Possnert G, Brundin L, Druid H, Frisén J. Dynamics of oligodendrocyte generation and myelination in the human brain. Cell. 2014;159:766–774. doi: 10.1016/j.cell.2014.10.011. [DOI] [PubMed] [Google Scholar]
- Young KM, Psachoulia K, Tripathi RB, Dunn SJ, Cossell L, Attwell D, Tohyama K, Richardson WD. Oligodendrocyte dynamics in the healthy adult CNS: evidence for myelin remodeling. Neuron. 2013;77:873–885. doi: 10.1016/j.neuron.2013.01.006. [DOI] [PMC free article] [PubMed] [Google Scholar]
- Zawadzka M, Rivers LE, Fancy SP, Zhao C, Tripathi R, Jamen F, Young K, Goncharevich A, Pohl H, Rizzi M, Rowitch DH, Kessaris N, Suter U, Richardson WD, Franklin RJ. CNS-resident glial progenitor/stem cells produce Schwann cells as well as oligodendrocytes during repair of CNS demyelination. Cell Stem Cell. 2010;6:578–590. doi: 10.1016/j.stem.2010.04.002. [DOI] [PMC free article] [PubMed] [Google Scholar]
- Zuchero JB, Fu MM, Sloan SA, Ibrahim A, Olson A, Zaremba A, Dugas JC, Wienbar S, Caprariello AV, Kantor C, Leonoudakis D, Leonoudakus D, Lariosa-Willingham K, Kronenberg G, Gertz K, Soderling SH, Miller RH, Barres BA. CNS myelin wrapping is driven by actin disassembly. Dev Cell. 2015;34:152–167. doi: 10.1016/j.devcel.2015.06.011. [DOI] [PMC free article] [PubMed] [Google Scholar]