Abstract
Little is known about adipocyte metabolism during aging process and whether this can influence body fat redistribution and systemic metabolism. To better understand this phenomenon, two animal groups were studied: young—14 weeks old—and middle-aged—16 months old. Periepididymal (PE) and subcutaneous (SC) adipocytes were isolated and tested for their capacities to perform lipolysis and to incorporate D-[U-14C]-glucose, D-[U-14C]-lactate, and [9,10(n)-3H]-oleic acid into lipids. Additionally, the morphometric characteristics of the adipose tissues, glucose tolerance tests, and biochemical determinations (fasting glucose, triglycerides, insulin) in blood were performed. The middle-aged rats showed adipocyte (PE and SC) hypertrophy and glucose intolerance, although there were no significant changes in fasting glycemia and insulin. Furthermore, PE tissue revealed elevated rates (+50 %) of lipolysis during beta-adrenergic-stimulation. There was also an increase (+62 %) in the baseline rate of glucose incorporation into lipids in the PE adipocytes, while these PE cells were almost unresponsive to insulin stimulation and less responsive (a 34 % decrease) in the SC tissue. Also, the capacity of oleic acid esterification was elevated in baseline state and with insulin stimulus in the PE tissue (+90 and 82 %, respectively). Likewise, spontaneous incorporation of lactate into lipids in the PE and SC tissues was higher (+100 and 11 %, respectively) in middle-aged rats. We concluded that adipocyte metabolism of middle-aged animals seems to strongly favor cellular hypertrophy and increased adipose mass, particularly the intra-abdominal PE fat pad. In discussion, we have interpreted all these results as a metabolic adaptations to avoid the spreading of fat that can reach tissues beyond adipose protecting them against ectopic fat accumulation. However, these adaptations may have the potential to lead to future metabolic dysfunctions seen in the senescence.
Keywords: Young, Middle age, Adipocytes, Lipogenesis, Lipolysis, Glucose tolerance
Introduction
Advances in the health and medical sciences have extended human longevity. This new situation requires a more detailed investigation of physiology of the aging phenomenon encompassing several processes, including metabolism. It is known that adipose tissue undergoes substantial changes throughout this life period. During middle age (40–70 years in humans; 15–17 months in rats), adipose mass reaches its peak before decreasing considerably in the following years, and it undergoes intense redistribution along the aging process. In middle age, the increase of adiposity is particularly present in intra-abdominal fat deposits, while in old age, the loss of adipose mass is predominantly subcutaneous (Cartwright et al. 2007; Kirkland et al. 2002).
Metabolically, adipose tissue is important due to its huge capacity to store energy that can be thereafter mobilized as needed. Nevertheless, what appears to be an ordinary balance between deposition and mobilization of intracellular fat (lipogenesis against lipolysis) can actually influence systemic metabolism and, along with its endocrine capacity, confers to adipose tissue the active functional role of regulating energy metabolism.
Substrate cycles are important means of metabolic regulation (Newsholme 1980). The triglyceride/fatty acid cycle, for example, was considered a “futile” cycle because it did not appear to possess any obvious significance (Forest et al. 2003; Cadoudal et al. 2005). However, it is now known that adipocyte way to deal with their fat stores (i.e., by hydrolyzing and reconstituting triglycerides) determines the rate at which fatty acids are released into the blood stream, influencing the ectopic deposit of fat and, consequently, impacting systemic sensitivity to insulin and glucose oxidation (Randle et al. 1994; Forest et al. 2003; Langin 2011).
Fatty acids necessary for triglyceride synthesis can come from lipoproteins in the blood stream and/or from the intracellular environment. This process of triglyceride reconstitution is called re-esterification. Glucose supplies carbons to glycerol-3-phosphate and also to fatty acid synthesis, a process called de novo lipogenesis. On the other hand, metabolites such as pyruvate and lactate are important substrates for glyceroneogenesis, in which glycerol-3-phosphate derives from others precursors, other than glucose or glycerol. All these metabolic routes can influence the triglyceride/fatty acid cycle and systemic metabolism (Abel et al. 200; Reshef et al. 2003).
Although the anatomic and morphological changes brought on by aging have been widely reported (Tchkonia et al. 2010; Tchkonia et al. 2013), little is known about the way adipocytes handles above cites metabolites during aging and whether this can influence body fat redistribution and systemic metabolism. Based on this, the main goal of the present work was to compare metabolic pathways (lipolysis and lipogenesis) of middle-aged and young rat adipocytes. We sought, then, to identity the phenomena involved in this process, aiming at an initial comprehension of metabolic pathways and establishing the bases for a deeper understanding of this issue.
Material and methods
Animals
Male Wistar rats from the Animal Resources Center of the Institute of Biomedical Sciences of the University of São Paulo were used in the experiments. The rats were housed in individual cages with free access to water and food (balanced chow pellet diet, Nuvilab CR1, Nuvital SA, Colombo, Brazil) and kept on an inverted 12:12-h light-dark cycle (lights on at 6:00 p.m.). The animals were divided into 2 groups: young—14 weeks old—and middle-aged—16 months old.
Oral glucose tolerance test
To determine the blood glucose curve after oral glucose overload, after 12 h of fasting, young (n = 8) and middle-aged (n = 6) rats received an oral glucose load (75 mg/100 g b.w.) by gavage. Blood glucose was measured by a glucometer (OneTouch Ultra, Johnson & Johnson), at different times: 0 (pregavage) and 5, 15, 30, 60, and 90 min after glucose administration.
Euthanasia and animal biometric determinations
Young (n = 5) and middle-aged (n = 8) were fasted for 12 h and destined for all subsequent tests. Animals were preanesthetized with thiopental sodium (50 μg/g b.w.). Weight and nasal-anal lengths were measured to Lee obesity index calculation (3√body weight / naso-anal length) × 1000 according to Plocher and Powley (1977). Then, euthanasia was performed by decapitation. The Ethical Committee for Animal Research of the Institute of Biomedical Sciences of the University of Sao Paulo approved all of the experimental procedures. Blood serum was collected for biochemical and hormonal analyses, and fat pads from subcutaneous (SC) and peri-epididymal (PE) regions were weighed.
Adipocyte isolation
The PE and SC fat pad (1 g) were minced with fine scissors and digested at 37 °C in 4 ml of EHB buffer 1 (Earle’s salts, 25 mM HEPES [N-2-hydroxyethylpiperazine-N-2-ethanesulfonic acid] and 4 % BSA [bovine serum albumin]), pH 7.4, containing collagenase type I (1.25 mg/mL) from Worthington Biochemical Corporation (New Jersey, NY, USA). The adipocytes were then isolated according to Rodbell (1964). The isolated adipocytes (7–8 × 10⁵ cells/mL) were suspended in EHB buffer (Earle’s salts, 20 mM HEPES, 1 % bovine serum albumin, 2 mM sodium pyruvate, and 4.8 mM sodium bicarbonate), pH 7.4, at 37 °C. Cell size and number were determined as previously described by Di Girolamo et al. (1971).
Incorporation of D-[U-14C]-glucose, D-[U-14C]-lactate, and [9,10(n)-3H]-oleic acid into lipids
From a 10 % adipocyte suspension in Krebs/Ringer/phosphate buffer at pH 7.4, with 1 % bovine serum albumin and 2 mmol/L glucose, at 37 °C and saturated with a CO2 (5 %)/O2 (95 %) gas mixture, 450-μL aliquots were transferred to polypropylene test tubes containing 5 μL (0.05 μCi/tube) of D-[U-14C]-glucose, 14C-lactate or [9,10(n)-3H] oleic acid, all from Amersham Biosciences GE Health Care (made in UK) in presence or absence of insulin (10 nM) (except for the lactate assay). These samples were then incubated (final volume = 500 μL) for 1 h at 37 °C in a water bath. The tubes had a rubber stopper, and the atmosphere inside was enriched with CO2 (5 %)/O2 (95 %). At the end of this incubation, for [9,10(n)-3H] oleic acid assay, 800 μL of silicone oil was added followed by 1-min centrifugation in order to collect the suspended cells (and to get rid of labeled fatty acids exceeding in the medium), and thus, in all the three assays, the final reaction mixture was treated with 2.5 mL of Dole’s reagent (isopropanol/n-heptane/sulfuric acid, 4:1:0.25) for cell lipid extraction. The results were expressed as nmol/106 cells/h.
Measurement of lipolysis
The rates of basal and isoproterenol-stimulated lipolysis were measured in the isolated adipocytes according to the following protocol: 40-μL aliquots of cell suspension (EHB buffer containing 5 mM of glucose) were transferred to microtubes (0.6 mL) and incubated with 0.3 mM adenosine for 30 min. Next, 20 μL of adenosine deaminase (ADA, 0.2 U/mL in EHB buffer, pH 7.45) from Sigma-Aldrich (USA) was added for 30 min at 37 °C to allow the adenosine to degrade (16). After this period, the cells were incubated for 60 min at 37 °C with or without 10 μL of isoproterenol ([−]-Isoproterenol [+]-bitartrate salt) from Sigma-Aldrich (USA) in final concentration of 1 μM and a total volume of 200 μL. At the end of the incubation, the reaction was stopped by transferring the tubes to an ice bath, followed by centrifugation at 7000 rpm for 5 min at 4 °C to isolate the cells in the reaction medium. The amount of glycerol released from adipocytes into the incubation medium was determined using an enzymatic-colorimetric method (Free Glycerol Determination Kit) from Sigma-Aldrich (USA) and used as an index of the lipolysis rate. The results were expressed in nmol/106 cells/h.
Biochemical and hormonal measurements in plasma
Triacylglycerol (TAG–Bioclin K005) and total cholesterol (TC–Labtest 76–2) were determined using enzymatic methods with commercial kits. Insulin levels were determined by radioimmunoassay (RI-13K Linco Research, Inc.). As described in Matthews et al. (1985), we calculated the homeostasis model of assessment-insulin resistance (HOMA ir) index (glucose [mM] × insulin [U/L]) / 22.5, and HOMA-beta-cell function index (20 × insulin / glucose) − 3.5.
Statistical analysis
The means ± SEM of the individual data from each group were obtained and analyzed using a Student’s “t” test, unpaired and parametric. For nonparametric data, Mann-Whitney rank sum test was used. The upper limit of significance for rejection of the null hypothesis was established at 5 % (p < 0.05).
Results
Somatometric characteristics of animals
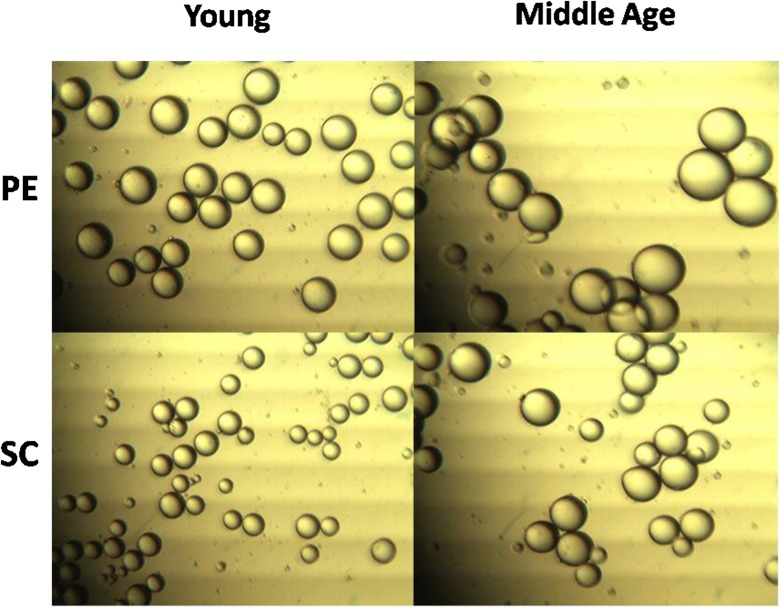
Table 1 shows that middle-aged animals had a greater total body weight. Nonetheless, through the Lee index, we demonstrated that middle-aged animals’ higher body weight was compatible with their size and did not result from severe obesity. However, the middle-aged animals had a greater percentage of PE fat, but not SC inguinal fat. On the other hand, the adipocytes from both deposits presented greater volume during middle age (Fig. 1), a tendency that was not followed by an estimated increase in the cell number of the fat depots (Table 1), indicating cellular hypertrophy of the tissues that were studied.
Table 1.
Morphometric and metabolic parameters
| Young | Middle aged | |
|---|---|---|
| Body weight (g) | 347.5 ± 8.3 | 516.2 ± 24.8* |
| Lee Obesity Index | 297.9 ± 3.4 | 302 ± 4.7 |
| PE fat pad weight (%) | 1.11 ± 0.12 | 1.53 ± 0.12* |
| SC fat pad weight (%) | 0.82 ± 0.05 | 0.96 ± 0.06 |
| PE estimated adipocyte no. (×106 cells) | 17.1 ± 0.8 | 17.1 ± 1.3 |
| SC estimated adipocyte no. (×106 cells) | 18.3 ± 0.8 | 19.7 ± 1.5 |
| Glucose (mg/dL) | 120.8 ± 5.1 | 124 ± 5.0 |
| TAG (mg/dL) | 53.1 ± 18.4 | 75.1 ± 13.1 |
| Total cholesterol (mg/dL) | 59.6 ± 2.7 | 66.5 ± 3.57 |
| Fasting insulin (ng/mL) | 0.91 ± 0.1 | 1.16 ± 0.2 |
| HOMA-IR | 6.7 ± 0.9 | 9.1 ± 1.6 |
| HOMA-β | 146.3 ± 26.7 | 167.2 ± 19.0 |
Data represent the mean ± SEM. Student’s “t” test, unpaired and parametric was used to analyze results. *p < 0.05. Young (n = 5) and middle-aged (n = 8) rats
Fig. 1.
Representative image of isolated adipocytes. Adipocytes of middle-aged rats had increased volume in both studied fat pads. Student’s “t” test, unpaired and parametric was used to analyze results. *p < 0.05 (vs respective young ones). Young (n = 5) and middle-aged (n = 8) rats
Metabolic characteristics
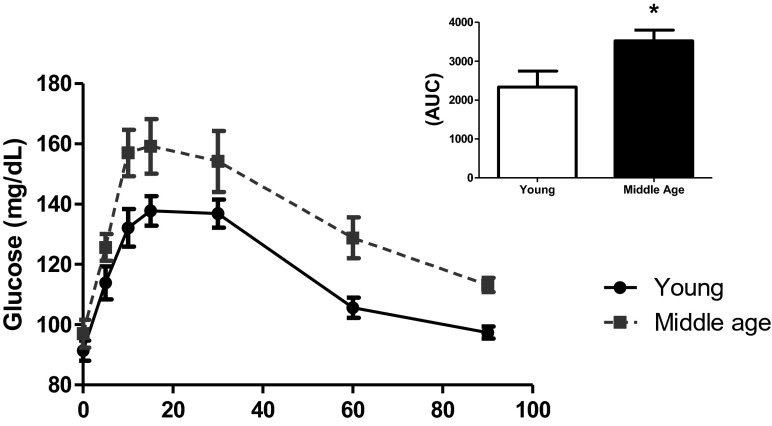
Table 1 also shows that the middle-aged animals did not significantly differ in terms of most of the metabolic aspects. Fasting-state glycemia, plasma triglycerides, total cholesterol, and insulin levels did not differ, as indicated by the HOMAIR and HOMAβ indexes which estimate, respectively, insulin sensitivity and pancreatic secretions. These data demonstrated that, in a fasting state, there were no significant dysfunctions in middle-aged rats. However, in the oral glucose tolerance test (Fig. 2), the changes were statistically significant, revealing a certain degree of glucose intolerance in middle-aged animals.
Fig. 2.
Oral glucose tolerance test. Young (n = 8) and middle-aged (n = 6) rats were submitted to an oral glucose load as described in “Material and methods.” As can be seen, middle-aged rats showed a worsening of glucose tolerance. This is seen in the small figure depicted on the upper right corner, which is a bar graph of the incremental area under the curves. Student’s “t” test, unpaired and parametric was used to analyze results. *p < 0.05 (in AUC values)
Lipolytic capacity of isolated adipocytes
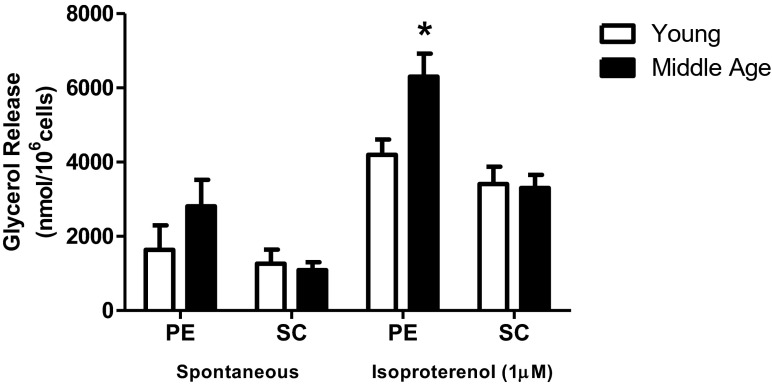
Figure 3 details the differences of lipolytic capacity in adipocytes from the PE and SC fat deposits. PE adipocytes of middle-aged rats showed greater response to the β-adrenergic agonist isoproterenol; this was not replicated in SC adipocytes.
Fig. 3.
Lipolytic capacity. Isolated adipocytes from PE and SC fat pads of young (n = 5) and middle-aged (n = 8) rats were incubated in presence or absence of isoproterenol 1 μM for 60 min at 37 °C and the glycerol released in the medium was determined as described. Data in the graph represents the mean ± SEM. Student’s “t” test, unpaired and parametric was used to analyze results. *p < 0.05 (in isoproterenol-stimulated PE adipocytes). Mann-Whitney rank sum test was used to analyze nonparametric data of spontaneous PE results
Incorporation of D-[U-14C] glucose in isolated adipocytes of middle-aged rats
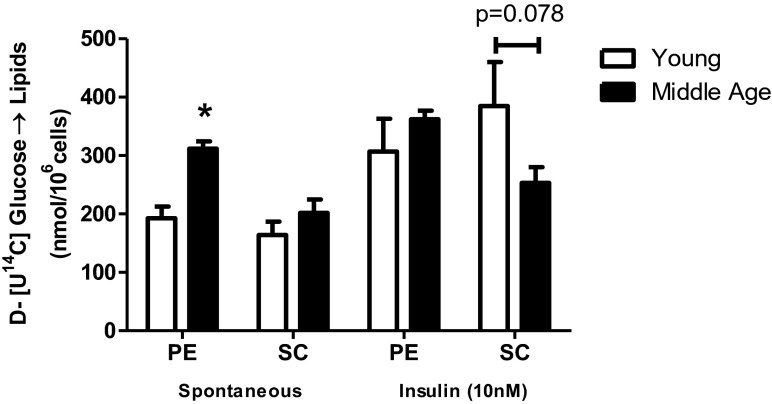
In Fig. 4, the rates of D-[U-14C]-glucose incorporated into lipids were determined, from which the lipogenic capacity of the PE and SC adipocytes was evaluated. Without insulin, PE adipocytes of middle-aged rats exhibited a greater ability to synthesize lipids than the PE adipocytes of young rats, while insulin did not increase the rate of lipogenesis, showing a decreased response to insulin. In SC adipocytes of middle-aged rats, the intensity of the insulin response tended to be lower (p = 0.078). Together, these data corroborate the hypothesis that, with advancing age, individuals develop a loss of lipogenic response to insulin that is counterbalanced by the increased spontaneous nonstimulated activity in PE.
Fig. 4.
Incorporation of D-[U-14C]-glucose into lipids. Isolated adipocytes from SC and PE fat pads of young (n = 5) and middle-aged (n = 8) rats were incubated for 60 min at 37 °C in absence (spontaneous) and in presence of insulin 10 nM. D-[U-14C]-glucose (1850 Bq) was added to the incubation medium at the beginning of the test. At the end, adipocyte lipid content was extracted, and the radioactivity incorporated was determined as described. Student’s “t” test, unpaired and parametric was used to analyze results. *p < 0.05 (in non insulin-stimulated PE adipocytes, young vs middle-aged)
Esterification capacity of [9,10(n)-3H] oleic acid
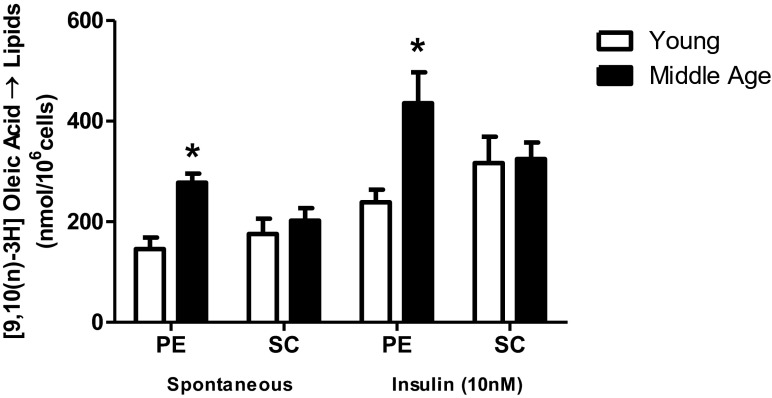
Figure 5 shows that, in middle-aged rats, the PE adipocytes had a greater ability to esterify the [3H] oleic fatty acid both in the basal and insulin-stimulated conditions when compared to the young. On the contrary, SC adipocytes did not alter their responses between the two groups.
Fig. 5.
[9,10(n)-3H] oleic acid esterification. Isolated adipocytes from SC and PE fat pads of young (n = 5) and middle-aged (n = 8) rats were incubated for 60 min at 37 °C in absence (spontaneous) and in presence of insulin 10 nM. ([9,10(n)-3H] oleic acid, 1850 Bq) was added to the incubation medium at the beginning of the test. At the end, adipocyte lipid content was extracted, and the radioactivity incorporated was determined as described. Student’s “t” test, unpaired and parametric was used to analyze results. *p < 0.05 (middle-aged vs young, for insulin-stimulated PE adipocytes)
Spontaneous incorporation of D-[U-14C] lactate in isolated adipocytes
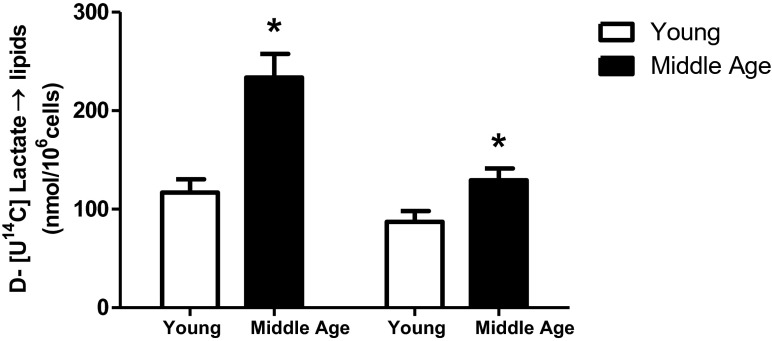
In Fig. 6, it is worthy to note that even without hormonal stimulation, cells from both adipose depots of middle-aged rats exhibited more intense rates of incorporation of lactate into lipids than did the adipocytes from the same fat depots of young rats.
Fig. 6.
Incorporation of D-[U-14C]-lactate into lipids. Isolated adipocytes from SC and PE fat pads of young (n = 5) and middle-aged (n = 8) rats were incubated for 60 min at 37 °C. D-[U-14C]-lactate was added to the incubation medium at the beginning of the test. At the end, adipocyte lipid content was extracted, and the radioactivity incorporated was determined as described. First two bars refer to PE and last two to SC adipocytes. Student’s “t” test, unpaired and parametric was used to analyze results. *p < 0.05 (middle-aged vs young)
Incorporation of D-[U-14C] glucose in the glycerol and fatty acid moieties of TAG in isolated adipocytes
Data on Table 2 reports the proportional amounts (%) of glucose directed toward the fatty acyl or glycerol moieties in PE and SC adipocytes. In SC cells of middle-aged rats, there was a preferential steering of D-[U-14C] glucose to fatty acids, which differed significantly from what occurred in the young animals. In this last case, the substrate proportion directed to the fatty acyl moiety was smaller.
Table 2.
Incorporation of D-[U-14C]-glucose into glycerol and FFA moieties of TAG
| % Glycerol | % Fatty acid | % Glycerol | % Fatty acid | ||
|---|---|---|---|---|---|
| Insulin (10 nM) | - | - | + | + | |
| PE | Young | 68.2 ± 4.5 | 31.8 ± 4.5 | 76.4 ± 4.3 | 23.6 ± 4.3 |
| Middle aged | 63.7 ± 3.6 | 36.3 ± 3.6 | 68.4 ± 3.5 | 31.6 ± 3.5 | |
| P | NS | NS | NS | NS | |
| SC | Young | 74.1 ± 1.5 | 25.9 ± 1.5 | 82.7 ± 0.9 | 17.3 ± 0.9 |
| Middle aged | 67.1 ± 4.1 | 32.9 ± 4.1 | 73.9 ± 3.1* | 26.1 ± 3.1* | |
| P | NS | NS | P < 0.05 | P < 0.05 |
Data represent the mean ± SEM. Student’s “t” test, unpaired and parametric was used to analyze results. *p < 0.05. Young (n = 5) and middle-aged (n = 8) rats
Discussion
This study was performed in order to get an overview of the metabolic changes that take place in adipocytes from middle-aged rats in an attempt to understand their influence on systemic metabolism and the possible repercussions in disorders like obesity, type 2 diabetes mellitus, and metabolic syndrome that are very common with the aging process. Here, we focused on metabolic changes of the adipocytes in middle-aged rats. Furthermore, we observed that adipocytes from two different depots present distinct peculiar alterations which may be associated with the expansion of fat mass and the regulation of systemic metabolism.
First, we assessed the changes in the lipolytic capacity in middle-aged rats. Cell size has been shown to be a determining factor of responsiveness to lipolytic agents, since larger cells exhibit a greater propensity toward lipolysis (Reynisdottir et al. 1997; Tchernof and Després 2013). Nevertheless, despite the fact that the middle-aged animals presented a consistent adipocyte hypertrophy in both fat pads, only the PE adipocytes displayed a lipolytic activity that was more pronounced than the same cells of young animals. In fact, a previous work reported that adipose cells from intra-abdominal deposits usually exhibit a greater lipolytic capacity than SC cells during diet-induced obesity (Gaidhu et al. 2010). It is worth observing that the heightened lipolytic capacity of intra-abdominally located fat stores is a feature of human obesity and metabolic syndromes. Increased visceral adipose tissue lipolitic activity raises the flow of free fatty acids in mesenteric circulation through the portal–hepatic system increasing risk ectopic fat deposition and of lipotoxicity in the liver. Once this condition is established, a local inflammation and an onset of insulin resistance in liver predispose systemic dysfunctions, as glucose intolerance and insulin resistance (for a better review of this issue, see Nielsen et al. 2004; Tchernof and Després 2013).
In our study, middle-aged rats did not present relevant changes in parameter measurements, such as fasting insulin, glucose, TAG, and total cholesterol or HOMA indexes (insulin resistance and beta-cell function), leading us to believe that no systemic dysfunction have developed, at least during fasting state. On the other hand, impaired glucose tolerance was found after a glucose overload featuring what could be the onset of age-induced metabolic dysfunctions, possibly induced by increased adipose mass (which affects the adipokine secretion pattern) and its lipolytic capacity (Carrascosa et al. 2011).
The data from tests of lipogenic capacity reinforce the impression that fat mass development and expansion in middle-aged rats is a process in course, since (at many points) there was an increased response when three different substrates were used to assess lipogenesis. However, it has been proposed that lipid incorporation in adipose tissue brings some beneficial effects to the animals since it results in a prevention of nutrient-induced toxicity (Nolan et al. 2015). In this context, metabolic flux may be directed toward adipose tissue in the initial stages of glucose intolerance and insulin resistance and has been considered a trigger of fat gain and obesity, since this tissue becomes the frequent destination for metabolic substrates (Prada et al. 2005). Hypothetically, directing these substrates to the adipose tissue results in initial benefits for two reasons: first, it prevents the increase in glycemia and lipidemia, which brings toxicity and metabolic dysfunction to other tissues; and second, because there is a very large capacity for storing these substrates in the form of triglycerides, adipose tissue works as a metabolic buffer that prevents the potentially harmful effects of lipotoxicity caused by ectopic fat accumulation.
In this sense, metabolic adipose tissue recovery (induced by the PPARγ agonist Pioglitazone) is associated with a better improvement in an experimental model of streptozotocin-induced diabetes than drugs which does not induce adipose metabolic recovery (Takada et al. 2008). Still, in a transgenic model of increased PEPCK enzyme, in which an increased re-esterification of fatty acids occurs due to the greater availability of glycerol synthesized from substrates such as lactate, obesity is induced; however, it is exempted from insulin resistance (Franckhauser et al. 2002). In addition, the control of adipose tissue de novo lipogenesis in another transgenic model exerts beneficial effects on systemic insulin sensitivity while inducing obesity (Dentin et al. 2012; Herman et al. 2012).
In our results, although there is less responsiveness to insulin in glucose metabolization in the adipocytes of middle-aged rats, the lipogenic process remains intense even without insulin stimulation, particularly in the PE region cells, which may compensate for the low response to the hormone and contribute to cellular hypertrophy of the intra-abdominal adipocytes, even in a manner not associated with insulin activity. Other substrates (oleic acid and lactate) used to evaluate lipogenesis by their incorporation into triglycerides also showed a more robust response, with greater evidence in the PE cells, indicating that both glyceroneogenesis and fatty acid esterification capabilities were elevated. Taking together, these results corroborated the idea that incorporation of energetic substrates in adipose tissue increases when metabolic dysfunctions are developing and might be adaptations which maintain systemic metabolic homeostasis. Along this line of reasoning, the percentage of de novo lipogenesis also increased in SC tissue adipocytes, a metabolic pathway recently proposed as one of the main factors of systemic sensitivity to insulin, because synthesis of fatty acids from glucose is a determinant of the adipose tissue’s contributions to this process (Abel et al. 2001; Herman et al. 2012). Therefore, the metabolic adaptations presented in our model (a greater capacity for esterification, glyceroneogenesis, and basal glucose incorporation) may be responsible for plugging the excess substrates potentially present in the blood stream (such as glucose due to glucose intolerance and fatty acids due to greater lipolysis).
On the other hand, although these metabolic adaptations of adipose cells may, at a certain point, contribute to stable fasting glycemia and insulinemia, as presented in our model, we know that the continuous increase of adipose mass, particularly through hypertrophy of the adipocytes, may result in obesity associated with metabolic syndromes. Thus, despite the existence of metabolically healthy obese people, prospective studies show that with time, these individuals have a greater risk for developing diseases such as diabetes (Soriguer et al. 2013). In this sense, we notice that in our model, it is already possible to verify glucose intolerance after oral glucose challenge.
Furthermore, the significant increase in adipocyte volume, but no increase in the number of adipose cells, is characteristic of the aging process, in which the differentiation of pre-adipocytes and, therefore, the reconstitution of new cells, are reduced. This is accompanied by cellular dysfunction of the mature adipocytes that, given their tendency toward hypertrophy, begin to activate the cellular stress pathways, inflammation, and apoptosis (Kirkland et al. 2002; Kirkland and Dobson 1997). This may have a direct relationship with an increase in the metabolic syndrome components found in aging, since the surgical removal of intra-abdominal fat restores systemic and hepatic insulin sensitivity in aged animals and decreases the expression of proinflammatory cytokines, such as TNF alpha, in subcutaneous adipose tissue (Gabriely et al. 2002). It is also known that metabolically functional obese individuals (that is, without insulin resistance) have a heightened distribution of subcutaneous fat (Klöting et al. 2010). This does not seem to occur in our model, in which fat from the intra-abdominal cavity is preferentially more developed and metabolically active.
Conclusion
We concluded that adipocyte metabolism of middle-aged animals seems to strongly favor cellular hypertrophy and increased adipose mass, particularly the intra-abdominal fat pad PE. As we showed, these changes in the metabolic handling of substrates may be comprehended as a metabolic adaptation taking place in the adipose tissue to avoid the spreading of fat that can reach tissues beyond adipose protecting them against ectopic fat accumulation that evolve to lipotoxicity, a potentially harmful event to the cells. However, these adaptations may have the potential to lead to future metabolic dysfunctions seen in the senescence.
Acknowledgments
This work was funded by Fundação de Amparo à Pesquisa do Estado de São Paulo (Process 14/15210-3).
Footnotes
Rogério Antonio Laurato Sertié and Rennan de Oliveira Caminhotto contributed equally to this work.
Contributor Information
Rogério Antonio Laurato Sertié, Email: rsertie@yahoo.com.br.
Rennan de Oliveira Caminhotto, Phone: 55-11-30917248, Email: rennanoc@icb.usp.br.
References
- Abel ED, Peroni O, Kim JK, Kim YB, Boss O, Hadro E, Minnemann T, Shulman GI, Kahn BB. Adipose-selective targeting of the GLUT4 gene impairs insulin action in muscle and liver. Nature. 2001;409:729–733. doi: 10.1038/35055575. [DOI] [PubMed] [Google Scholar]
- Cadoudal T, Leroyer S, Reis AF, Tordjman J, Durant S, Fouque F, Collinet M, Quette J, Chauvet G, Beale E, Velho G, Antoine B, Benelli C, Forest C. Proposed involvement of adipocyte glyceroneogenesis and phosphoenolpyruvate carboxykinase in the metabolic syndrome. Biochimie. 2005;87:27–32. doi: 10.1016/j.biochi.2004.12.005. [DOI] [PubMed] [Google Scholar]
- Carrascosa JM, Andrés A, Ros M, Bogónez E, Arribas C, Fernández-Agulló T, De Solís AJ, Gallardo N, Martínez C. Development of insulin resistance during aging: involvement of central processes and role of adipokines. Curr Protein Pept Sci. 2011;12:305–315. doi: 10.2174/138920311795906655. [DOI] [PubMed] [Google Scholar]
- Cartwright MJ, Tchkonia T, Kirkland JL. Aging in adipocytes: potential impact of inherent, depot-specific mechanisms. Exp Gerontol. 2007;42:463–471. doi: 10.1016/j.exger.2007.03.003. [DOI] [PMC free article] [PubMed] [Google Scholar]
- Dentin R, Langin D, Postic C. Hidden variant of ChREBP in fat links lipogenesis to insulin sensitivity. Cell Metab. 2012;15:795–797. doi: 10.1016/j.cmet.2012.05.007. [DOI] [PubMed] [Google Scholar]
- Di Girolamo M, Mendlinger S, Fertig JW. A simple method to determine fat cell size and number in four mammalian species. Amer J Physiol. 1971;221:850–858. doi: 10.1152/ajplegacy.1971.221.3.850. [DOI] [PubMed] [Google Scholar]
- Franckhauser S, Muñoz S, Pujol A, Casellas A, Riu E, Otaegui P, Su B, Bosch F. Increased fatty acid re-esterification by PEPCK overexpression in adipose tissue leads to obesity without insulin resistance. Diabetes. 2002;51:624–630. doi: 10.2337/diabetes.51.3.624. [DOI] [PubMed] [Google Scholar]
- Forest C, Tordjman J, Glorian M, Duplus E, Chauvet G, Quette J, Beale EG, Antoine B. Fatty acid recycling in adipocytes: a role for glyceroneogenesis and phosphoenolpyruvate carboxykinase. Biochem Soc Trans. 2003;31:1125–1129. doi: 10.1042/bst0311125. [DOI] [PubMed] [Google Scholar]
- Gabriely I, Ma XH, Yang XM, Atzmon G, Rajala MW, Berg AH, Scherer P, Rossetti L, Barzilai N. Removal of visceral fat prevents insulin resistance and glucose intolerance of aging: an adipokine-mediated process? Diabetes. 2002;51:2951–2958. doi: 10.2337/diabetes.51.10.2951. [DOI] [PubMed] [Google Scholar]
- Gaidhu MP, Anthony NM, Patel P, Hawke TJ, Ceddia RB. Dysregulation of lipolysis and lipid metabolism in visceral and subcutaneous adipocytes by high-fat diet: role of ATGL, HSL, and AMPK. Am J Physiol Cell Physiol. 2010;298:C961–C971. doi: 10.1152/ajpcell.00547.2009. [DOI] [PubMed] [Google Scholar]
- Herman MA, Peroni OD, Villoria J, Schön MR, Abumrad NA, Blüher M, Klein S, Kahn BB. A novel ChREBP isoform in adipose tissue regulates systemic glucose metabolism. Nature. 2012;484:333–338. doi: 10.1038/nature10986. [DOI] [PMC free article] [PubMed] [Google Scholar]
- Kirkland JL, Dobson DE. Preadipocyte function and aging: links between age-related changes in cell dynamics and altered fat tissue function. J Am Geriatr Soc. 1997;45:959–967. doi: 10.1111/j.1532-5415.1997.tb02967.x. [DOI] [PubMed] [Google Scholar]
- Kirkland JL, Tchkonia T, Pirtskhalava T, Han J, Karagiannides I. Adipogenesis and aging: does aging make fat go MAD? Exp Gerontol. 2002;37:757–767. doi: 10.1016/S0531-5565(02)00014-1. [DOI] [PubMed] [Google Scholar]
- Klöting N, Fasshauer M, Dietrich A, Kovacs P, Schön MR, Kern M, Stumvoll M, Blüher M. Insulin-sensitive obesity. Am J Physiol Endocrinol Metab. 2010;299:E506–E515. doi: 10.1152/ajpendo.00586.2009. [DOI] [PubMed] [Google Scholar]
- Langin D. In and out: adipose tissue lipid turnover in obesity and dyslipidemia. Cell Metab. 2011;14:569–570. doi: 10.1016/j.cmet.2011.10.003. [DOI] [PubMed] [Google Scholar]
- Matthews DR, Hosker JP, Rudenski AS, Naylor BA, Treacher DF, Turner RC. Homeostasis model assessment: insulin resistance and beta-cell function from fasting plasma glucose andinsulin concentrations in man. Diabetologia. 1985;28:412–419. doi: 10.1007/BF00280883. [DOI] [PubMed] [Google Scholar]
- Newsholme EA. Reflections on the mechanism of action of hormones. FEBS Lett. 1980;117(Suppl):K121–K134. doi: 10.1016/0014-5793(80)80576-X. [DOI] [PubMed] [Google Scholar]
- Nielsen S, Guo Z, Johnson CM, Hensrud DD, Jensen MD. Splanchnic lipolysis in human obesity. J Clin Invest. 2004;113:1582–1588. doi: 10.1172/JCI21047. [DOI] [PMC free article] [PubMed] [Google Scholar]
- Nolan CJ, Ruderman NB, Kahn SE, Pedersen O, Prentki M. Insulin resistance as a physiological defense against metabolic stress: implications for the management of subsets of type 2 diabetes. Diabetes. 2015;64:673–686. doi: 10.2337/db14-0694. [DOI] [PMC free article] [PubMed] [Google Scholar]
- Plocher TA, Powley TL. Maintenance of obesity following hypophysectomy in the obese-hyperglycemic mouse (ob/ob) Yale J Biol Med. 1977;50:291–300. [PMC free article] [PubMed] [Google Scholar]
- Prada PO, Zecchin HG, Gasparetti AL, Torsoni MA, Ueno M, Hirata AE, Corezola do Amaral ME, Höer NF, Boschero AC, Saad MJ. Western diet modulates insulin signaling, c-Jun N-terminal kinase activity, and insulin receptor substrate-1ser307 phosphorylation in a tissue-specific fashion. Endocrinology. 2005;146:1576–1587. doi: 10.1210/en.2004-0767. [DOI] [PubMed] [Google Scholar]
- Randle PJ, Priestman DA, Mistry S, Halsall A. Mechanisms modifying glucose oxidation in diabetes mellitus. Diabetologia. 1994;37:S155–S161. doi: 10.1007/BF00400839. [DOI] [PubMed] [Google Scholar]
- Reshef L, Olswang Y, Cassuto H, Blum B, Croniger CM, Kalhan SC, Tilghman SM, Hanson RW. Glyceroneogenesis and the triglyceride/fatty acid cycle. J Biol Chem. 2003;278:30413–30416. doi: 10.1074/jbc.R300017200. [DOI] [PubMed] [Google Scholar]
- Reynisdottir S, Dauzats M, Thörne A, Langin D. Comparison of hormone-sensitive lipase activity in visceral and subcutaneous human adipose tissue. J Clin Endocrinol Metab. 1997;82:4162–4166. doi: 10.1210/jcem.82.12.4427. [DOI] [PubMed] [Google Scholar]
- Rodbell M. Metabolism of isolated adipocytes 1. Effects of hormones on glucose metabolism and lipolysis. J Biol Chem. 1964;239:375–380. [PubMed] [Google Scholar]
- Soriguer F, Gutiérrez-Repiso C, Rubio-Martín E, García-Fuentes E, Almaraz MC, Colomo N, Esteva de Antonio I, de Adana MS, Chaves FJ, Morcillo S, Valdés S, Rojo-Martínez G. Metabolically healthy but obese, a matter of time? Findings from the prospective Pizarra study. J Clin Endocrinol Metab. 2013;98:2318–2325. doi: 10.1210/jc.2012-4253. [DOI] [PubMed] [Google Scholar]
- Takada J, Fonseca-Alaniz MH, de Campos TB, Andreotti S, Campana AB, Okamoto M, Borges-Silva C, Machado UF, Lima FB. Metabolic recovery of adipose tissue is associated with improvement in insulin resistance in a model of experimental diabetes. J Endocrinol. 2008;198:51–60. doi: 10.1677/JOE-08-0072. [DOI] [PubMed] [Google Scholar]
- Tchernof A, Després JP. Pathophysiology of human visceral obesity: an update. Physiol Rev. 2013;93:359–404. doi: 10.1152/physrev.00033.2011. [DOI] [PubMed] [Google Scholar]
- Tchkonia T, Morbeck DE, Von Zglinicki T, Van Deursen J, Lustgarten J, Scrable H, Khosla S, Jensen MD, Kirkland JL. Fat tissue, aging, and cellular senescence. Aging Cell. 2010;9:667–684. doi: 10.1111/j.1474-9726.2010.00608.x. [DOI] [PMC free article] [PubMed] [Google Scholar]
- Tchkonia T, Thomou T, Zhu Y, Karagiannides I, Pothoulakis C, Jensen MD, Kirkland JL. Mechanisms and metabolic implications of regional differences among fat depots. Cell Metab. 2013;17:644–656. doi: 10.1016/j.cmet.2013.03.008. [DOI] [PMC free article] [PubMed] [Google Scholar]


