

Abstract
In late age, the autonomic nervous system (ANS) has diminished ability to maintain physiological homeostasis in the brain in response to challenges such as to systemic blood pressure changes caused by standing. We devised an fMRI experiment aiming to map the cerebral effects of an ANS challenge (Valsalva manoeuvre (VM)). We used dual-echo fMRI to measure the effective transverse relaxation rate (R2*, which is inversely proportional to brain tissue oxygenation levels) in 45 elderly subjects (median age 80 years old, total range 75–89) during performance of the VM. In addition, we collected fluid-attenuated inversion recovery (FLAIR) data from which we quantified white matter hyperintensity (WMH) volumes. We conducted voxelwise analysis of the dynamic changes in R2* during the VM to determine the distribution of oxygenation changes due to the autonomic stressor. In white matter, we observed significant decreases in oxygenation levels. These effects were predominantly located in posterior white matter and to a lesser degree in the right anterior brain, both concentrated around the border zones (watersheds) between cerebral perfusion territories. These areas are known to be particularly vulnerable to hypoxia and are prone to formation of white matter hyperintensities. Although we observed overlap between localisation of WMH and triggered deoxygenation on the group level, we did not find significant association between these independent variables using subjectwise statistics. This could suggest other than recurrent transient hypoxia mechanisms causing/contributing to the formation of WMH.
Keywords: Autonomic nervous system, Brain aging, Valsalva manoeuvre, Hypoxia, Watershed zones, fMRI, Effective transverse relaxation rate (R2*)
Introduction
Brain functional and structural integrity depends heavily on maintaining energetic homeostasis, with a particular importance of preserving levels of cerebral perfusion. The extent of this dependence is emphasized by the fact that the human brain constitutes only about 2 % of the whole body weight but consumes as much as 20 % of the total oxygen and other resources supplied by blood (Kalaria 2010). The autonomic nervous system (ANS) plays a pivotal role in securing a stable environment in the brain in response to changes in peripheral blood pressure which may affect brain perfusion. In this work, we applied an fMRI method to examine the transient changes in brain tissue oxygenation in response to an autonomic challenge in healthy elderly subjects.
In everyday life, the ANS must continually compensate for varying blood pressure in response to stress such as standing. The pressure of blood entering the brain drops significantly as a result of taking an upright position from sitting and even more from lying, requiring swift adjustments to heart rate, stroke volume and peripheral vascular resistance in order to maintain perfusion pressure of the brain within the limits of tight cerebral autoregulation (Perlmuter et al. 2013). The capacity of the ANS to maintain physiological homeostasis in response to such autonomic challenge declines with age (Hotta and Uchida 2010), and this may have a direct impact on the integrity of the brain. In addition to autonomic control of arterial blood pressure and cardiac output, cerebral autoregulation acts within the brain to further dampen transient changes in pressure and maintain a constant level of tissue perfusion. However, it should be borne in mind that age-related arteriosclerosis is another factor contributing to compromised blood supply of the brain tissue (Kalaria 2010). Mandell et al. (2008) have shown that gray matter (GM) is preferentially defended against deficits in perfusion under stressful conditions by ‘taking it away’ from the white matter (WM)—a ‘steal phenomenon’—such that WM is potentially more susceptible to worsened homeostatic control. In addition, some features of the vasculature in the WM, including low number of anastomoses in the terminal type of vessels, increase its vulnerability by compromising blood supply in this tissue under conditions of a raised demand for blood flow (Mangla et al. 2011; Pantoni 2002). The brain tissue is also particularly vulnerable to perturbations in perfusion in the watershed zones at the borders of the major cerebral arterial perfusion territories. The watershed zones are characterized by a high susceptibility to hypoxia (Caine and Watson 2000) and hypo-perfusion (Lanterna et al. 2011; Mandell et al. 2008; Mangla et al. 2011).
Frequently, the ageing brain is characterised by areas of hyperintense signal known as white matter hyperintensities (WMH) seen in the WM on T2-weighted MRI scans, particularly using the fluid-attenuated inversion recovery (FLAIR) sequence (Grueter and Schulz, 2012; O’Sullivan, 2008). The WMH load is associated with age and a number of comorbities such as stroke and cognitive decline (Debette and Markus 2010). Ischemia is considered as a leading pathological feature of WMH (Fernando et al., 2006; O’Sullivan et al., 2002), and a reduction in perfusion during hypercapnic challenge has been shown within tissue with a high density of WM lesions in elderly subjects, suggesting a possible causative link between selective hypoxia in watershed zones and white matter damage (Mandell et al. 2008). The presence of WMH has been associated with a range of conditions where formal laboratory testing reveals autonomic dysfunction (Galluzzi et al. 2009; Newton et al. 2008; Richardson et al. 2009; Waldstein et al. 2004) and one study has found strong association between altered heart rate variability (a measure of autonomic control) and WMH burden in patients with mild cognitive impairment (Galluzzi et al. 2009). Together, these data suggest that autonomic dysfunction may be an important mechanism contributing to WMH formation.
The Valsalva manoeuvre (VM) is a standard method used to induce changes in blood pressure and heart rate and to study the integrity of the ANS in the clinic. The test requires the subject to maintain an expirational pressure against a closed outlet of 40 mmHg, normally for about 16 s. The physiological response to the VM is divided into four phases (I–IV) characterised by changes in mean arterial blood pressure and cardiac output which reflect sympathetic and parasympathetic activity and which must stimulate cerebral autoregulation (Dawson et al. 1999). In the present study, we used blood oxygenation level dependent (BOLD) functional MRI (fMRI) to non-invasively study the neuro-physiological effects of the VM as a challenge to the ANS via the sensitivity of BOLD to changes in brain tissue oxygenation. We specifically aimed to test the hypothesis that watershed perfusion areas, known to be vulnerable to white matter injury, would show significant tissue deoxygenation during autonomic challenge and that there would be a direct relationship between degree of deoxygenation and the present of WMH in our subjects.
Methods
Participants and recruitment
The current work is part of a wider longitudinal study examining the prevalence and clinical associations of neurocardiovascular instability and autonomic nervous system function in older community-dwelling people who have been studied since 2002 (for detail of the study, see Kerr et al. 2006). A subsample of 45 subjects from the cohort took part in the current study. Participants were aged 77 years old or over when they were scanned (2012). There were 24 male subjects, median age was 80.0 years, interquartile range = 77.0–83.3 years. Data on medical history and medications taken, presented in Table 1, were based on records collected at the initial recruitment wave and updated at the time of MRI scanning sessions based on participant interviews and general practitioner medical records. The study was approved by the local ethical committee, and all subjects provided written informed consent. A community-dwelling, healthy older age subject group was specifically chosen as they would be expected to have some levels of WMH.
Table 1.
Demographic and clinical data of the participants
| Males\females | 24/21 |
|---|---|
| Age | Median age = 80.0, interquartile range = 77.0–83.3, full range = 75–89 |
| MMSE | Mean MMSE = 27.8 ± 2.0 (SD), full range = 23.0–30.0, median = 29.0, interquartile range = 26.5–29.0 |
| Medical history Ischemic heart disease Hypertension Stroke or TIA Cardiovascular or cerebrovascular disease Diabetes |
Number of occurrencesa (%) 7 (15.56) 24 (53.33) 4 (8.89) 14 (31.11) 7 (15.56) |
| Medicationsb
Cardioactive Antihypertensive |
n
a (%) 30 (66.7) 29 (64.4) |
aNote that there may be more than one disorder occurring (medication taken) for a participant
bCardioactive: any antihypertensive, diuretic, antianginal, antiarrythmic, fludrocortiosone or midodrine; antihypertensive: any angiotensin-converting enzyme (ACE) inhibitors, alpha blockers, beta blockers, calcium channel blockers, angiotensin type 2 receptor blockers and thiazides
Experimental procedure
Participants underwent MRI scanning including an fMRI scan during which they performed a VM protocol as a dynamic challenge to the ANS (Meyer et al. 1966; Taylor 1996) according to our previously reported procedure (He et al. 2013). In brief, during a single fMRI time series acquisition, subjects performed four episodes of VM, each lasting 16 s (time of exhaling strain). The interval between the onsets of each VM was 60 s. The time course of the protocol is shown in Fig. 2a. Participants’ performance was guided by instructions projected on a MR scanner display system. First, an instruction to prepare for the VM (to inhale) was presented (5 s ahead of the manoeuvre), and then the instruction ‘start’ was displayed followed by the instruction ‘stop’ at 16 s after ‘start’. During the strain (pressuring phase), a visual feedback of the instantaneous pressure was displayed to the subject as a bar chart graphic showing exhaled pressure relative to the target of 40 mmHg. The displayed content was controlled by an in-house designed controller device (programmed in Labview 7.0, National Instruments, USA) which also recorded the data of subject performance (He et al. 2013). An example of an exhaled pressure trace is shown in Fig. 2b.
Fig. 2.
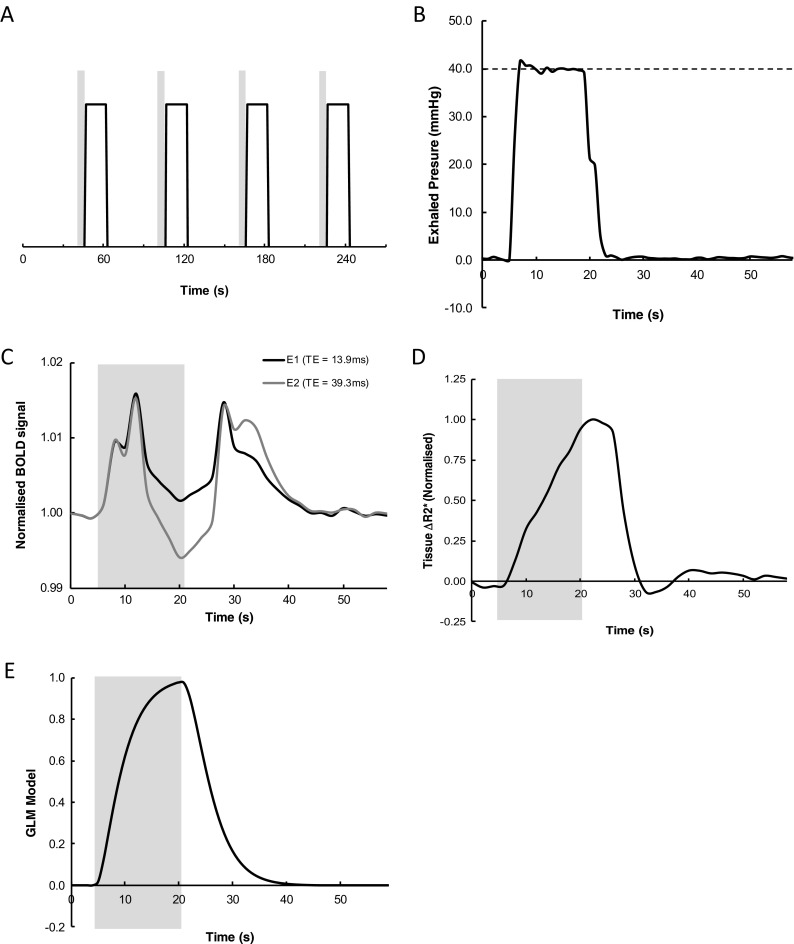
a Diagram illustrating the timing of Valsalva manoeuvre (VM) performance within the fMRI time series acquisition. Gray bars indicate the 5-s period during which subjects were instructed to prepare to perform the VM, while the solid line indicates the timing of each of the 16 s periods of VM. b Representative pressure trace of exhaled air during one of the VM periods. The dashed horizontal line depicts required level of pressure. c Group-averaged (n = 45) time series of the BOLD signal change for the two echo times averaged across the four VM periods. Black line, echo 1; gray line, echo 2. The gray box indicates the period of the VM. d Time series of the mean normalized R2* signal (n = 45) extracted from the whole brain (WM + GM, but excluding CSF). e Time course of models of response for ‘strain’ during the VM
Imaging
Scanning was performed on a 3 T Intera Achieva machine (Philips Healthcare Systems, Best, The Netherlands) using an eight-channel SENSE coil. For measurement of BOLD signal, a customized dual gradient echo EPI sequence was employed (135 volumes were acquired with TR = 2000 ms, TE1/TE2 = 13.82/39.27 ms, flip angle = 90°, field of view = 240 × 240 mm, matrix = 112 × 112, with 20 slices of 4-mm thickness). The simultaneous collection of 2 echo times allows calculation of the effective transverse relaxation rate (R2*), which varies with tissue oxygenation level and allows separation of tissue oxygenation changes from inflow effects (Glover et al. 1996) associated with the changes in blood pressure, which are a major feature of the VM. For the purpose of displaying BOLD statistical maps, a 3D T1-weighted anatomical image was also acquired (TR = 8.3 ms, TE = 4.6 ms, flip angle = 8°, field of view = 216 × 239 × 180 mm, isometric 1 mm voxels). These images were averaged and registered to the MNI space, creating a study-specific template reflecting age-related changes in anatomy.
For WMH segmentation, we acquired FLAIR images (TR = 11,000 ms, TE = 125 ms, TIR = 2800 ms; Turbo SE factor = 27; refocus angle = 120; field of view (FOV) = 240 × 240 mm, matrix size = 256 × 256, with 50 slices of 3-mm thickness, SENSE factor = 1.5). Figure 1 shows examples of images from each modality employed in this study from one typical subject.
Fig. 1.

Examples of four modalities of images used in the study from the same subject (middle axial slice); a T1 weighted, b FLAIR (note the presence of WMH, especially around the horns of the lateral ventricles); c fMRI; echo 2; d R2*
Image pre-processing and analysis
All pre-processing and statistical analysis steps were performed using the FSL package (version 1.4.9, FMRIB’s Software Library, www.fmrib.ox.ac.uk/fsl) (Smith et al., 2004; Woolrich et al., 2009) and customized Matlab scripts (Matlab R2012a; Mathworks Inc., Natick, MA, USA; including make_nii and save_nii functions, part of the ‘Tools for NIfTI and ANALYZE image’ package written by Jim Shen and freely available on Matlab file exchange website (Shen 2005).
Echo 1 (E1) images were pre-processed using motion correction (Jenkinson et al. 2002) followed by brain extraction (Smith 2002). The resultant transformation matrix and brain masks were then applied to the echo 2 (E2) images bringing all images into alignment.
Images of R2* were created based on the pre-processed E1 and E2 images according to the standard formula:
where S1 and S2 are the voxel intensities in the images with echo times TE1 and TE2, respectively.
Estimation of the effects of the VM on R2* was carried out using a mixed-effects general linear model (GLM) as implemented in the FEAT tool (FSL library, GUI version). The FEAT steps also included further standard fMRI pre-processing procedures: high pass filtering with a 100 s cut-off, noise reduction (SUSAN tool) (Smith and Brady 1997), linear registration to the template and spatial smoothing with 5 mm isotropic Gaussian kernel.
To determine the basic form of the GLM model, we first extracted the R2* response averaged across the whole brain and across all subjects as shown in Fig. 1d. Neural tissue (gray matter + white matter) was segmented in each individuals anatomical image using the SPM8 package (Wellcome Department of Imaging Neuroscience Group, London, UK) and applied as a global mask to the R2* image series from which the signal was extracted and subsequently averaged, normalized and smoothed using a spline algorithm (Fig. 1b). Responses during the ‘strain’ or pressuring (exhaling air against a closed glottis) were modelled with a boxcar function convolved with a gamma function. The convolution parameters were selected heuristically in order to obtain the best possible match to the average extracted R2* signal as described above (Fig. 1e). They were as follows: duration of 16 s, a mean time lag of the gamma smoothing of the input waveform (mean lag) of 6 s and half-width of the gamma function smoothing of the input waveform (HWGFS) set to 4 s.
To examine the oxygenation changes during the VM, we conducted a first-level analysis contrasting signal change during strain against baseline in each individual subject. To perform groupwise statistical analysis the first-level statistical maps were registered to the MNI space. The second-level analysis was then performed with the FSL FLAME1 random effects tool. Reported are thresholded statistical maps (z > 2.3) forming significant clusters (p < 0.05, familywise error-corrected).
In order to assess the localisation of R2* changes relative to the location of the vascular watershed zones, we also created binary masks representing the major arterial perfusion territories in standard space. These were generated by manually defining the territory boundaries on the standard space T1-weighted image template using anatomical hallmarks as described by Ferrer et al. (2008). The spatial distribution of significant R2* changes found in the second level analysis were then visually compared against these masks.
To quantify WMH volumes we used a semi-automated threshold-based algorithm employing SPM8 (Wellcome Department of Imaging Neuroscience Group, London, UK; http://www.fil.ion.ucl.ac.uk/spm/) functions embedded in an in-house Matlab (Matlab 8.1.0.604; R2013a, Mathworks, Inc., Natick, MA, USA) package as described previously (Firbank et al., 2003). Briefly, first WM, GM and CSF segments were defined using the subjects T1-weighted image and the SPM Segment toolbox (Ashburner and Friston, 2005) followed by registering them to the acquisition space of the FLAIR images. Subsequently, WMH were identified by applying a threshold to slice-specific intensity histograms of the tissue within the WM segment. Resulting masks were manually edited if necessary by two instructed raters using ITK-SNAP software (www.itksnap.org) to account for minor inaccuracies in the automated procedure.
To compare the volumes of WMH and the spatial extent of significant deoxygenation, we registered individual WMH masks and R2* change z-maps to the study template in the MNI space. For each subject, we then quantified the volume of WMH in MNI space as a fraction of the total white matter and the volume of significantly deoxygenating white matter on R2* maps. For each individual, we also calculated the proportion of WMH which was contained within the area of significant deoxygenating tissue (z ≥ 2.3; corrected) and also the proportion of WMH which was in non-deoxygenating tissue. Further, to test for any association between the magnitude of transient deoxygenation and presence of WMH in individuals, we ran a voxelwise logistic regression analysis. The distribution of WMH across the whole group was first determined by averaging the individual WMH masks in MNI space. We then analysed all voxels where there was a non-zero probability of finding WMH within the group and carried out a binomial regression between voxel the z-values (degree of deoxygenation) and the presence or absence (binary) of WMH in the voxel. Analysis was conducted using the multinomial logistic regression framework as implemented in Matlab statistics toolbox (mnrfit function).
Results
Typical image data from one subject is shown in Fig. 1 which illustrates the presence of WMH on the FLAIR scan, a basic fMRI scan and the calculated R2* map at the same brain level.
R2* data
Illustrations of the basic fMRI time series for each of the two echo times and the R2* series derived from these data are shown in Fig. 2c, d, respectively. It is observed that during the first ∼5 s (equating to approximately phase I and II of the VM), there are almost identical positive signal changes in both of the E1 and E2 time series, indicating significant effects of inflow associated with the increased mean arterial blood pressure during these phases of the VM. This effect is not seen in the R2* response where the combination of data from the two echoes has effectively separated the blood pressure changes and inflow effects from oxygenation changes (Glover et al. 1996). R2* is observed to gradually increase up to and slightly beyond the end of the VM indicating rising deoxygenation of the tissue during this time, followed by a decline to baseline with a small undershoot on release of the strain.
The GLM analysis was defined to evaluate regional patterns of tissue deoxygenation during phases I–III of the VM (where higher R2* equates to greater tissue deoxygenation) and the resulting statistical maps (z > 2.3, cluster-corrected) are shown in Fig. 3, and the characteristics of the significant clusters are summarized in Table 2. The R2* changes were concentrated in the right posterior part of the WM including areas adjacent to the posterior horns of the lateral ventricles (Fig. 3). A similar distribution could be observed in the left hemisphere but with lower values of z-statistics and less spatial extent. In addition, there was a significant cluster in the left anterior part of the brain. The deoxygenation maps showed the greatest effect within the territory of the middle cerebral artery (MCA) but also overlapped extensively with the watershed zone separating the MCA and posterior cerebral artery (PCA) territories in the posterior brain and between anterior CA (ACA) and MCA in the left anterior brain. Voxels characterized by higher z-statistics tended to concentrate near the territory boundaries (Fig. 3b, c).
Fig. 3.

a Group deoxygenation maps overlaid on study-specific template registered to the MNI space for contrast between ‘strain’ phase and baseline showing highly significant areas of tissue deoxygenation confined to posterior and left anterior white matter. Numbers beneath each slice denote z coordinates (mm). b Deoxygenation map (z = 16) overlaid on outlines of ideal major arterial territories. ACA anterior cerebral artery perfusion territory, MCA middle cerebral artery perfusion territory, PCA posterior cerebral artery perfusion territory; note a strong overlap of deoxygenation maps and watersheds between arterial territories. c Slices presenting theoretical outlines of perfusion territories—green, ACA; red, MCA; and blue, PCA (z-coordinates as on b). Note radiological orientation. Note radiological orientation (colour figure online)
Table 2.
Clusters (in the white matter) showing significant transient deoxygenation triggered by the Valsalva manoeuvre
| Cluster | Number of voxels (% brain) | Z max (z y z; MNI mm) |
|---|---|---|
| 1 | 21026 (2.3) | 6.41 (42–64 26) |
| 2 | 2951 (0.3) | 5.37 (−14 30 18) |
Relationship between the presence of WMH and deoxygenation
The total volume of WHM measured as a percentage of the whole WM was (mean ± SD): 1.52 ± 1.73 %, while the volume of tissue with statistically significant R2* deoxygenation was 10.94 ± 7.10 %. To quantify the relationship between these measurements, we calculated the degree of overlap between the WMH and deoxygenating tissue in each subject. Only 1.9 ± 1.3 % of the deoxygenating tissue was composed of pixels classified as WMH. It is clear from these values that the spatial extent of R2* effects is considerably and significantly larger (p < 0.001 for two-sample t test). Conversely, when we examined the location of the WMH, only 38.1 ± 19.8 % of the WMH was found within the deoxygenating tissue. This is consistent with the fact that WMH are particularly located around the anterior horns of the ventricles and the superior regions of the corona radiate where the deoxygenation changes where smaller or non-significant. In line with these values, a more refined, formal logistic regression analysis did not find any significant pixelwise association between the magnitude of transient deoxygenation and presence of WMH. Thus, the R2* changes are not simply reflective of the apparent WM pathology seen on the FLAIR images.
Discussion
In this study, we analysed the changes in brain tissue oxygenation during an autonomic challenge. We found that deoxygenation changes during the VM strain were greatest in the WM border zones between the middle and posterior and to a lesser extent between anterior and middle cerebral arterial territories, while the GM showed no significant changes. The spatial extent of the areas of deoxygenation during VM was significantly greater than the areas of WMH, while conversely only a proportion of the observed WMH were located in deoxygenating white matter. We did not find any evidence of a direct association between the degree of transient deoxygenation and the presence of WMH.
Global hypoxic changes
Strong responses during the strain period were found only in the WM and reflected widespread reduction in WM tissue oxygenation. We did not find any areas of significant deoxygenation in the GM. Together, these observations suggest that in the presence of reduced cardiac output during the VM, the autoregulatory system protects the GM at the expense of the WM. Importantly, we found that the WM areas with highly significant tissue deoxygenation were strongly overlapping with the watershed zone separating the two major arterial territories in the WM: medial cerebral artery (MCA) and posterior cerebral artery (PCA) and also between anterior (ACA) and MCA in the left hemisphere (Fig. 3b). This finding provides support for the particular vulnerability of the WM to transient episodes of hypoxia and ischemia. Mandell and co-workers (Mandell et al. 2008) using fMRI and arterial spin labelling found that this zone was prone to disturbances caused by another physiological stressful condition: hypercapnia, even in young healthy subjects. They described this as a ‘stealing phenomenon’ whereby in conditions of a stress (increased blood CO2 levels in their study) cerebral blood supplies are in the first instance directed to the GM, diverting them away from the WM. These processes were already detectable in young subjects (Mandell et al. 2008), and we postulate that they may increase during the life span and probably become more pronounced in the elderly. Although the localisation of the WM lesions and transient deoxygenation triggered by VM was visually similar, we did not find statistical association between these two measures. Thus, although WM lesions emerge in areas vulnerable to deoxygenation triggered by the autonomic challenge this vulnerability, although important, does not appear to be the only or leading cause of WM damage. Other causative factors have been identified such as leakage of potentially toxic substances through a disrupted blood-brain barrier (Pantoni 2002; Topakian et al. 2010; Wardlaw et al. 2003).
Laterality of global deoxygenation
Oxygenation changes during the VM strain in this cohort of subjects were right-dominant. This may be related to lateralisation in cerebral perfusion at rest which has been reported in previous studies (Pfefferbaum et al. 2010; Rodriguez et al. 1991; Wentland et al. 2010). In particular, Pfefferbaum and co-workers found left-right and anterio-posterior pattern of differences in cerebral blood flow in the GM measured by arterial spin labelling MRI. They detected higher flow in the right hemisphere in the anterior part of the brain whereas in the posterior part it was higher in the left hemisphere. We observed higher deoxygenation in response to the VM in the right posterior part of the WM (Fig. 3). This potentially could be explained by lower basal CBF in this part of the brain in the rest conditions as found by (Pfefferbaum et al. 2010); however, it should be noted that the study of those authors was restricted to the GM (detection of white matter CBF is challenging using the arterial spin labelling they employed), whereas our findings were the strongest in the WM.
Comparison to other MRI studies of the VM
Several studies have previously used the VM as a physiological challenge combined with fMRI data acquisition (Henderson et al. 2002, 2003). In particular, Henderson et al. (2002) examined the BOLD response to study the brain regions recruited during the VM using region of interest analysis and correlation of the BOLD response to physiological measures. The authors demonstrated signal changes in key brain regions associated with autonomic control. It is interesting to note that in both the studies of Henderson et al. and in the current study, changes in the WM were observed and that repeated performance of the VM led to increasing magnitude of BOLD signal change. However, it should be noted that in comparison to our approach Hendersen et al. used only a single echo time fMRI method which could not separate inflow effects from changes in oxygenation. Our data therefore extend the understanding of the brain response to VM by establishing that tissue deoxygenation does occur in the WM during the VM, at least in the elderly population.
Limitations
In our study, there were no selection criteria other than being elderly, community-dwelling subjects. There may be other pathologies involved in the response beyond the effect of ageing itself (see Table 1 for comorbidities and medications taken). It is known that hypertension is a major cardiovascular risk factor for WM damage and is associated with microvascular rarefaction and vessel remodelling (Feihl et al. 2008). In our group, 55 % of subjects were classified as being hypertensive according to their GP records and medication regime. Although hypertension was medication-controlled, we undertook a further second-level group analysis of the fMRI data (standard two-group FSL FEAT analysis) comparing those patients with a diagnosis of hypertension against the rest of the cohort, in order to determine whether hypertension was a driving factor in our findings of WM deoxygenation. We found no difference in deoxygenation between participants clustered as hypertensive and the rest of the sample. However, an impact of blood pressure cannot be entirely ruled out considering our sample composition and the possible existence of a ‘pre-hypertensive’ status in subjects which were not diagnosed as ‘hypertensive’.
Our data did not show any direct relationship between the presence of WMH and deoxygenation changes during autonomic challenge. However, it must been noted that the variability and total volume of WMH seen in our subjects was relatively restricted and thus our ability to detect any correlation may therefore be limited. Since WMH are a known risk factor for stroke, dementia and death (Debette and Markus 2010), it is conceivable that the elderly nature and general good health status of our community-dwelling cohort means that our group may be biased towards individuals who are resistant to WMH formation and hence are not totally characteristic of the general population. Having a wider age range would allow for a more sensitive assessment of this potential relationship. It should be also noted that our study evaluated only one type of autonomic challenge (a voluntary increase of thoracic pressure), and the observations may not directly extend to other autonomic tasks.
Methodologically, our data were collected using a gradient echo sequence which is sensitive to changes in oxygenation of the large and small vessels as well as the capillary bed. The precise level within the tissue where the deoxygenation takes place (for example in the small arteries and arterioles versus within the capillaries) cannot be conclusively determined from the current data. Further work is needed using spin-echo based perfusion measurements to explore this in more detail. Our dual-echo approach was used in order to map R2* and attempt to separate the effects of blood-pressure-related signal changes from deoxygenation effects in the tissue. Some level of T1-based inflow contrast may still be present at the 2-s repetition time which was needed in order to obtain good temporal resolution during the VM performance. In support of our methods, however, while the basic BOLD data show biphasic signal changes which closely resemble the blood pressure swings reported during the VM (Dawson et al. 1999), these features are not present in the R2* time series, suggesting that T1 inflow effects are not a major feature of the final data.
Conclusions
To conclude, this study reports the data on brain oxygenation changes in response to an ANS challenge pointing to watershed zones in the white matter as the areas most vulnerable to transient hypoxia. Our study provide further and novel evidence of the ‘stealing phenomenon’ (Mandell et al. 2008) as a result of autonomic challenge. The data did not however support cumulative effects of autonomic dysfunction as a leading mechanism for formation of WMH.
Acknowledgments
The research was funded by the National Institute for Health Research (NIHR) Newcastle Biomedical Research Centre based at Newcastle upon Tyne Hospitals NHS Foundation Trust, the British Geriatric Society and Research into Ageing Fund; a fund set up and managed by Age UK. The views expressed are those of the authors and not necessarily those of the NHS, the NIHR or the Department of Health. The authors are grateful to Dr. Michael Firbank (Newcastle University) for providing us with his code for WMH segmentation and guidelines for its usage and Dr. Andreas Finkelmeyer (Newcastle University) for his valuable comments and advice.
Abbreviations
- ACA
Anterior artery perfusion territory
- ANS
Autonomic nervous system
- BOLD
Blood oxygenation level dependent
- CBF
Cerebral blood flow
- EPI
Echo planar imaging
- GLM
General linear model
- GM
Gray matter
- HWGFS
Half-width of the gamma function smoothing of the input waveform
- MCA
Medial cerebral artery territory
- R2*
Effective transverse relaxation rate
- TE
Echo time
- TR
Repetition time
- VM
Valsalva manoeuvre
- WM
White matter
- WMH
White matter hyperintensities
References
- Ashburner J, Friston KJ (2005) Unified segmentation NeuroImage 26:839–851. doi:10.1016/j.neuroimage.2005.02.018 [DOI] [PubMed]
- Caine D, Watson JD. Neuropsychological and neuropathological sequelae of cerebral anoxia: a critical review. J Int Neuropsychological Soc: JINS. 2000;6:86–99. doi: 10.1017/S1355617700611116. [DOI] [PubMed] [Google Scholar]
- Dawson SL, Panerai RB, Potter JF. Critical closing pressure explains cerebral hemodynamics during the Valsalva maneuver. J Appl Physiol. 1999;86:675–680. doi: 10.1152/jappl.1999.86.2.675. [DOI] [PubMed] [Google Scholar]
- Debette S, Markus HS. The clinical importance of white matter hyperintensities on brain magnetic resonance imaging: systematic review and meta-analysis. BMJ. 2010;341:c3666. doi: 10.1136/bmj.c3666. [DOI] [PMC free article] [PubMed] [Google Scholar]
- Feihl F, Liaudet L, Levy BI, Waeber B. Hypertension and microvascular remodelling. Cardiovasc Res. 2008;78:274–285. doi: 10.1093/cvr/cvn022. [DOI] [PubMed] [Google Scholar]
- Fernando MS et al (2006) White matter lesions in an unselected cohort of the elderly: molecular pathology suggests origin from chronic hypoperfusion injury Stroke; a journal of cerebral circulation 37:1391–1398. doi:10.1161/01.STR.0000221308.94473.14 [DOI] [PubMed]
- Ferrer I, Kaste M, Kakiko H (2008) In: Love S, Louis DN, Ellison D. (eds) Greenfield’s Neuropathology, vol 1. Hodder Arnold Publication, p 128
- Firbank MJ, Minett T, O'Brien JT (2003) Changes in DWI and MRS associated with white matter hyperintensities in elderly subjects Neurology 61:950–954 [DOI] [PubMed]
- Galluzzi S, et al. Cardiac autonomic dysfunction is associated with white matter lesions in patients with mild cognitive impairment. J Gerontol A: Biol Med Sci. 2009;64:1312–1315. doi: 10.1093/gerona/glp105. [DOI] [PubMed] [Google Scholar]
- Glover GH, Lemieux SK, Drangova M, Pauly JM. Decomposition of inflow and blood oxygen level-dependent (BOLD) effects with dual-echo spiral gradient-recalled echo (GRE) fMRI. Magnetic Resonance Med: Off J Soc Magnetic Resonance Med/Soc Magnetic Resonance Med. 1996;35:299–308. doi: 10.1002/mrm.1910350306. [DOI] [PubMed] [Google Scholar]
- Grueter BE, Schulz UG (2012) Age-related cerebral white matter disease (leukoaraiosis): a review Postgrad Med J 88:79–87. doi:10.1136/postgradmedj-2011-130307 [DOI] [PubMed]
- He J, Hollingsworth KG, Newton J, Blamire AM. Cerebral vascular control is associated with skeletal muscle pH in chronic fatigue syndrome patients both at rest and during dynamic stimulation. Neuroimage: Clin. 2013;2:168–173. doi: 10.1016/j.nicl.2012.12.006. [DOI] [PMC free article] [PubMed] [Google Scholar]
- Henderson LA, et al. Brain responses associated with the Valsalva maneuver revealed by functional magnetic resonance imaging. J Neurophysiol. 2002;88:3477–3486. doi: 10.1152/jn.00107.2002. [DOI] [PubMed] [Google Scholar]
- Henderson LA, et al. Neural responses during Valsalva maneuvers in obstructive sleep apnea syndrome. J Appl Physiol (1985) 2003;94:1063–1074. doi: 10.1152/japplphysiol.00702.2002. [DOI] [PubMed] [Google Scholar]
- Hotta H, Uchida S. Aging of the autonomic nervous system and possible improvements in autonomic activity using somatic afferent stimulation. Geriatrics Gerontology Int. 2010;10(Suppl 1):S127–136. doi: 10.1111/j.1447-0594.2010.00592.x. [DOI] [PubMed] [Google Scholar]
- Jenkinson M, Bannister P, Brady M, Smith S. Improved optimization for the robust and accurate linear registration and motion correction of brain images. NeuroImage. 2002;17:825–841. doi: 10.1006/nimg.2002.1132. [DOI] [PubMed] [Google Scholar]
- Kalaria RN. Vascular basis for brain degeneration: faltering controls and risk factors for dementia. Nutr Rev. 2010;68(Suppl 2):S74–87. doi: 10.1111/j.1753-4887.2010.00352.x. [DOI] [PMC free article] [PubMed] [Google Scholar]
- Kerr SR, Pearce MS, Brayne C, Davis RJ, Kenny RA. Carotid sinus hypersensitivity in asymptomatic older persons: implications for diagnosis of syncope and falls. Arch Intern Med. 2006;166:515–520. doi: 10.1001/archinte.166.5.515. [DOI] [PubMed] [Google Scholar]
- Lanterna LA, Lunghi A, Martchenko S, Gritti P, Bonaldi G, Biroli F. Cerebral watershed hypoperfusion in subarachnoid hemorrhage: computed tomography perfusion analysis. J Neurosurg. 2011;114:961–968. doi: 10.3171/2010.8.JNS091766. [DOI] [PubMed] [Google Scholar]
- Mandell DM, Han JS, Poublanc J, Crawley AP, Kassner A, Fisher JA, Mikulis DJ. Selective reduction of blood flow to white matter during hypercapnia corresponds with leukoaraiosis. Stroke J Cerebral Circ. 2008;39:1993–1998. doi: 10.1161/STROKEAHA.107.501692. [DOI] [PubMed] [Google Scholar]
- Mangla R, Kolar B, Almast J, Ekholm SE. Border zone infarcts: pathophysiologic and imaging characteristics. Radiographics: Rev Publ Radiological Soc North Am Inc. 2011;31:1201–1214. doi: 10.1148/rg.315105014. [DOI] [PubMed] [Google Scholar]
- Meyer JS, Gotoh F, Takagi Y, Kakimi R. Cerebral hemodynamics, blood gases, and electrolytes during breath-holding and the Valsalva maneuver. Circulation. 1966;33:II35–48. doi: 10.1161/01.CIR.33.5S2.II-35. [DOI] [PubMed] [Google Scholar]
- Newton JL, et al. Cognitive impairment in primary biliary cirrhosis: symptom impact and potential etiology. Hepatology. 2008;48:541–549. doi: 10.1002/hep.22371. [DOI] [PubMed] [Google Scholar]
- O'Sullivan M (2008) Leukoaraiosis Practical neurology 8:26–38. doi:10.1136/jnnp.2007.139428 [DOI] [PubMed]
- Pantoni L. Pathophysiology of age-related cerebral white matter changes. Cerebrovasc Dis. 2002;13(Suppl 2):7–10. doi: 10.1159/000049143. [DOI] [PubMed] [Google Scholar]
- Perlmuter LC, Sarda G, Casavant V, Mosnaim AD. A review of the etiology, asssociated comorbidities, and treatment of orthostatic hypotension. Am J Ther. 2013;20:279–291. doi: 10.1097/MJT.0b013e31828bfb7f. [DOI] [PubMed] [Google Scholar]
- Pfefferbaum A, Chanraud S, Pitel AL, Shankaranarayanan A, Alsop DC, Rohlfing T, Sullivan EV. Volumetric cerebral perfusion imaging in healthy adults: regional distribution, laterality, and repeatability of pulsed continuous arterial spin labeling (PCASL) Psychiatry Res. 2010;182:266–273. doi: 10.1016/j.pscychresns.2010.02.010. [DOI] [PMC free article] [PubMed] [Google Scholar]
- Richardson J, Kerr SR, Shaw F, Kenny RA, O’Brien JT, Thomas AJ. A study of orthostatic hypotension in late-life depression. Am J Geriatric Psychiatry: Off J Am Assoc Geriatric Psychiatry. 2009;17:996–999. doi: 10.1097/JGP.0b013e3181b4bf35. [DOI] [PubMed] [Google Scholar]
- Rodriguez G, et al. Regional cerebral blood flow asymmetries in a group of 189 normal subjects at rest. Brain Topogr. 1991;4:57–63. doi: 10.1007/BF01129666. [DOI] [PubMed] [Google Scholar]
- Shen J (2005) https://www.mathworks.co.uk/matlabcentral/fileexchange/8797-tools-for-nifti-and-analyze-image
- Smith SM. Fast robust automated brain extraction. Hum Brain Mapp. 2002;17:143–155. doi: 10.1002/hbm.10062. [DOI] [PMC free article] [PubMed] [Google Scholar]
- Smith SM et al. (2004) Advances in functional and structural MR image analysis and implementation as FSL NeuroImage 23 Suppl 1:S208–219. S1053-8119(04)00393-3 [pii] doi:10.1016/j.neuroimage.2004.07.051 [DOI] [PubMed]
- Smith SM, Brady JM. SUSAN - a new approach to low level image processing. J Comput Vision. 1997;23:45–78. doi: 10.1023/A:1007963824710. [DOI] [Google Scholar]
- Taylor D. The Valsalva manoeuvre: a critical review. Underwater Med Soc. 1996;26:8–13. [Google Scholar]
- Topakian R, Barrick TR, Howe FA, Markus HS. Blood–brain barrier permeability is increased in normal-appearing white matter in patients with lacunar stroke and leucoaraiosis. J Neurol Neurosurg Psychiatry. 2010;81:192–197. doi: 10.1136/jnnp.2009.172072. [DOI] [PubMed] [Google Scholar]
- Waldstein SR, Siegel EL, Lefkowitz D, Maier KJ, Brown JR, Obuchowski AM, Katzel LI. Stress-induced blood pressure reactivity and silent cerebrovascular disease. Stroke J Cerebral Circ. 2004;35:1294–1298. doi: 10.1161/01.STR.0000127774.43890.5b. [DOI] [PubMed] [Google Scholar]
- Wardlaw JM, Sandercock PA, Dennis MS, Starr J. Is breakdown of the blood–brain barrier responsible for lacunar stroke, leukoaraiosis, and dementia? Stroke J Cerebral Circ. 2003;34:806–812. doi: 10.1161/01.STR.0000058480.77236.B3. [DOI] [PubMed] [Google Scholar]
- Wentland AL, Rowley HA, Vigen KK, Field AS. Fetal origin of the posterior cerebral artery produces left-right asymmetry on perfusion imaging. AJNR Am J Neuroradiology. 2010;31:448–453. doi: 10.3174/ajnr.A1858. [DOI] [PMC free article] [PubMed] [Google Scholar]
- Woolrich MW et al. (2009) Bayesian analysis of neuroimaging data in FSL NeuroImage 45:S173–186. S1053-8119(08)01204-4 [pii] doi:10.1016/j.neuroimage.2008.10.055 [DOI] [PubMed]