

Abstract
Background: Although obesity has been linked to an increased risk of colorectal cancer (CRC), the risk associated with long-term status or change of body fat distribution has not been fully elucidated.
Methods: Using repeated anthropometric assessments in the Nurses’ Health Study and Health Professionals Follow-up Study, we prospectively investigated cumulative average waist circumference, hip circumference and waist-to-hip ratio, as well as their 10-year changes over adulthood, in relation to CRC risk over 23–24 years of follow-up. Cox proportional hazards models were used to calculate the hazard ratio (HR) and 95% confidence interval (CI).
Results: High waist circumference, hip circumference and waist-to-hip ratio were all associated with a higher CRC risk in men, even after adjusting for body mass index. The association was attenuated to null in women after adjusting for body mass index. Ten-year gain of waist circumference was positively associated with CRC risk in men ( P for trend = 0.03), but not in women ( P for trend = 0.34).Compared with men maintaining their waist circumference, those gaining waist circumference by ≥ 10 cm were at a higher risk of CRC, with a multivariable-adjusted HR of 1.59 (95% CI, 1.01–2.49). This association appeared to be independent of weight change.
Conclusions: Abdominal adiposity, independent of overall obesity, is associated with an increased CRC risk in men but not in women. Our findings also provide the first prospective evidence that waist circumference gain during adulthood may be associated with higher CRC risk in men, thus highlighting the importance of maintaining a healthy waist for CRC prevention.
Keywords: Body fat distribution, sex difference, postmenopausal hormone therapy
Key Messages
Long-term abdominal adiposity during adulthood, independent of overall obesity, is associated with an increased risk of colorectal cancer in men but not in women.
Gain in waist circumference during adulthood may be associated with higher risk of colorectal cancer in men.
Our findings highlight the importance of maintaining a healthy waist for colorectal cancer prevention.
Introduction
Colorectal cancer (CRC) is the third most commonly diagnosed cancer and the fourth leading cause of cancer death in the world. 1 Overall obesity, as measured by high body mass index (BMI), increases CRC risk, with more consistent evidence in men than in women. 2 Recently it has been estimated that 13.0% of colon cancer and 6.2% of rectal cancer were attributable to high BMI (> 22 kg/m 2 ). 3 Despite these compelling data, several limitations of BMI have been noted, including its inability to distinguish between fat mass and lean mass and to capture the variation of body fat distribution. 4 On the other hand, accumulating evidence suggests that abdominal fat distribution, measured by high waist circumference or waist-to-hip ratio (WHR), is a better indicator of the metabolic disturbances that may subsequently influence CRC risk. 4
High waist circumference and WHR have been associated with a higher risk of CRC in many prospective studies. 5–18 However, in all but two studies 8,19 only a single measurement was reported, and therefore neither the long-term influence nor any changes in body fat distribution during adulthood could be examined.
The objective of this study was to investigate the cumulative average and change in body fat distribution measures, including waist circumference, hip circumference and WHR, during adulthood in relation to CRC risk in two large cohort studies, the Nurses’ Health Study (NHS) and Health Professionals Follow-up Study (HPFS). In earlier examinations in the two cohorts, we observed a positive association of baseline waist circumference and WHR with risk of colon cancer; 5,6 however, those analyses were limited by the short duration of follow-up (5–6 years), and a lack of data on rectal cancer and change in body fat distribution. In the current study, we present results that encompass both the long-term status and the change in body fat distribution among men and women over 23 to 24 years of follow-up.
Methods
Study population
Details about the NHS and HPFS have been described elsewhere. 20,21 In brief, the NHS included 121 701 US registered female nurses who were aged 30–55 years in 1976. The HPFS included 51 529 US male health professionals who were aged 40–75 years in 1986. In both cohorts, participants completed a detailed questionnaire enquiring about their medical history and lifestyle factors at baseline, and every 2 years thereafter. Among participants who were alive up to 2010, the follow-up rates were 95.4% in the NHS and 95.9% in the HPFS. This investigation was approved by the Institutional Review Board at the Brigham and Women’s Hospital and the Harvard School of Public Health.
Exposure measurement
In both cohorts, height and weight were self-reported at baseline. Participants were also asked about their current weight on biennial questionnaires. In 1987 in the HPFS, we enclosed a tape measure in an optional questionnaire and directed participants to measure their waist at the umbilicus and their hips at the largest circumference between their waist and thighs. Participants were instructed to take measurements while standing and avoid measuring over bulky clothing. Waist and hip circumference information was updated using the same procedure in 1996. In the NHS, women were asked to report their waist and hip circumferences using a tape measure in 1986, 1996 and 2000. In both cohorts, circumference measurements were recorded to the nearest one-quarter inch, and WHRs were calculated for each set of circumferences. The self-reported anthropometric assessments have been previously validated with a high correlation with technicians’ measurements (see Supplementary data , available at IJE online).
Outcome ascertainment
In both cohorts, self-reported diagnoses of CRC were obtained on biennial questionnaires, and participants who reported a diagnosis of CRC were asked for permission to acquire their medical records and pathological reports. We identified deaths through the National Death Index and next of kin. For all CRC deaths, we requested permission from next of kin to review medical records. A study physician, blinded to anthropometric information, reviewed records to confirm the CRC diagnosis and to extract relevant information, including anatomical location. 22
Statistical analysis
All the analyses were performed separately in women and men. To capture the long-term body fat distribution, we calculated the cumulative averages of waist circumference, hip circumference and WHR for each participant, using the repeated assessments. We also calculated the approximately 10-year change of measurements from 1986 to 1996 in the NHS, and from 1987 to 1996 in the HPFS. In all the analyses, a 2–3-year lag of follow-up was adopted to minimize the influence of reverse causation arising from undiagnosed cancer-induced change in body size. Therefore, for the cumulative average analysis, we calculated person-time of follow-up for each participant from the age at the date when the 1988 (NHS) or 1990 (HPFS) questionnaire was returned until the age at date of death, CRC diagnosis or end of follow-up (1 June 2010 for the NHS, 31 January 2010 for the HPFS), whichever came first. Similarly, for the analysis of change in anthropometric measurements, follow-up started from the date when the 1998 questionnaires were returned. For each analysis, we excluded participants who had missing anthropometric data or had cancer other than non-melanoma skin cancer at the beginning of follow-up. Cox proportional hazards regression was used to calculate hazard ratio (HR) and 95% confidence interval (CI) of CRC associated with body size measurements. In multivariable analysis, we adjusted for several potential confounders. Details regarding covariate assessment are provided in the Supplementary materials (available as Supplementary data at IJE online). To examine whether body fat distribution has any effect on CRC risk independent of overall adiposity, we further adjusted for cumulative average BMI in the multivariable model. We assessed a potential non-linear relationship using stepwise restricted cubic spline analysis, 23 with a P < 0.05 as the criterion for both inclusion and retention in the model.
For the cumulative average analysis, we corrected for measurement error in self-reported anthropometric data using technician-measured data from the validation study of the two cohorts. 24 We used a risk set regression calibration method, which recalibrates the measurement error model for time-varying exposures within each risk set of the Cox regression model. 25
Given previous evidence about effect modification by menopausal hormone therapy (MHT) on the obesity-CRC relationship, 13,18,26 we also stratified by MHT and tested for possible interaction using likelihood ratio test. We also grouped participants according to the combined categories of BMI and waist circumference, and tested the joint association and interaction of the two measures with CRC risk.
Additional details regarding statistical analyses are provided in the Supplementary materials (available as Supplementary data at IJE online). We used SAS 9.3 for all analyses (SAS Institute Inc., Cary, NC, USA). All statistical tests were two-sided.
Results
Basic characteristics of participants included in the cumulative average analysis
After excluding those who died or had cancer diagnosis before follow-up,or had missing waist or hip circumference data, a total of 112 610 participants (71 453 women from the NHS and 41 157 men from the HPFS) were included in the analysis (see the flowchart in Supplementary Figure 1 , available as Supplementary data at IJE online). Among these participants, we identified 1884 incident CRC cases (1125 women; 759 men) over 20–22 years, encompassing 1 979 428 person-years of follow-up (1 283 396 in women and 696 032 in men). As shown in Table 1 , compared with participants with a low waist circumference, those with a high waist circumference were less physically active, had more lifetime tobacco exposure and were more likely to have diabetes and to take aspirin or non-steroidal anti-inflammatory drugs. In contrast, participants with a low waist circumference were more likely to use multivitamins, undergo endoscopic examination and consume more folate, calcium, vitamin D and fibre and less red meat.
Table 1.
Age-standardized characteristics according to waist circumference in women (Nurses’ Health Study) and men (Health Professionals Follow-up Study) a
| Variable |
Women
|
Men
|
||||||||
|---|---|---|---|---|---|---|---|---|---|---|
| Quintile 1 | Quintile 2 | Quintile 3 | Quintile 4 | Quintile 5 | Quintile 1 | Quintile 2 | Quintile 3 | Quintile 4 | Quintile 5 | |
| Range, cm | ≥ 61.0,< 71.8 | ≥ 71.8, < 77.5 | ≥ 77.5, < 83.8 | ≥ 83.8, < 92.1 | ≥ 92.1, < 123 | ≥ 76.8, < 88.9 | ≥ 88.9, < 92.7 | ≥ 92.7, < 97.2 | ≥ 97.2, < 104 | ≥ 104,< 130 |
| Age, year | 63.1 | 64.7 | 65.5 | 66.4 | 66.3 | 63.6 | 65.3 | 66.6 | 66.7 | 67.1 |
| Waist circumference, cm | 68.5 | 75.4 | 80.9 | 87.5 | 101.3 | 84.9 | 90.9 | 95.2 | 100 | 110.7 |
| Hip circumference, cm | 93.4 | 97.6 | 100.8 | 104.9 | 114.2 | 94.8 | 98.6 | 101.1 | 104 | 111.3 |
| Waist-to-hip ratio | 0.74 | 0.78 | 0.81 | 0.84 | 0.90 | 0.90 | 0.92 | 0.94 | 0.96 | 1.00 |
| Height, cm | 162 | 164 | 164 | 164 | 165 | 176 | 178 | 178 | 179 | 180 |
| Body mass index, kg/m 2 | 21.3 | 22.7 | 24.1 | 25.8 | 29.9 | 22.9 | 24.3 | 25.4 | 26.7 | 29.5 |
| Physical activity, MET-h/week | 22.7 | 19.3 | 17.1 | 15.3 | 12.6 | 40.3 | 35.1 | 32.1 | 28.7 | 23.8 |
| Pack-years of smoking | 22.6 | 22.4 | 23.7 | 24.5 | 25.8 | 20.9 | 22.6 | 23.5 | 25.2 | 28.2 |
| Current smoking, % | 13 | 12 | 11 | 11 | 9 | 6 | 5 | 5 | 5 | 6 |
| Family history of colorectal cancer, % | 16 | 17 | 18 | 18 | 18 | 14 | 14 | 15 | 15 | 15 |
| Current multivitamin use, % | 62 | 60 | 59 | 57 | 57 | 54 | 53 | 52 | 49 | 49 |
| Regular use of aspirin/NSAIDs, % b | 46 | 49 | 52 | 55 | 61 | 46 | 50 | 52 | 54 | 56 |
| History of colonoscopy/sigmoidoscopy, % | 58 | 54 | 58 | 52 | 57 | 63 | 64 | 63 | 62 | 61 |
| Diabetes, % | 2 | 3 | 5 | 9 | 18 | 1 | 2 | 2 | 3 | 7 |
| Postmenopausal, % | 92 | 91 | 92 | 92 | 92 | - | - | - | - | - |
| Postmenopausal hormone use, % c | 38 | 39 | 35 | 34 | 27 | - | - | - | - | - |
| Alcohol consumption, g/day | 6.3 | 6.5 | 6.3 | 5.8 | 4.6 | 10.2 | 10.9 | 11.2 | 11.6 | 11.0 |
| Dietary intake | ||||||||||
| Folate, μg/day | 475 | 458 | 453 | 439 | 438 | 578 | 555 | 545 | 522 | 517 |
| Calcium, mg/day | 1 051 | 1027 | 1 016 | 993 | 984 | 960 | 939 | 927 | 915 | 932 |
| Vitamin D, IU/day | 380 | 370 | 369 | 363 | 362 | 457 | 440 | 432 | 418 | 419 |
| Total fibre, g/day | 18.0 | 17.6 | 17.4 | 17.1 | 16.9 | 23.7 | 22.6 | 22.1 | 21.6 | 21.1 |
| Total red meat, g/day | 70.0 | 74.4 | 76.6 | 79.4 | 84.3 | 62.8 | 68.0 | 72.3 | 76.6 | 83.8 |
| AHEI diet score | 46.8 | 45.6 | 45.0 | 44.2 | 43.2 | 44.1 | 42.5 | 41.6 | 40.7 | 39.5 |
AHEI, Alternative Healthy Eating Index; MET, metabolic equivalent; NSAID, non-steroidal anti-inflammatory drug.
a Updated information throughout follow-up was used to calculate the mean for continuous variables and percentage for categorical variables. All variables are age-standardized except age.
b Regular users are defined as ≥ 2 standard (325-mg) tablets of aspirin or ≥ 2 tablets of NSAIDs per week.
c Proportion of current postmenopausal hormone use is calculated among postmenopausal women only.
Cumulative average of body fat distribution measures and CRC risk
In women, waist circumference was positively associated with CRC risk in the multivariable-adjusted model ( Table 2 ). The measurement error-corrected HR per 10-cm increase of waist circumference was 1.07 (95% CI, 1.00–1.14, P for trend = 0.04).However, further adjustment for BMI attenuated this association to null (HR = 1.00, 95% CI, 0.90–1.11, P for trend = 0.90). A somewhat inverse association was found between hip circumference and CRC risk after adjusting for BMI. WHR was not associated with CRC incidence.
Table 2.
Risk of colorectal cancer according to quintiles of waist circumference, hip circumference and waist-to-hip ratio in women (Nurses’ Health Study, 1988–2010) and men (Health Professionals Follow-up Study, 1990–2010)
|
Women
|
Men
|
|||||||||
|---|---|---|---|---|---|---|---|---|---|---|
| Median | No. of cases | Age-adjusted HR (95% CI) a | Multivariable-adjusted HR (95% CI) b | Multivariable + BMI-adjusted HR (95% CI) c | Median | No. of cases | Age-adjusted HR (95% CI) a | Multivariable-adjusted HR (95% CI) b | Multivariable + BMI-adjusted HR (95% CI) c | |
| Waist circumference, cm | ||||||||||
| Quintile 1 | 68.6 | 190 | 1.00 (reference) | 1.00 (reference) | 1.00 (reference) | 85.7 | 93 | 1.00 (reference) | 1.00 (reference) | 1.00 (reference) |
| Quintile 2 | 75.4 | 193 | 0.94 (0.77–1.15) | 0.94 (0.77–1.15) | 0.89 (0.72–1.09) | 91.4 | 113 | 1.13 (0.86–1.49) | 1.11 (0.84–1.47) | 1.08 (0.81–1.43) |
| Quintile 3 | 81.3 | 220 | 0.98 (0.80–1.19) | 0.95 (0.78–1.16) | 0.86 (0.70–1.05) | 95.3 | 151 | 1.49 (1.15–1.94) | 1.48 (1.13–1.92) | 1.39 (1.05–1.84) |
| Quintile 4 | 87.6 | 247 | 1.02 (0.85–1.24) | 1.00 (0.82–1.21) | 0.85 (0.68–1.05) | 100.0 | 185 | 1.63 (1.27–2.10) | 1.56 (1.20–2.02) | 1.43 (1.08–1.91) |
| Quintile 5 | 99.4 | 275 | 1.21 (1.00–1.46) | 1.15 (0.95–1.40) | 0.85 (0.66–1.11) | 108.6 | 217 | 1.98 (1.55–2.54) | 1.89 (1.46–2.45) | 1.64 (1.17–2.29) |
| P for trend | 0.02 | 0.04 | 0.90 | <0.001 | <0.001 | <0.001 | ||||
| Uncorrected HR (95% CI) per 10-cm increase | 1.07 (1.01–1.13) | 1.06 (1.00–1.12) | 1.01 (0.93–1.09) | 1.28 (1.19–1.38) | 1.28 (1.18–1.38) | 1.25 (1.12–1.40) | ||||
| Corrected HR (95% CI) per 10-cm increase d | 1.08 (1.01–1.15) | 1.07 (1.00–1.14) | 1.00 (0.90–1.11) | 1.31 (1.20–1.43) | 1.30 (1.19–1.42) | 1.27 (1.12–1.43) | ||||
| Hip circumference, cm | ||||||||||
| Quintile 1 | 91.4 | 196 | 1.00 (reference) | 1.00 (reference) | 1.00 (reference) | 93.3 | 114 | 1.00 (reference) | 1.00 (reference) | 1.00 (reference) |
| Quintile 2 | 96.5 | 224 | 1.08 (0.89–1.31) | 1.09 (0.90–1.33) | 1.02 (0.84–1.24) | 97.8 | 121 | 1.13 (0.88–1.47) | 1.13 (0.87–1.46) | 1.08 (0.83–1.40) |
| Quintile 3 | 101.0 | 241 | 1.05 (0.87–1.27) | 1.06 (0.88–1.29) | 0.92 (0.75–1.13) | 101.3 | 153 | 1.25 (0.98–1.60) | 1.23 (0.96–1.57) | 1.13 (0.87–1.46) |
| Quintile 4 | 106.7 | 219 | 1.10 (0.91–1.33) | 1.11 (0.91–1.35) | 0.88 (0.71–1.10) | 104.8 | 164 | 1.51 (1.18–1.92) | 1.46 (1.14–1.87) | 1.29 (0.98–1.70) |
| Quintile 5 | 115.1 | 243 | 1.15 (0.95–1.39) | 1.14 (0.93–1.39) | 0.73 (0.56–0.96) | 111.8 | 204 | 1.72 (1.36–2.16) | 1.64 (1.28–2.10) | 1.33 (0.97–1.82) |
| P for trend | 0.32 | 0.25 | 0.21 | <0.001 | <0.001 | 0.003 | ||||
| Uncorrected HR (95% CI) per 10‐cm increase | 1.03 (0.97–1.10) | 1.04 (0.97–1.11) | 0.94 (0.84–1.04) | 1.31 (1.19–1.44) | 1.30 (1.18–1.44) | 1.22 (1.07–1.40) | ||||
| Corrected HR (95% CI) per 10‐cm increase d | 1.04 (0.95–1.13) | 1.04 (0.96–1.14) | 0.91 (0.79–1.05) | 1.44 (1.25–1.66) | 1.44 (1.24–1.66) | 1.32 (1.09–1.59) | ||||
| Waist-to-hip ratio | ||||||||||
| Quintile 1 | 0.72 | 169 | 1.00 (reference) | 1.00 (reference) | 1.00 (reference) | 0.88 | 105 | 1.00 (reference) | 1.00 (reference) | 1.00 (reference) |
| Quintile 2 | 0.76 | 223 | 1.17 (0.96–1.43) | 1.15 (0.94–1.41) | 1.12 (0.92–1.38) | 0.91 | 119 | 1.08 (0.83–1.40) | 1.06 (0.82–1.39) | 1.04 (0.80–1.36) |
| Quintile 3 | 0.80 | 226 | 1.11 (0.91–1.35) | 1.07 (0.87–1.30) | 1.02 (0.83–1.24) | 0.94 | 158 | 1.47 (1.14–1.89) | 1.45 (1.13–1.87) | 1.38 (1.07–1.78) |
| Quintile 4 | 0.84 | 223 | 1.03 (0.84–1.27) | 0.98 (0.80–1.21) | 0.91 (0.74–1.12) | 0.97 | 175 | 1.27 (0.99–1.62) | 1.23 (0.96–1.58) | 1.14 (0.89–1.47) |
| Quintile 5 | 0.91 | 280 | 1.25 (1.03–1.51) | 1.17 (0.96–1.42) | 1.05 (0.86–1.29) | 1.01 | 199 | 1.57 (1.23–2.00) | 1.50 (1.18–1.92) | 1.33 (1.03–1.71) |
| P for trend | 0.02 | 0.09 | 0.30 | <0.001 | 0.002 | 0.05 | ||||
| Uncorrected HR (95% CI) per 0.1-unit increase | 1.10 (1.02–1.19) | 1.07 (0.99–1.16) | 1.05 (0.96–1.14) | 1.29 (1.13–1.48) | 1.25 (1.09–1.43) | 1.15 (1.00–1.33) | ||||
| Corrected HR (95% CI) per 0.1-unit increase d | 1.17 (1.02–1.34) | 1.11 (0.96–1.27) | 1.07 (0.92–1.23) | 1.51 (1.16–1.96) | 1.42 (1.10–1.84) | 1.24 (0.95–1.60) | ||||
CI, confidence interval; HR, hazard ratio.
a Age-adjusted estimates were calculated from Cox proportion hazards regression using age as the underlying time variable and stratified by calendar year of the current questionnaire cycle.
b Multivariable models were based on age-adjusted models with additional adjustment for height (continuous), family history of colorectal cancer (yes or no), pack-years of smoking (continuous), multivitamin use (yes or no), physical activity (in women: 0–2.9, 3.0–8.9, 9.0–17.9, 18–26.9 and ≥ 27.0 MET-h/week; in men: < 6.5, 6.5–16.7, 16.8–30.1, 30.2–53.3 and ≥ 53.4 MET-h/week), endoscopic screening (yes or no), regular use of aspirin/NSAIDs (yes or no), alcohol consumption (< 5.0, 5.0–9.9, 10.0–14.9, 15.0–29.9 and ≥ 30.0 g/day), calcium intake (in quartiles), and AHEI score (in quartiles). In women, postmenopausal status (yes or no) and hormone use (never, current and past users) were additionally adjusted.
c Further adjusted for body mass index (continuous).
d HR and 95% CI were corrected for measurement error in anthropometric assessments.
In men, we found a strong positive association of waist circumference, hip circumference and WHR with CRC risk ( Table 2 ). These associations were attenuated after adjusting for BMI and other covariates. The measurement error-corrected risk ratios (RRs) per 10-cm increase of waist circumference were1.30 (95% CI, 1.19–1.42, P for trend < 0.001) and 1.27 (95% CI, 1.12–1.43, P for trend < 0.001) before and after adjusting for BMI, respectively. We detected a sex difference in the BMI-adjusted association between waist circumference and CRC risk ( P < 0.001). We further stratified by age and observed similar associations among individuals younger than 65 and ≥65 years in each cohort ( P for interaction > 0.28, Supplementary Table 1 , available as Supplementary data at IJE online).
Figure 1 shows the joint association of BMI and waist circumference with CRC risk. No distinct pattern was detected in women; compared with women with low BMI and low waist circumference, those with BMI > 27.5 kg/m 2 had an elevated risk, among whom those in the third tertile of waist circumference had 1.28-fold increased risk of CRC (95% CI, 1.06–1.54). In men, increasing waist circumference was associated with a higher risk of CRC within each BMI group, whereas the association between BMI and CRC risk within each tertile of waist circumference was less striking. The HR was 1.78 (95% CI, 1.40–2.26) comparing men high in BMI and waist circumference with those low in both measures. P for interaction between BMI and waist circumference was 0.74 in women and 0.97 in men.
Figure 1.

Joint association of BMI and waist circumference with risk of colorectal cancer in women (A) and men (B). Participants were first categorized according to BMI (< 25, 25–27.5, ≥ 27.5 kg/m 2 ) and then within each BMI category they were further grouped by tertiles of waist circumference. The multivariable Cox proportion hazards regression models were used, as described in the footnote of Table 2 , with the individuals low in both BMI and waist circumference as the reference group.
No heterogeneity was detected according to tumour subsite ( Supplementary Tables 2 and Supplementary Data , available as Supplementary data at IJE online).
We did not find an interaction between body size measures and MHT use either, although the positive associations of waist circumference and WHR with CRC risk were restricted to women who never used MHT ( P for trend = 0.02 and 0.04, respectively; Supplementary Table 4 , available as Supplementary data at IJE online). We also classified women jointly according to MHT use and body fat distribution measures ( Supplementary Table 5 , available as Supplementary data at IJE online). The risk of CRC was generally low among current users of MHT and did not appreciably change with waist or hip measures, whereas the highest risk of CRC was found in women who never used MHT and had the highest waist or hip measurements.
Changes in body fat distribution and CRC risk
During the 10-year period in adulthood, waist circumference on average increased 8 cm in women and 3.1 cm in men; hip circumference increased 1.7 cm in women and 1.5 cm in men. Supplementary Table 6 (available as Supplementary data at IJE online) shows the baseline characteristics among participants who lost, maintained or gained waist circumference. Changes in waist circumference were positively correlated with changes in hip circumference, WHR and body weight ( r ranged from 0.25 to 0.78; Supplementary Table 7 , available as Supplementary data at IJE online).
Table 3 presents the associations with CRC risk for changes in waist circumference, hip circumference and WHR. We did not find any association in women. In contrast, gain of waist circumference was associated with an increased CRC risk in men ( P for trend = 0.03; P for heterogeneity by sex = 0.15). Compared with men who maintained their waist circumference, the RRs of CRC were 1.59 (95% CI, 1.01–2.49) for those who gained waist circumference ≥ 10 cm, and 0.76 (95% CI, 0.47–1.21) for those losing waist circumference ≥ 2 cm. As shown in Figure 2 , the relationship between waist circumference change and CRC risk appeared to be linear. The association did not appear to differ by baseline waist circumference ( P for interaction = 0.79 in women and 0.92 in men; Supplementary Table 8 , available as Supplementary data at IJE online).
Table 3.
Risk of colorectal cancer according to 10-year change of waist circumference, hip circumference and waist-to-hip ratio in women (Nurses’ Health Study, 1998–2010) and men (Health Professionals Follow-up Study, 1998–2010)
|
Women
|
Men
|
||||||||
|---|---|---|---|---|---|---|---|---|---|
| Category of change | Median | No. of cases | Age-adjusted HR (95% CI) a | Multivariable-adjusted HR (95% CI) b | Category of change | Median | No. of cases | Age-adjusted HR (95% CI) a | Multivariable-adjusted HR (95% CI) b |
| Waist change, cm | Waist change, cm | ||||||||
| Loss ≥ 3.0 | −5.1 | 15 | 0.97 (0.54–1.74) | 0.87 (0.48–1.57) | Loss ≥ 2.0 | −4.4 | 28 | 0.90 (0.57–1.43) | 0.76 (0.47–1.21) |
| Loss or gain < 3.0 | 0.6 | 59 | 1.00 (reference) | 1.00 (reference) | Loss or gain < 2.0 | 0.0 | 58 | 1.00 (reference) | 1.00 (reference) |
| Gain 3.0–7.9 | 5.1 | 58 | 0.93 (0.65–1.34) | 0.94 (0.65–1.35) | Gain 2.0–4.9 | 3.2 | 39 | 1.00 (0.66–1.50) | 1.03 (0.69–1.55) |
| Gain 8.0–15.9 | 11.4 | 58 | 1.06 (0.74–1.52) | 1.04 (0.72–1.49) | Gain 5.0–9.9 | 6.4 | 43 | 0.95 (0.64–1.41) | 0.92 (0.62–1.37) |
| Gain ≥ 16.0 | 21.6 | 49 | 1.22 (0.83–1.80) | 1.18 (0.80–1.74) | Gain ≥ 10.0 | 12.1 | 30 | 1.65 (1.05–2.58) | 1.59 (1.01–2.49) |
| P for trend | 0.35 | 0.34 | P for trend | 0.09 | 0.03 | ||||
| Per 10-cm gain | 1.07 (0.93–1.24) | 1.07 (0.93–1.24) | Per 10-cm gain | 1.27 (0.97–1.67) | 1.34 (1.03–1.74) | ||||
| Hip change, cm | Hip change, cm | ||||||||
| Loss ≥ 2.0 | −5.1 | 53 | 0.97 (0.67–1.40) | 0.90 (0.62–1.30) | Loss ≥ 1.0 | −3.2 | 53 | 1.13 (0.71–1.80) | 1.03 (0.65–1.65) |
| Loss or gain < 2.0 | 0.0 | 62 | 1.00 (reference) | 1.00 (reference) | Loss or gain < 1.0 | 0.0 | 28 | 1.00 (reference) | 1.00 (reference) |
| Gain 2.0–3.9 | 2.5 | 45 | 1.37 (0.93–2.00) | 1.38 (0.94–2.03) | Gain 1.0–1.9 | 1.3 | 22 | 1.25 (0.72–2.19) | 1.29 (0.74–2.25) |
| Gain 4.0–7.9 | 5.1 | 45 | 1.11 (0.76–1.63) | 1.09 (0.74–1.60) | Gain 2.0–5.9 | 3.8 | 62 | 1.44 (0.92–2.25) | 1.43 (0.91–2.24) |
| Gain ≥ 8.0 | 10.8 | 33 | 1.14 (0.73–1.78) | 1.10 (0.70–1.72) | Gain ≥ 6.0 | 8.3 | 31 | 1.40 (0.83–2.36) | 1.37 (0.81–2.31) |
| P for trend | 0.29 | 0.20 | P for trend | 0.14 | 0.06 | ||||
| Per 10-cm gain | 1.11 (0.91–1.36) | 1.14 (0.93–1.39) | Per 10-cm gain | 1.27 (0.93–1.73) | 1.34 (0.99–1.81) | ||||
| Waist-to-hip ratio change | Waist-to-hip ratio change | ||||||||
| Loss ≥ 0.02 | −0.04 | 23 | 0.86 (0.51–1.45) | 0.83 (0.49–1.40) | Loss ≥ 0.05 | −0.07 | 17 | 1.09 (0.62–1.90) | 0.90 (0.50–1.61) |
| Loss or gain < 0.02 | 0.00 | 49 | 1.00 (reference) | 1.00 (reference) | Loss 0.02–0.049 | −0.03 | 31 | 1.12 (0.72–1.75) | 1.06 (0.68–1.66) |
| Gain 0.02–0.049 | 0.03 | 53 | 1.15 (0.78–1.70) | 1.15 (0.78–1.69) | Loss or gain < 0.02 | 0.00 | 52 | 1.00 (reference) | 1.00 (reference) |
| Gain 0.05–0.09 | 0.07 | 44 | 0.85 (0.56–1.27) | 0.84 (0.56–1.26) | Gain 0.02–0.059 | 0.003 | 59 | 1.01 (0.70–1.47) | 1.06 (0.73–1.54) |
| Gain ≥ 0.10 | 0.16 | 68 | 1.18 (0.81–1.71) | 1.16 (0.80–1.68) | Gain ≥ 0.06 | 0.08 | 37 | 1.23 (0.80–1.88) | 1.32 (0.86–2.03) |
| P for trend | 0.82 | 0.85 | P for trend | 0.64 | 0.73 | ||||
| Per 0.1-unit gain | 1.02 (0.89–1.16) | 1.01 (0.89–1.16) | Per 0.1-unit gain | 0.96 (0.81–1.14) | 1.03 (0.86–1.24) | ||||
CI, confidence interval; HR, hazard ratio.
a Age-adjusted estimates were calculated from age-stratified Cox proportion hazards regression model.
b Multivariable estimates were based on age-adjusted models with additional adjustment for corresponding anthropometric measurements at baseline (continuous), height (continuous), family history of colorectal cancer (yes or no), pack-years of smoking (continuous), multivitamin use (yes or no), physical activity (in quartiles), endoscopic screening (yes or no), regular use of aspirin/NSAIDs (yes or no), alcohol consumption (in quartiles), calcium intake (in quartiles), and AHEI score (in quartiles). In women, postmenopausal status (yes or no) and hormone use (never, current and past users) were additionally adjusted.
Figure 2.
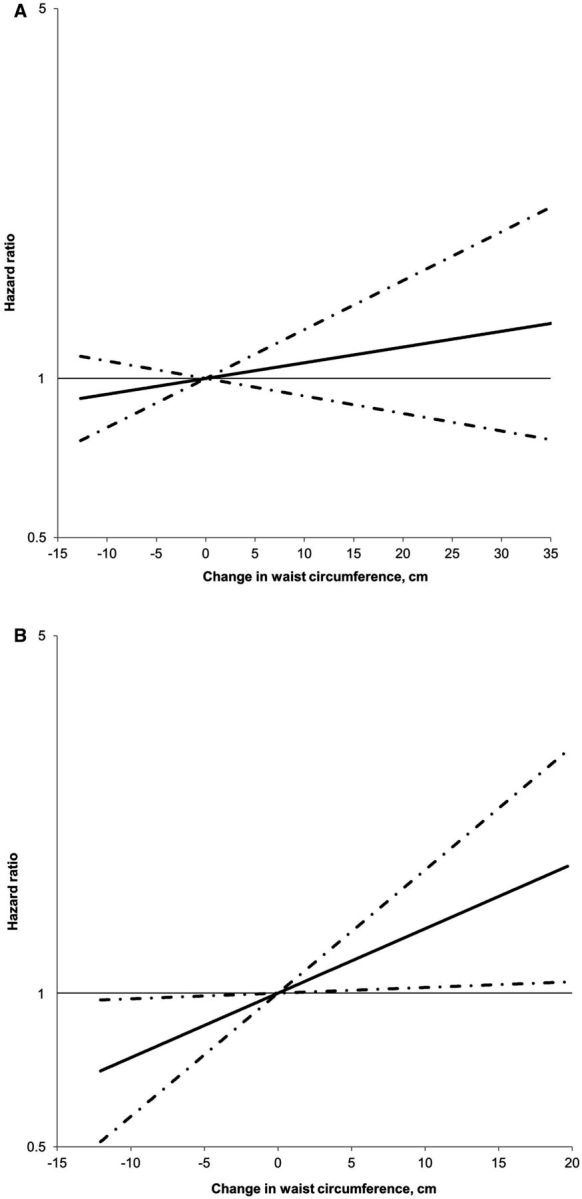
Ten-year waist circumference change in relation to risk of colorectal cancer in women (A) and men (B). HR was plotted on the logarithmic scale with a base of 10. Dashed lines represent 95% confidence intervals. Multivariable Cox proportion hazards regression models were used, as described in the footnote of Table 3 . No non-linearity was detected for either of the analyses. The P -values for the linear relationship were 0.34 in women and 0.03 in men.
To further examine whether the association for change in body fat distribution is independent of body weight change, we adjusted for weight change during the same period in the multivariable model in men. The association between waist circumference change and CRC did not appreciably change (HR per 10-cm gain: 1.38, 95% CI, 0.99–1.92, P for trend = 0.06).
Discussion
In this prospective study over 23 years of follow-up, we found that men with high waist circumference and WHR were at a higher risk of CRC. This finding extends our previous report which was based on only 5 years of follow-up. 5 In line with findings from other studies, 7,8,18,27 we also found that adjusting for BMI attenuated but did not eliminate these associations, suggesting an independent effect on CRC development of abdominal fatness beyond general obesity. At the same time, higher waist circumference was also associated with an increased CRC risk within each BMI group, even among men with BMI of < 25 kg/m 2 .
Compared with subcutaneous adipose tissue, visceral adipose tissue has been more strongly associated with unfavourable metabolic profiles, including hyperinsulinaemia, systemic inflammation, higher leptin level and lower adiponectin level, 28–30 all of which have been suggested as potential mechanisms that may underlie the association between obesity and CRC. 31 Insulin is an endogenous mitogen and directly increases the risk of tumorigenesis through increased cell proliferation and reduced apoptosis. 32 Hyperinsulinaemia also indirectly increases the bioavailability of insulin-like growth factor-1, a key promoter of tumour development. 32,33 In addition, adipose tissue secretes many signalling proteins and cytokines known as adipokines, which have been implicated in insulin resistance and tumour development. 34–38
In contrast to men, the findings in women were less pronounced. The positive association of waist circumference with CRC was attenuated to null after adjusting for BMI. These results are consistent with the notion that obesity poses lesser CRC risk in women than in men. Sex hormones might play a role in the observed sex difference in the strength of the obesity-CRC relationship. 39,40 Experimental evidence indicates an anti-cancer effect of estrogen through regulation of gene transcription and modulation of cellular processes involved in colorectal carcinogenesis. 41 In postmenopausal women, adipose tissue becomes the primary organ for estrogen production through aromatization of androstenedione to estrone. 42 Therefore, it has been hypothesized that a high level of bioavailable estrogen in obese women might counterbalance the detrimental effect of obesity on CRC development. 33
In women, abdominal obesity has been associated with CRC risk in some 8,11–15,17 but not other 18,19,27 studies. In contrast to our results, in the European Prospective Investigation Into Cancer and Nutrition (EPIC) study, 13 a positive association was found between WHR and CRC risk in women even after adjusting for BMI. One possible reason for the discrepant findings might be related to the different composition of premenopausal vs postmenopausal women between the two studies. In our study, over 90% of person-years of follow-up in women were postmenopausal, whereas this figure was approximately 50% in the EPIC study. Obesity has been more consistently associated with CRC risk in premenopausal than postmenopausal women, 43,44 possibly due to the lack of protection from endogenously produced estrogen in adipose tissue before the menopause. Interestingly, in both the current and EPIC studies, 13 the positive association of waist circumference and WHR with CRC in postmenopausal women was restricted to those who never used MHT. Given the potential preventive effect of MHT on CRC development, 45,46 it is possible that MHT use mitigates the pro-carcinogenic effect of adiposity in postmenopausal women.
Substantial changes in body composition occur with ageing. In particular, lean muscle mass typically peaks in the third to fourth decade of life and then declines steadily with advancing age, whereas fat mass, especially abdominal visceral fat, continuously increases with age. 47 Such changes in the distribution of body weight have been shown to predict the risk of type 2 diabetes, 48,49 a high-risk condition for CRC development. 50 However, to our knowledge, no study has yet assessed the potential risk of CRC associated with these changes because of the lack of repeated measurements of waist and hip circumferences over time. In the current study, we showed that in men accumulation of abdominal fat during adulthood, as assessed by increase in waist circumference, was positively related to CRC risk, whereas loss of waist circumference was associated with lower risk. These associations were independent of changes in body weight. This finding provides further support for the critical role of abdominal adiposity in CRC development in men. In contrast, we did not find any association between change in waist circumference and CRC risk in women. This may either reflect the insignificant impact of obesity on CRC occurrence in women, or be due to the lesser redistribution of body fat to the abdominal compartment in elderly women compared with men. 47,51
We did not find an independent association between change in hip circumference and CRC risk after adjusting for weight change. Because hip circumference not only measures lower-body fatness, but also reflects gluteal muscularity and pelvic width, it is possible that adjustment for weight change explains away the risk of fat accumulation conferred by increased hip girth, whereas other components captured by hip circumference change have a relatively neutral or even favourable metabolic effect. For WHR change, we did not observe any association with CRC risk, possibly due to the inherent difficulty in interpretation of this composite measure.
Our study has some limitations. First, anthropometric measurements were self-reported or recalled and thus subject to error. However, robust validity has been established in a previous validation study within the two cohorts, 24 and correction for measurement error strengthened the observed associations. Second, only a subset of participants provided repeated data on waist and hip circumference, and thus statistical power was limited for the analysis of change in body fat distribution. Third, our study participants were all health professionals and thus the findings may not be generalizable to the general population. However, it is unlikely that the observed relationship between body fat distribution and CRC differs substantially from the general population.
This study also has several strengths, including the two large well-established cohorts, long-term follow-up and detailed lifestyle data. Moreover, repeated measurements of waist and hip circumference provided a unique opportunity to examine the long-term influence of abdominal adiposity and the change of body fat distribution during adulthood on CRC risk.
In conclusion, our results indicate a positive association between abdominal adiposity and CRC risk. This association appears to be stronger and independent of overall obesity in men compared with women. Our findings also provide the first population-based evidence that increase in abdominal fatness during adulthood may be associated with higher CRC risk in men, thus highlighting the importance of maintaining a healthy waist throughout adulthood for CRC prevention.
Funding
This work was supported by the National Institutes of Health [UM1 CA186107, P01 CA87969, UM1 CA167552, P50 CA127003, R01 CA137178, R01 CA151993, R35 CA197735, K24 DK 098311, K07 CA190673 and 1U54CA155626] and by a grant from the Agrusa Fund for Colorectal Cancer Research. The funders had no role in: design or conduct of the study; collection, management, analysis or interpretation of the data; preparation, review or approval of the manuscript; or the decision to submit the manuscript for publication.
Supplementary Material
Acknowledgements
M.S. is a trainee of the Harvard Transdisciplinary Research Center on Energetics and Cancer (TREC). We would like to thank the participants and staff of the Nurses' Health Study and the Health Professionals Follow-up Study, for their valuable contributions as well as the following state cancer registries for their help: AL, AZ, AR, CA, CO, CT, DE, FL, GA, ID, IL, IN, IA, KY, LA, ME, MD, MA, MI, NE, NH, NJ, NY, NC, ND, OH, OK, OR, PA, RI, SC, TN, TX, VA, WA, WY. The authors assume full responsibility for analyses and interpretation of these data.
Conflict of interest: None declared.
Author contributions
Study concept and design: M.S., W.CW., E.L.G. Acquisition of data: M.S., A.T.C., K.W., S.O., C.S.F., E.L.G. Analysis and interpretation of data: M.S., F.B.H., D.S., K.W., W.C.W., E.L.G. Drafting of the manuscript: M.S. Critical revision of the manuscript for important intellectual content: F.B.H., D.S., A.T.C., K.W., W.C.W., E.L.G. Statistical analysis: M.S., D.S. Funding acquisition: A.T.C., W.C.W., E.L.G. Administrative, technical or material support: F.B.H., D.S., A.T.C., S.O., C.S.F., W.C.W., E.L.G. Study supervision: E.L.G.
References
- 1. Ferlay J, Soerjomataram I, Ervik M, et al. . Cancer Incidence and Mortality Worldwide: IARC CancerBase No. 11. GLOBOCAN 2012 v10 . Lyon, France: : International Agency for Research on Cancer; , 2013. . [Google Scholar]
- 2. World Cancer Research Fund / American Institute for Cancer Research . Food, Nutrition, Physical Activity, and the Prevention of Cancer: a Global Perspective . Washington DC: : AICR; , 2007. . [Google Scholar]
- 3. Arnold M, Pandeya N, Byrnes G, et al. . Global burden of cancer attributable to high body-mass index in 2012: a population-based study . Lancet Oncology 2015. ; 16 : 36 – 46 . [DOI] [PMC free article] [PubMed] [Google Scholar]
- 4. Snijder MB, van Dam RM, Visser M, Seidell JC . What aspects of body fat are particularly hazardous and how do we measure them? . Int J Epidemiol 2006. ; 35 : 83 – 92 . [DOI] [PubMed] [Google Scholar]
- 5. Giovannucci E, Ascherio A, Rimm EB, Colditz GA, Stampfer MJ, Willett WC . Physical activity, obesity, and risk for colon cancer and adenoma in men . Ann Intern Med 1995. ; 122 : 327 – 34 . [DOI] [PubMed] [Google Scholar]
- 6. Martinez ME, Giovannucci E, Spiegelman D, Hunter DJ, Willett WC, Colditz GA . Leisure-time physical activity, body size, and colon cancer in women. Nurses' Health Study Research Group . J Natl Cancer Inst 1997. ; 89 : 948 – 55 . [DOI] [PubMed] [Google Scholar]
- 7. MacInnis RJ, English DR, Hopper JL, Haydon AM, Gertig DM, Giles GG . Body size and composition and colon cancer risk in men . Cancer Epidemiol Biomarkers Prev 2004. ; 13 : 553 – 59 . [PubMed] [Google Scholar]
- 8. Moore LL, Bradlee ML, Singer MR, et al. . BMI and waist circumference as predictors of lifetime colon cancer risk in Framingham Study adults . Int J Obes Relat Metab Disord 2004. ; 28 : 559 – 67 . [DOI] [PubMed] [Google Scholar]
- 9. Ahmed RL, Schmitz KH, Anderson KE, Rosamond WD, Folsom AR . The metabolic syndrome and risk of incident colorectal cancer . Cancer 2006. ; 107 : 28 – 36 . [DOI] [PubMed] [Google Scholar]
- 10. Larsson SC, Rutegard J, Bergkvist L, Wolk A . Physical activity, obesity, and risk of colon and rectal cancer in a cohort of Swedish men . Eur J Cancer 2006. ; 42 : 2590 – 97 . [DOI] [PubMed] [Google Scholar]
- 11. MacInnis RJ, English DR, Haydon AM, Hopper JL, Gertig DM, Giles GG . Body size and composition and risk of rectal cancer (Australia) . Cancer Causes Control 2006. ; 17 : 1291 – 97 . [DOI] [PubMed] [Google Scholar]
- 12. MacInnis RJ, English DR, Hopper JL, Gertig DM, Haydon AM, Giles GG . Body size and composition and colon cancer risk in women . Int J Cancer 2006. ; 118 : 1496 – 500 . [DOI] [PubMed] [Google Scholar]
- 13. Pischon T, Lahmann PH, Boeing H, et al. . Body size and risk of colon and rectal cancer in the European Prospective Investigation Into Cancer and Nutrition (EPIC) . J Natl Cancer Inst 2006. ; 98 : 920 – 31 . [DOI] [PubMed] [Google Scholar]
- 14. Wang Y, Jacobs EJ, Patel AV, et al. . A prospective study of waist circumference and body mass index in relation to colorectal cancer incidence . Cancer Causes Control 2008. ; 19 : 783 – 92 . [DOI] [PubMed] [Google Scholar]
- 15. Oxentenko AS, Bardia A, Vierkant RA, et al. . Body size and incident colorectal cancer: a prospective study of older women . Cancer Prev Res (Phila) 2010. ; 3 : 1608 – 20 . [DOI] [PMC free article] [PubMed] [Google Scholar]
- 16. Li H, Yang G, Xiang YB, et al. . Body weight, fat distribution and colorectal cancer risk: a report from cohort studies of 134 255 Chinese men and women . Int J Obes (Lond) 2012. ; 37 : 783 – 89 . [DOI] [PMC free article] [PubMed] [Google Scholar]
- 17. Park JY, Mitrou PN, Keogh RH, Luben RN, Wareham NJ, Khaw KT . Self-reported and measured anthropometric data and risk of colorectal cancer in the EPIC-Norfolk study . Int J Obes (Lond) 2012. ; 36 : 107 – 18 . [DOI] [PubMed] [Google Scholar]
- 18. Keimling M, Renehan AG, Behrens G, et al. . Comparison of associations of body mass index, abdominal adiposity, and risk of colorectal cancer in a large prospective cohort study . Cancer Epidemiol Biomarkers Prev 2013. ; 22 : 1383 – 94 . [DOI] [PubMed] [Google Scholar]
- 19. Kabat GC, Heo M, Wactawski-Wende J, et al. . Body fat and risk of colorectal cancer among postmenopausal women . Cancer Causes Control 2013. ; 24 : 1197 – 205 . [DOI] [PubMed] [Google Scholar]
- 20. Rimm EB, Giovannucci EL, Willett WC, et al. . Prospective study of alcohol consumption and risk of coronary disease in men . Lancet 1991. ; 338 : 464 – 68 . [DOI] [PubMed] [Google Scholar]
- 21. Colditz GA, Manson JE, Hankinson SE . The Nurses' Health Study: 20-year contribution to the understanding of health among women . J Womens Health 1997. ; 6 : 49 – 62 . [DOI] [PubMed] [Google Scholar]
- 22. Greene FL, Page DL, Fleming ID, Fritz A, Balch CM. (eds). AJCC Cancer Staging Handbook ( 6th Edition ). New York, NY: : Springer; , 2002. . [Google Scholar]
- 23. Durrleman S, Simon R . Flexible regression models with cubic splines . Stat Med 1989. ; 8 : 551 – 61 . [DOI] [PubMed] [Google Scholar]
- 24. Rimm EB, Stampfer MJ, Colditz GA, Chute CG, Litin LB, Willett WC . Validity of self-reported waist and hip circumferences in men and women . Epidemiology 1990. ; 1 : 466 – 73 . [DOI] [PubMed] [Google Scholar]
- 25. Liao X, Zucker DM, Li Y, Spiegelman D . Survival analysis with error-prone time-varying covariates: a risk set calibration approach . Biometrics 2011. ; 67 : 50 – 58 . [DOI] [PMC free article] [PubMed] [Google Scholar]
- 26. Lin J, Zhang SM, Cook NR, Rexrode KM, Lee IM, Buring JE . Body mass index and risk of colorectal cancer in women (United States) . Cancer Causes Control 2004. ; 15 : 581 – 89 . [DOI] [PubMed] [Google Scholar]
- 27. Li H, Yang G, Xiang YB, et al. . Body weight, fat distribution and colorectal cancer risk: a report from cohort studies of 134 255 Chinese men and women . Int J Obes (Lond) 2013. ; 37:783 – 89 . [DOI] [PMC free article] [PubMed] [Google Scholar]
- 28. Freedland ES . Role of a critical visceral adipose tissue threshold (CVATT) in metabolic syndrome: implications for controlling dietary carbohydrates: a review . Nutr Metab (Lond) 2004. ; 1 : 12 . [DOI] [PMC free article] [PubMed] [Google Scholar]
- 29. Hanley AJ, McKeown-Eyssen G, Harris SB, et al. . Cross-sectional and prospective associations between abdominal adiposity and proinsulin concentration . J Clin Endocrinol Metab 2002. ; 87 : 77 – 83 . [DOI] [PubMed] [Google Scholar]
- 30. Neeland IJ, Ayers CR, Rohatgi AK, et al. . Associations of visceral and abdominal subcutaneous adipose tissue with markers of cardiac and metabolic risk in obese adults . Obesity (Silver Spring) 2013. ; 21 : E439 – 47 . [DOI] [PMC free article] [PubMed] [Google Scholar]
- 31. Calle EE, Kaaks R . Overweight, obesity and cancer: Epidemiological evidence and proposed mechanisms . Nat Rev Cancer 2004. ; 4 : 579 – 91 . [DOI] [PubMed] [Google Scholar]
- 32. Pollak M . The insulin and insulin-like growth factor receptor family in neoplasia: an update . Nat Rev Cancer 2012. ; 12 : 159 – 69 . [DOI] [PubMed] [Google Scholar]
- 33. Giovannucci E . Metabolic syndrome, hyperinsulinemia, and colon cancer: a review . Am J Clin Nutr 2007. ; 86 : s836 – 42 . [DOI] [PubMed] [Google Scholar]
- 34. Vansaun MN . Molecular pathways: adiponectin and leptin signaling in cancer . Clin Cancer Res 2013. ; 19 : 1926 – 32 . [DOI] [PMC free article] [PubMed] [Google Scholar]
- 35. Chan AT, Ogino S, Giovannucci EL, Fuchs CS . Inflammatory markers are associated with risk of colorectal cancer and chemopreventive response to anti-inflammatory drugs . Gastroenterology 2011. ; 140 : 799 – 808 . [DOI] [PMC free article] [PubMed] [Google Scholar]
- 36. Song M, Wu K, Ogino S, Fuchs CS, Giovannucci EL, Chan AT . A prospective study of plasma inflammatory markers and risk of colorectal cancer in men . Br J Cancer 2013. ; 108 : 1891 – 98 . [DOI] [PMC free article] [PubMed] [Google Scholar]
- 37. Ho GY, Wang T, Gunter MJ, et al. . Adipokines linking obesity with colorectal cancer risk in postmenopausal women . Cancer Res 2012. ; 72 : 3029 – 37 . [DOI] [PMC free article] [PubMed] [Google Scholar]
- 38. Stattin P, Lukanova A, Biessy C, et al. . Obesity and colon cancer: does leptin provide a link? . Int J Cancer 2004. ; 109 : 149 – 52 . [DOI] [PubMed] [Google Scholar]
- 39. Koo JH, Leong RW . Sex differences in epidemiological, clinical and pathological characteristics of colorectal cancer . J Gastroenterol Hepatol 2010. ; 25 : 33 – 42 . [DOI] [PubMed] [Google Scholar]
- 40. Lin JH, Zhang SM, Rexrode KM, et al. . Association between sex hormones and colorectal cancer risk in men and women . Clin Gastroenterol Hepatol 2013. ; 11 : 419 – 24 e1 . [DOI] [PMC free article] [PubMed] [Google Scholar]
- 41. Barzi A, Lenz AM, Labonte MJ, Lenz HJ . Molecular pathways: Estrogen pathway in colorectal cancer . Clin Cancer Res 2013. ; 19 : 5842 – 48 . [DOI] [PMC free article] [PubMed] [Google Scholar]
- 42. Liedtke S, Schmidt ME, Vrieling A, et al. . Postmenopausal sex hormones in relation to body fat distribution . Obesity (Silver Spring) 2012. ; 20 : 1088 – 95 . [DOI] [PubMed] [Google Scholar]
- 43. Reeves GK, Pirie K, Beral V, Green J, Spencer E, Bull D . Cancer incidence and mortality in relation to body mass index in the Million Women Study: cohort study . BMJ 2007. ; 335 : 1134 . [DOI] [PMC free article] [PubMed] [Google Scholar]
- 44. Ning Y, Wang L, Giovannucci EL . A quantitative analysis of body mass index and colorectal cancer: findings from 56 observational studies . Obes Rev 2010. ; 11 : 19 – 30 . [DOI] [PubMed] [Google Scholar]
- 45. Lin KJ, Cheung WY, Lai JY, Giovannucci EL . The effect of estrogen vs. combined estrogen-progestogen therapy on the risk of colorectal cancer . Int J Cancer 2012. ; 130 : 419 – 30 . [DOI] [PubMed] [Google Scholar]
- 46. Chlebowski RT, Wactawski-Wende J, Ritenbaugh C, et al. . Estrogen plus progestin and colorectal cancer in postmenopausal women . N Engl J Med 2004. ; 350 : 991 – 1004 . [DOI] [PubMed] [Google Scholar]
- 47. Seidell JC, Visscher TL . Body weight and weight change and their health implications for the elderly . Eur J Clin Nutr 2000. ; 54(Suppl 3) : S33 – 39 . [DOI] [PubMed] [Google Scholar]
- 48. Wander PL, Boyko EJ, Leonetti DL, McNeely MJ, Kahn SE, Fujimoto WY . Change in visceral adiposity independently predicts a greater risk of developing type 2 diabetes over 10 years in Japanese Americans . Diabetes Care 2013. ; 36 : 289 – 93 . [DOI] [PMC free article] [PubMed] [Google Scholar]
- 49. Koh-Banerjee P, Wang Y, Hu FB, Spiegelman D, Willett WC, Rimm EB . Changes in body weight and body fat distribution as risk factors for clinical diabetes in US men . Am J Epidemiol 2004. ; 159 : 1150 – 59 . [DOI] [PubMed] [Google Scholar]
- 50. Giovannucci E, Harlan DM, Archer MC, et al. . Diabetes and cancer: a consensus report . CA Cancer J Clin 2010. ; 60 : 207 – 21 . [DOI] [PubMed] [Google Scholar]
- 51. Hughes VA, Frontera WR, Roubenoff R, Evans WJ, Singh MA . Longitudinal changes in body composition in older men and women: role of body weight change and physical activity . Am J Clin Nutr 2002. ; 76 : 473 – 81 . [DOI] [PubMed] [Google Scholar]
Associated Data
This section collects any data citations, data availability statements, or supplementary materials included in this article.