

White matter structures near the subthalamic nucleus (STN) have been implicated in the therapeutic benefits of DBS in Parkinson’s disease. Vanegas-Arroyave et al. evaluate the connectivity patterns of effective DBS contacts, and suggest that modulation of pathways involving the superior frontal gyrus and the thalamus contributes to the benefits observed with STN DBS.
Keywords: deep brain stimulation, subthalamic nucleus, Parkinson’s disease, tractography
White matter structures near the subthalamic nucleus (STN) have been implicated in the therapeutic benefits of DBS in Parkinson’s disease. Vanegas-Arroyave et al. evaluate the connectivity patterns of effective DBS contacts, and suggest that modulation of pathways involving the superior frontal gyrus and the thalamus contributes to the benefits observed with STN DBS.
Abstract
Deep brain stimulation therapy is an effective symptomatic treatment for Parkinson’s disease, yet the precise mechanisms responsible for its therapeutic effects remain unclear. Although the targets of deep brain stimulation are grey matter structures, axonal modulation is known to play an important role in deep brain stimulation’s therapeutic mechanism. Several white matter structures in proximity to the subthalamic nucleus have been implicated in the clinical benefits of deep brain stimulation for Parkinson’s disease. We assessed the connectivity patterns that characterize clinically beneficial electrodes in Parkinson’s disease patients, after deep brain stimulation of the subthalamic nucleus. We evaluated 22 patients with Parkinson’s disease (11 females, age 57 ± 9.1 years, disease duration 13.3 ± 6.3 years) who received bilateral deep brain stimulation of the subthalamic nucleus at the National Institutes of Health. During an initial electrode screening session, one month after deep brain stimulation implantation, the clinical benefits of each contact were determined. The electrode was localized by coregistering preoperative magnetic resonance imaging and postoperative computer tomography images and the volume of tissue activated was estimated from stimulation voltage and impedance. Brain connectivity for the volume of tissue activated of deep brain stimulation contacts was assessed using probabilistic tractography with diffusion-tensor data. Areas most frequently connected to clinically effective contacts included the thalamus, substantia nigra, brainstem and superior frontal gyrus. A series of discriminant analyses demonstrated that the strength of connectivity to the superior frontal gyrus and the thalamus were positively associated with clinical effectiveness. The connectivity patterns observed in our study suggest that the modulation of white matter tracts directed to the superior frontal gyrus and the thalamus is associated with favourable clinical outcomes and may contribute to the therapeutic effects of deep brain stimulation. Our method can be further developed to reliably identify effective deep brain stimulation contacts and aid in the programming process.
Introduction
Deep brain stimulation (DBS) is an effective therapy for the treatment of Parkinson’s disease and other neurological conditions. Although clinically effective stimulation targets such as the subthalamic nucleus (STN) and the globus pallidus pars interna have been established (Wagle Shukla and Okun, 2014), the precise mechanisms responsible for the therapeutic effects of DBS remain unclear. While targets consist of grey matter structures, DBS predominantly activates axons rather than cell bodies (McIntyre et al., 2004). Therefore, white matter tracts near the deep nuclei may be even more relevant.
A promising method, therefore, for understanding DBS is diffusion tensor imaging (DTI). DTI is a MRI technique that allows for non-invasive approximation of white matter anatomical pathways, based on the diffusion of water molecules through tissue (Pierpaoli and Basser, 1996; Jones, 2008). The use of this modality has recently been implemented for the recognition of specific white matter bundles associated with the clinical benefits of DBS in movement disorders (Coenen et al., 2014; Rozanski et al., 2014). In addition, DTI has been used to identify specific white matter tracts associated with a favourable response of major depression to DBS (Riva-Posse et al., 2014). These data raise the possibility that optimal electrode implantation and stimulation parameter selection for DBS may critically rely on the accurate identification of relevant white matter networks. However, tractography studies in DBS for Parkinson’s disease have so far been limited to the evaluation and targeting of specific white matter tracts effective for tremor control (Coenen et al., 2014).
Initial DBS programming sessions are often time consuming, involving the screening of individual electrodes at progressively higher stimulation amplitudes to determine the presence of both clinical benefits and side effects (Volkmann et al., 2006). Thus, the success of DBS therapy depends not only on an appropriate electrode placement but also on the programmer’s expertise and the patient’s ability to cooperate throughout an electrode screening session. The characterization of clinically beneficial networks using tractography provides a potential opportunity to facilitate the optimization of DBS programming through the development of imaging-based electrode selection tools. In addition, a better understanding of the specific neuronal connectivity patterns associated with favourable clinical outcomes in Parkinson’s disease patients treated with DBS, could add to the knowledge of the basal ganglia pathophysiology and the potential mechanisms of action of DBS in Parkinson’s disease.
By using preoperative DTI-based tractography, we aimed to characterize the specific stimulator-neuronal connectivity associated with clinically effective contacts in patients with Parkinson’s disease after STN DBS. We then assessed if the strength of association with areas of relevant connectivity was indicative of clinical effectiveness.
Materials and methods
Subjects
Twenty-two patients with idiopathic Parkinson’s disease who received bilateral STN DBS surgery at the National Institutes of Health between 2011 and 2014 were included in the study, on a consecutive basis. All patients were assessed by a movement disorders neurologist and met United Kingdom Parkinson’s Disease Society Brain Bank Criteria for the diagnosis of idiopathic Parkinson’s disease (Hughes et al., 1992) and Core Assessment Program for Surgical Interventional Therapies criteria for the surgical treatment of Parkinson’s disease (Defer et al., 1999). Patients underwent preoperative DBS screening including brain MRI, neurological examination, complete Unified Parkinson’s Disease Rating Scale (UPDRS) with motor part III scoring in the OFF and ON medication states, and neuropsychological evaluation. This study was conducted under National Institutes of Health Institutional Review Board-approved protocols, and informed consent was obtained from all patients.
Surgical procedure
Based on the Schaltenbrand–Wahren atlas, indirect targeting coordinates were determined 3 mm posterior to the midcommissural point, 12 mm lateral and 5 mm inferior to the midcommisural line, corresponding to the ventral border of the STN. Direct targeting was then performed by visualization of the STN on preoperative MRI (coregistered T1- and T2-weighted MRI to CT images using Stealth Station i7, Medtronic) and intraoperatively using microelectrode recordings. All patients underwent DBS surgery after an overnight medication withdrawal (12 h after the last dose of dopaminergic medication). Three tungsten microelectrodes were inserted simultaneously for target localization. Final trajectory and depth of lead placement were selected using intraoperative electrophysiology and test stimulation. All patients were implanted with DBS Lead Model 3389 (Medtronic).
Deep brain stimulation programming and patient follow-up
One month after implantation of the DBS leads, all patients underwent an initial programming session performed by a movement disorders neurologist, in the OFF medication state (Volkmann et al., 2006). Monopolar screening was performed for each of the four contacts on each lead. The stimulation amplitude was gradually increased to determine the limits of each contact’s therapeutic window, at predetermined pulse width and frequency. All monopolar screening was performed with pulse width set at 60 ms while stimulation frequency ranged from 130 to 160 Hz depending on the presence and predominance of tremor. Window entry was defined as the voltage where clinical benefit was first observed for each patient’s predominant parkinsonian signs (tremor, rigidity or bradykinesia). Window exit was defined as the voltage where side effects occurred (or as 6.0 V if no side effects were observed). The window size was determined by subtracting the window entry from the window exit.
As previously described by others (Volkmann et al., 2006), the contact with the largest therapeutic window was selected as the stimulating contact for chronic stimulation. In cases where two or more contacts demonstrated similarly large therapeutic windows, the stimulating contact was chosen arbitrarily based on the magnitude of clinical improvement observed during examination. Contacts with a therapeutic window but not selected for chronic stimulation, were considered as potential contacts. If no therapeutic window was identified on any of the four lead contacts, patients were programmed on a bipolar configuration. For patients whose parkinsonian signs in the less affected side were not consistent to establish a therapeutic window, only the threshold for side effects was targeted. Individual DBS lead therapeutic impedances were recorded for the stimulating contact after the final setting was determined.
Follow-up visits at 3 and 6 months postoperatively included neurological examination, programming optimization and UPDRS scoring in the ON medication–on stimulation states. A complete record of the patient’s dopaminergic medication regimen was also obtained at each visit and converted to a standard value of levodopa equivalent daily dose (Tomlinson et al., 2010).
Electrode discrimination
According to the therapeutic window obtained during the initial programming session, contacts were discriminated based on the observed clinical effectiveness in monopolar stimulation. All contacts with a therapeutic window were defined as clinically effective contacts. This group included stimulating contacts and potential contacts (Fig. 1). Contacts without a therapeutic window, causing exclusively side effects, were defined as non-effective contacts. This group included contacts that did not demonstrate clinical benefits during the initial programming session.
Figure 1.

Electrode discrimination. The electrode discriminations of three individual leads (A–C) are displayed for illustration purposes. Contacts were classified as stimulating contact (SC), potential contact (PC) or non-effective (NE) contact, based on their therapeutic window sizes. The y-axis represents the voltage of monopolar stimulation at the initial programming session. x-axis label represents each contact on monopolar stimulation. Grey = no clinical effect was observed; cyan = therapeutic window between window entry and window exit voltages; orange = voltage above window exit, once side effects were observed.
Image processing and tractography estimation
Image acquisition
All patients underwent preoperative MRI on a 3.0 T scanner (Philips Achieva XT) 1 day before surgery, in the ON medication state. Preoperative MRI included T1-weighted turbo field echo, T2-weighted turbo spin echo and high-angle echo planar diffusion weighted image sequences. The diffusion weighted image sequences were acquired with the following parameters: repetition time: 9776.51 ms, echo time: 65 ms, slice thickness: 2.00 mm, spacing between slices: 2.00 mm, echo train length: 59, field of view: 224 mm2 (in-plane resolution 2.0 × 2.0 mm2), flip angle: 90°, acquisition matrix: 112 × 112 with 78 axial locations, b = 1000 s/mm2, 1 b0 volume, 32 non-collinear gradient directions, and total acquisition time: 6 min 48 s.
Postoperative imaging included T1-weighted fast-field-echo MRI at 1.5 T (Philips Achieva XT) and head CT (Siemens SOMATOM), within 3 to 7 days after surgery.
Image processing
Our data were processed using DBSproc, an open source pipeline for DBS electrode localization and tractographic analysis, available in the Analysis of Functional NeuroImages (AFNI) distribution (Lauro et al., 2016). Briefly, the anterior and posterior commissure landmarks were manually defined on the T2-weighted preoperative volume using the Medical Image Processing, Analyzing and Visualization software package (McAuliffe et al., 2001; Bazin et al., 2007); http://mipav.cit.nih.gov. All volumes were rigid body transformed to create a horizontal anterior commissure–posterior commissure line and a vertical midsagittal plane with the anterior commissure as its origin.
Diffusion images were motion-, eddy-, and echo-planar imaging distortion-corrected, and registered to the anterior commissure-posterior commissure aligned T2-weighted volume using standard tools within the TORTOISE software package (Pierpaoli et al., 2010); https://science.nichd.nih.gov/confluence/display/nihpd/TORTOISE. Diffusion tensors and their associated parameters (fractional anisotropy, principal directions, eigen values) were estimated non-linearly from TORTOISE-processed diffusion data using Functional and Tractographic Connectivity Analysis Toolbox (FATCAT) (Taylor and Saad, 2013), within AFNI (Cox, 1996); http://afni.nimh.nih.gov. Uncertainty within fractional anisotropy and principal direction datasets, necessary for probabilistic tractography, was also calculated for probabilistic tractography using 500 jackknife-resampling iterations.
As part of DBSproc, preoperative MRI, postoperative MRI and CT images were first registered to patient-specific DTI space by executing the @DBSproc1 script. Quality control of image registrations was performed by visual inspection. DBS leads were then automatically identified from CT volume and contacts were localized using @DBSproc2. Specifically, lead volumes were reconstructed using SUMA software (Saad and Reynolds, 2012); http://afni.nimh.nih.gov, based on their topological characteristics. Electrode centroid coordinates were automatically calculated from predefined tip to contact distances and their locations were then evaluated in relation to the central mass of the STN. The STN was defined for each subject using the Talairach-Tournoux atlas included in the AFNI distribution.
Grey matter regions of interest for tractography analysis were segmented from DTI-registered preoperative T1-weighted volumes with the FreeSurfer software package (Fischl, 2012); http://surfer.nmr.mgh.harvard.edu. We used the ‘aparc+aseg’ atlas from each patient’s segmentation data, which contained 89 grey matter regions of interest. We used the Talairach-Tournoux atlas to define additional deep nuclei regions of interest within the labelled ventral diencephalon. Specific subnuclei added to the segmented brain included the red nucleus, substantia nigra, STN and hypothalamus. Specifically, each patient’s preoperative T1-weighted volume was non-linearly registered to the standard Talairach space. The resultant transformations were inverted and applied to the selected regions of interest in the standard space to bring regions of interest to patient-specific space. All regions of interest were inflated to the neighbouring voxels including faces and edges, with a stop criterion at neighbour regions of interest or fractional anisotropy >0.2.
Tractography estimation
The volume of tissue activated (VTA) was used to represent each contact’s effective stimulation volume as a region of interest. VTA was estimated as a sphere centred at the contact’s centroid coordinate with its radius calculated from individual lead impedance and window entry voltage (Mädler and Coenen, 2012). Probabilistic tractography was used to determine the number of tracts from each VTA, at entry voltage, to grey matter regions of interest using FATCAT (Taylor and Saad, 2013). Default tracking parameters were used (fractional anisotropy >0.2, turning angle <60°, keeping tracts with length >20 mm, eight seeds per voxel) with 5000 Monte Carlo iterations. To normalize for differences in voltage and VTA volume, we expressed connectivity strength as a fraction of the total number of tracts from the VTA to each region of interest.
Connectivity analysis
Group analysis
To characterize the connectivity of all clinically effective contacts (stimulating contacts and potential contacts), we performed a group analysis to determine the brain regions frequently associated with effective stimulation. Tracts from each clinically effective contact were converted to binary values for each brain region of interest. A value of 1 was assigned for the presence of connectivity from a contact’s VTA to a brain region of interest (a threshold of tracts >1% of all the streamlines from the VTA was used) and a value of 0 was assigned for the absence of tracts (<1% of total streamlines). Thus, the frequency of connectivity across all clinically effective contacts was obtained from the binarized results for each region of interest. Subcortical regions with frequencies of connectivity >0.85 and cortical regions with frequencies of connectivity >0.5 were considered relevant. A lower threshold was used to select relevant ipsilateral cortical areas given the limitations of DTI at delineating long-range anatomical connections and specifically superficial cortical projections (Reveley et al., 2015).
Individual lead analysis
The most frequently connected regions of interest from the group analysis were selected for post hoc within-lead discriminant analyses. Leads that had exclusively clinically effective contacts were not included. We assessed whether connectivity strength to each of these relevant regions could be an indicator of clinical effectiveness. Specifically, for each of these regions of interest, we tested the hypothesis that the electrode with the strongest connectivity within each lead is a clinically effective contact. We defined the discriminant power as the positive predictive value of each region of interest.
For regions found to be positively associated with clinical effectiveness, we then assessed whether the connectivity strength of the clinically effective contacts was higher than that of the non-effective contacts. See statistical analysis.
Statistical analysis
Demographic and clinical data were examined for normality (Shapiro-Wilk test). Normally distributed data were analysed with parametric tests (paired t-test); non-normally distributed data were analysed with non-parametric tests (paired Wilcoxon rank-sum test).
We performed within-lead discriminant analyses to investigate the association between clinical effectiveness and contact strength of connectivity to relevant regions. For this purpose, we tested the alternative hypothesis that identifying clinically effective contacts based on their strength of connectivity was better than chance. We evaluated the statistical significance with a Poisson binomial test with chance probabilities for the trials (each lead was a trial; chance probability of success for lead that has three non-effective contacts is 0.25, that of lead that has two non-effective contacts is 0.5 and that of lead that has one non-effective contact is 0.75). Furthermore, an odds ratio (OR) was obtained for each region of interest, using electrode connectivity strength as a measure of exposure and clinical effectiveness or ineffectiveness as the outcome.
For each lead included in the above analysis, we averaged the connectivity strength of all clinically effective contacts and compared it with that of non-effective contacts. A paired Wilcoxon rank-sum test was used given the variability of connectivity strength across subjects. All calculations were performed using SPSS® (Version 20; Chicago, IL, USA).
Results
General clinical outcomes
Twenty-two patients (11 females, age 57 ± 9.1 years, disease duration 13.3 ± 6.3 years) with idiopathic Parkinson’s disease who underwent bilateral STN DBS surgery at the National Institutes of Health were included in this study. Clinical characteristics at baseline, 3 and 6 months postoperatively are described in Table 1. There were no significant changes in UPDRS part II at 3 and 6 months. Similarly, comparisons between preoperative ON medication and postoperative ON medication–on stimulation UPDRS part III at 3 and 6 months demonstrated no statistically significant changes. All patients demonstrated a significant improvement of the UPDRS part IV and a significant reduction of the total requirement of dopaminergic medications expressed as levodopa equivalent daily dose at 3 and 6 months postoperatively.
Table 1.
Comparisons between baseline and clinical outcomes at 3 and 6 months postoperatively
| Baseline | 3 months | 6 months | |
|---|---|---|---|
| UPDRS I | 2.9 (2.8) | 1.5 (1.3)* | 2.9 (2.5) |
| UPDRS II | 9.2 (9.4) | 9.4 (6.3) | 9.6 (5) |
| UPDRS III ON medication | 19.9 (7) | 19.2 (5.9) | 19.5 (6.7) |
| UPDRS IV | 8.8 (3.6) | 3.2 (1.8)** | 3.1 (2.4)*** |
| LEDD | 1059 (466) | 412 (293)** | 398 (253)*** |
Data are presented as mean (SD). P-values were calculated using a paired Wilcoxon rank-sum test.
*P = 0.019; baseline versus 3 months postoperatively.
**P < 0.0001; baseline versus 3 months postoperatively.
***P < 0.0001; baseline versus 6 months postoperatively. LEDD = levodopa equivalent daily dose.
Postoperative stereotactic stimulator tip coordinates in reference to the mid-commissural point were x = 9.7 ± 1.3 [mean ± standard deviation (SD)] lateral, y = 4.3 ± 2.5 posterior and z = 6.5 ± 1.7 inferior, for the left hemisphere and x = 11.1 ± 1.2 lateral, y = 3.7 ± 2.5 posterior and z = 6.3 ± 1.8 inferior for the right hemisphere.
Electrode discrimination
Twenty-two patients with bilateral STN DBS, for a total of 44 DBS leads were screened at the initial programming sessions. Four leads where the contralateral parkinsonian signs were not consistent to establish a therapeutic window were excluded from the electrode discrimination. In addition, due to the inability to precisely model a bipolar VTA, two leads without clinical benefits on monopolar screening were excluded.
Thus, a total of 152 contacts (38 DBS leads) were discriminated. One hundred and twenty-three contacts were classified as clinically effective contacts. Twenty-nine contacts were classified as non-effective contacts.
Group analysis
Based on the analysis of contact connectivity to grey matter regions of interest described in the ‘Connectivity analysis’ section, we identified the cortical and subcortical regions most frequently associated with the 123 clinically effective contacts (Fig. 2).
Figure 2.

Frequency of connectivity histogram. The y-axis represents frequency of connectivity across all clinically effective contacts. The x-axis represents each grey matter region of interest (ROI). For subcortical areas, most clinically effective contacts demonstrated consistent connectivity to the brainstem, thalamus, the subthalamic nucleus and the substantia nigra. A frequency threshold of 0.85, represented by the black dotted line, was used for subcortical regions. Among cortical regions, the superior frontal gyrus demonstrated a frequency of connectivity higher than 0.5 across all clinically effective contacts. A frequency threshold of 0.5, represented by the grey dotted line, was used for cortical regions.
Most clinically effective contacts demonstrated connectivity to the brainstem (0.98) and thalamus (0.96), followed by the STN (0.93) and substantia nigra (0.86). Among cortical regions, the superior frontal gyrus demonstrated the highest frequency of connectivity (0.56) across clinically effective contacts.
Individual lead analysis
For the above areas, we performed within-lead discriminant analyses to assess whether connectivity strength was associated with clinical effectiveness. STN was excluded as connectivity to the surgical target was considered simply an indicator of electrode location. The region of interest’s discriminant power was expressed as a proportion of the leads (n = 20) on which the electrode with the strongest connectivity to the region of interest was a clinically effective contact. As shown in Table 2, strong connectivity to the superior frontal gyrus and the thalamus were positively associated with clinical effectiveness. The superior frontal gyrus demonstrated significantly higher discriminant power [OR = 6.4, 95% confidence interval (CI): 1.3–30.6, P = 0.014] while no significant effect was observed for the thalamus (OR = 2.9, 95% CI: 0.9–9.6, P = 0.08). Based on these findings, we further evaluated the differences on average connectivity strength between effective and non-effective contacts. A paired Wilcoxon rank-sum test demonstrated a significantly higher connectivity of the effective contacts to both regions (Fig. 3). For the superior frontal gyrus the average values of connectivity strength [mean ± standard error of the mean (SEM)] were 0.05 ± 0.06 for clinically effective contacts and 0.04 ± 0.06 for non-effective contacts (P = 0.0038). Those for the thalamus were 0.21 ± 0.10 and 0.18 ± 0.10 (P = 0.034), respectively. An individual lead example is displayed in Fig. 4.
Table 2.
Association between region of interest connectivity strength and clinical effectiveness
| Region of interest | Discriminant power | By chance probability | P-value | OR (95% CI) |
|---|---|---|---|---|
| Superior frontal gyrus (n = 18) | 0.89 | 0.64 | 0.014* | 6.4 (1.3–30.6) |
| Thalamus (n = 20) | 0.80 | 0.64 | 0.085 | 2.9 (0.9–9.6) |
| Substantia nigra (n = 19) | 0.58 | 0.64 | 0.813 | 0.69 (0.2–2.0) |
| Brainstem (n = 20) | 0.45 | 0.64 | 0.979 | 0.35 (0.1–1.0) |
Discriminant power was defined as a proportion of trials that successfully identified a contact with clinical efficacy, by selecting the contact with the highest connectivity to each relevant region of interest, within each lead. n represents the number of leads included in the analysis; leads without connectivity to the region of interest were excluded. Significance defined as *P < 0.05. P-value was obtained by testing the null hypothesis that contacts identified by the discriminant analysis were selected by chance. The null distribution was Poisson binomial with success probabilities of either 0.75, 0.5 or 0.25, depending on the proportion of effective contacts in a lead. OR of association using electrode connectivity strength as a measure of exposure and clinical effectiveness or ineffectiveness as the outcome.
Figure 3.

Connectivity strength of effective and non-effective contacts to the superior frontal gyrus and the thalamus. Connectivity strength is expressed as a fraction of the total contact connectivity (A and B). Error bars represent the standard error of the mean. For the superior frontal gyrus (A) the average values of connectivity strength were 0.05 ± 0.06 for clinically effective contacts and 0.04 ± 0.06 for non-effective contacts (P = 0.0038). Those for the thalamus (B) were 0.21 ± 0.10 and 0.18 ± 0.10 (P = 0.034), respectively. P-values were calculated from paired Wilcoxon rank-sum tests to account for the observed variability in connectivity strength across subjects. (C and D) The differences on connectivity strength between effective and non-effective contacts for the superior frontal gyrus and the thalamus, respectively. **P < 0.005; *P < 0.05.
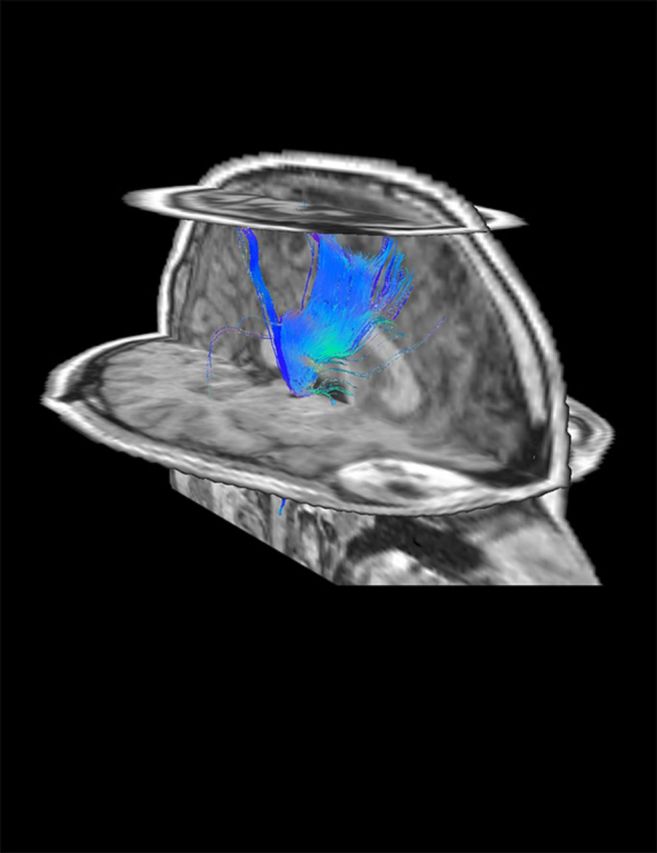
Figure 4.

Tractographic patterns of DBS electrodes on a single lead. Figure illustrates the different tractographic patterns of all contacts on a single DBS lead. Window entry voltages were used to calculate VTA sizes. (A and B) The tractographic patterns of two non-effective (NE) contacts (c8 and c9). (C and D) Two clinically effective contacts [c10: stimulating contact (SC) and c11: potential contact (PC)]. For each contact, tracts passing through the corresponding red sphere (representing the contact’s VTA) are displayed. Tracts were obtained from mini probabilistic tractography with 20 iterations. Colours represent different region of interest-VTA bundles in SUMA Software. A = anterior; P = posterior.
Electrode location in reference to the subthalamic nucleus centre
Individual contact localizations for all clinically effective contacts were determined in relation to the STN centre of mass, based on the Talairach template. Average coordinates were x = 2.0 ± 2.2 (mean in mm ± SD) lateral, y = 1.8 ± 1.4 anterior and z = 0.5 ± 2.4 inferior, for the left hemisphere and x = 1.7 ± 1.4 lateral, y = 1.1 ± 1.5 anterior and z = 1.4 ± 2.5 superior, for the right hemisphere. The location of clinically effective contacts in relation to the STN centre is represented in Fig. 5 and Supplementary Fig. 1, using AFNI’s Talairach-Tournoux atlas for STN axial representation and SUMA for contact surfaces.
Figure 5.

Electrode locations in reference to the subthalamic nucleus. Location of clinically effective contacts is illustrated in relation to the subthalamic nucleus (yellow surface). Contacts are represented as 2 mm spheres (blue circles) back-transformed from the subject native space to the Talairach-Tournoux space. Location data are overlaid on five consecutive axial slices.
Discussion
Our study aimed to establish the specific connectivity patterns that characterize clinically beneficial electrodes in patients with Parkinson’s disease treated with STN DBS, using probabilistic tractography. We implemented a novel approach that allowed both a group and a within-lead tractographic characterization of electrodes with clinically beneficial profiles for the treatment of Parkinson’s disease. The results of this study suggest that clinically effective contacts have a relevant interaction with white matter structures connected to the superior frontal gyrus and the thalamus.
Early views maintained that DBS inhibited STN neurons (Beurrier et al., 2001; Filali et al., 2004). This concept then extended to the idea that stimulation suppressed the exaggerated beta oscillatory synchronization observed in the basal ganglia of patients with Parkinson’s disease (Kühn et al., 2008). Further evidence obtained from electrophysiological studies suggests that high frequency stimulation decouples neuronal somatic and axonal activity, simultaneously inhibiting cell bodies while generating orthodromic and antidromic axonal action potentials (Johnson and McIntyre, 2008). Therefore, DBS appears to introduce a more regular axonal firing pattern in the parkinsonian basal ganglia (Garcia et al., 2005; Johnson and McIntyre, 2008; Dorval et al., 2010).
The STN is a small nucleus connected with other basal ganglia and several cortical regions. Based on the topography of its cortico-subthalamic projections, the STN has been subdivided into motor, limbic and associative functional regions (Haynes and Haber, 2013). This nucleus is surrounded by dense bundles of white matter fibres such as the pallidothalamic fibres originating in the globus pallidus pars interna. These pallidal fibres include the ansa lenticularis and the lenticular fasciculus (Hassler, 1974; Voges et al., 2002) (Fig. 6). The lenticular fasciculus and the zona incerta separate the dorsal STN from the caudal aspect of the thalamus (Hamani et al., 2004). The possibility of direct electric field influences on those neighboring structures and a contribution to the clinical effects of STN DBS has been postulated (Patel et al., 2003; Plaha et al., 2006). Plaha et al. specifically targeted the STN, the caudal zona incerta and the pallidofugal fibres dorsomedial to the STN (Plaha et al., 2006), demonstrating that stimulation of the zona incerta resulted in a greater improvement of motor scores than stimulation within the STN. In addition, the benefits for various tremor types, including Parkinsonian tremor, have been demonstrated with direct targeting of the dentato-rubro-thalamic tract in close proximity to the STN (Mädler and Coenen, 2012; Coenen et al., 2014). More recently, cortico-subthalamic projections have emerged as an important contributor to the pathophysiology of Parkinson’s disease and as a potential neuromodulation target (Li et al., 2014).
Figure 6.

Subthalamic nucleus and surrounding structures. Schematic representation of the STN and surrounding structures. Pallidothalamic fibres originated in the internal segment of the globus pallidus pars interna include the ansa lenticularis (AL) and the lenticular fasciculus (LF). The ansa lenticularis courses medial and ventral to the STN to reach the Fields of Forel and then divides into the thalamic fascicle and descending projections to the midbrain. The lenticular fasciculus originates in the medial aspect of the globus pallidus pars interna, perforates the IC and passes through the ventral surface of the zona incerta (ZI). A portion of the lenticular fasciculus and the zona incerta separate the dorsal STN from the ventral thalamus. GPe = globus pallidus pars externa; IC = internal capsule; PPN = pedunculopontine nucleus; SN = substantia nigra.
The connectivity patterns and the location of clinically effective electrodes described in our study further suggest that besides STN stimulation, the modulation of surrounding white matter tracts and cortico-subthalamic projections may play a role in the mechanism of action of this type of therapy. The observed connectivity patterns could correspond to the dentato-rubro-thalamic tract, zona incerta and/or pallidothalamic tract directed towards the thalamus. More importantly, this complex region encompasses cortico-subthalamic projections such as the hyperdirect pathway, for which motor components originate in M1 and Brodmann area 6 (Haynes and Haber, 2013). Our results reveal a higher connectivity of clinically effective contacts with the superior frontal gyrus, which contains the dorsal and anterior areas of Brodmann area 6. Those descending motor and premotor cortical projections enter the STN in its dorsal aspect after branching off from the internal capsule (Li et al., 2013). The interruption of those cortico-subthalamic interactions using anti-NMDA (N-methyl D-aspartate) receptors has demonstrated motor benefits in animal models (Pan et al., 2014). In parkinsonian rats, STN DBS has been shown to elicit antidromic activation and to suppress pathological oscillatory activity in cortical layers (Li et al., 2012). Electrical stimulation of these projections may therefore result in similar motor effects in humans. In fact, using subdural electrodes over the tractographically defined origin of the hyperdirect pathway, one study demonstrated attenuation of beta hypersynchrony by STN DBS (Whitmer et al., 2012). The high discriminant powers of the superior frontal gyrus and the thalamus obtained in our study, further support their role on the mechanism of action of DBS and could serve as the basis for future development of imaging-based programming interfaces.
The analysis presented in our study was based on the specific connectivity patterns observed in a Parkinson’s disease population with conventional clinical outcomes after STN DBS. DBS therapy has demonstrated significant increments in several clinical measures. However, comparisons between preoperative ON medication and postoperative ON medication-on stimulation states typically do not demonstrate differences as it could be subject to ceiling effects (Weaver et al., 2009; Moro et al., 2010). Instead, the main measure of success is the increase in time ON without dyskinesia and the reduction in motor fluctuations overall. Therefore, although there were no significant differences between preoperative ON medication and postoperative ON medication–on stimulation states in our patient population, significant clinical benefits were reflected in the large reductions in UPDRS part IV and the levodopa equivalent daily dose.
Although accounting for impedance and specific voltage magnitudes, our simplified method of spherical VTA estimation does not consider the specific conductivity properties of individualized grey and white matter tissues (Butson et al., 2007). By using this simplified method, entry voltage differences between contacts could have resulted in larger VTA radii. Voltage differences could then result in larger numbers of tracts in association with a proportionally larger VTA. We therefore represented our tractography data as a fraction of the number of tracts associated with the VTA to normalize for voltage differences between contacts. Additionally, although tractography may be limited by data resolution and resulting anatomical accuracy, our method up-sampled the DTI data to 1.5 mm during processing to improve registration. Furthermore, we used postoperative T1 MPRAGE (magnetization-prepared rapid gradient echo) images (1.0 mm isotropic), coregistered with CT images for proper contact localization (Lauro et al., 2016). We were able to demonstrate differential patterns of connectivity exhibited by contacts in the same lead (Supplementary Fig. 2).
As our tractography results were based on preoperative DTI, it is possible that brain connectivity patterns change postoperatively due to cell death, brain shift, or any other factors attributable to the surgical procedure. Moreover, a single impedance measurement was only obtained for the final stimulating settings and it does not account for the postoperative impedance variability over time (Lungu et al., 2014). On the other hand, STN localization has shown to vary across methodologies, a problem further complicated by the variability of STN locations in different age groups (Sánchez Castro et al., 2005; Keuken et al., 2013). Therefore, a more comprehensive look into electrode locations in relation to the STN would likely require individualized STN delineation.
The relationship between functional markers observed in PET and functional MRI studies with tractography patterns in patients undergoing DBS therapy has not yet been determined (Hilker et al., 2004; Min et al., 2012, 2014; Park et al., 2014). Therefore, although DTI provides information regarding tract orientation and potential connectivity with grey matter structures, the lack of association with specific areas does not necessarily translate into the lack of neuronal connectivity or functional interactions. Nevertheless, it has been suggested that structural connectivity is an indirect reflection of potential functional association (Torres et al., 2014) and by using preoperative DTI and postoperative imaging coregistration, we were able to determine specific connectivity patterns that characterize more clinically effective DBS electrodes.
As a result of the emergence of new technologies with large electrode arrays, traditional electrode screening methods may not be feasible. Our approach adds to the current efforts (Pourfar et al., 2015) on the development of preoperative imaging and programming interfaces for DBS in Parkinson’s disease. However, large and randomized studies will be necessary in the future.
Our results suggest that the modulation of white matter tracts connected to the superior frontal gyrus and the thalamus play an important role in the mechanism of action of STN DBS for Parkinson’s disease. The high association between superior frontal structures and clinically effective contacts suggests the benefits of modulating cortico-subthalamic pathways in the management of Parkinson’s disease. Our study suggests that high connectivities to the superior frontal gyrus and the thalamus are indicators of clinical effectiveness, and the observed discriminant power of these two areas could serve as basis for the development of preoperative imaging-based programming interfaces for DBS in Parkinson’s disease. Future directions include the integration of additional quantitative measures and further refinements of the method.
Supplementary Material
Acknowledgements
We thank Ziad Saad for his advice on data processing and analysis; Research Nurses Beverly McElroy and Gretchen Scott; and Patient Coordinator: Mae Brooks
Glossary
Abbreviations
- AFNI
Analysis of Functional NeuroImages
- DBS
deep brain stimulation
- DTI
diffusion tensor imaging
- STN
subthalamic nucleus
- UPDRS
Unified Parkinson’s Disease Rating Scale
- VTA
volume of tissue activated
Funding
NIH/NINDS Intramural Program for all authors.
Supplementary material
Supplementary material is available at Brain online.
References
- Bazin P-LL, Cuzzocreo JL, Yassa MA, Gandler W, McAuliffe MJ, Bassett SS, et al. Volumetric neuroimage analysis extensions for the MIPAV software package. J Neurosci Methods 2007; 165: 111–21. [DOI] [PMC free article] [PubMed] [Google Scholar]
- Beurrier C, Bioulac B, Audin J, Hammond C. High-frequency stimulation produces a transient blockade of voltage-gated currents in subthalamic neurons. J Neurophysiol 2001; 85: 1351–6. [DOI] [PubMed] [Google Scholar]
- Butson CR, Cooper SE, Henderson JM, McIntyre CC. Patient-specific analysis of the volume of tissue activated during deep brain stimulation. Neuroimage 2007; 34: 661–70. [DOI] [PMC free article] [PubMed] [Google Scholar]
- Coenen V, Allert N, Paus S, Kronenbürger M, Urbach H, Mädler B. Modulation of the cerebello-thalamo-cortical network in thalamic deep brain stimulation for tremor: a diffusion tensor imaging study. Neurosurgery 2014; 75: 657. [DOI] [PubMed] [Google Scholar]
- Cox RW. AFNI: software for analysis and visualization of functional magnetic resonance neuroimages. Comput Biomed Res 1996; 29: 162–73. [DOI] [PubMed] [Google Scholar]
- Defer G-L, Widner H, Mariè R-M, Rèmy P, Levivier M. Core assessment program for surgical interventional therapies in Parkinson’s disease (CAPSIT‐PD). Mov Disord 1999; 14: 572–84. [DOI] [PubMed] [Google Scholar]
- Dorval AD, Kuncel AM, Birdno MJ, Turner DA, Grill WM. Deep brain stimulation alleviates parkinsonian bradykinesia by regularizing pallidal activity. J Neurophysiol 2010; 104: 911–21. [DOI] [PMC free article] [PubMed] [Google Scholar]
- Filali M, Hutchison W, Palter V, Lozano A, Dostrovsky J. Stimulation-induced inhibition of neuronal firing in human subthalamic nucleus. Exp Brain Res 2004; 156: 274–81. [DOI] [PubMed] [Google Scholar]
- Fischl B. FreeSurfer. Neuroimage 2012; 62: 774–81. [DOI] [PMC free article] [PubMed] [Google Scholar]
- Garcia L, D’Alessandro G, Fernagut P-O, Bioulac B, Hammond C. Impact of high-frequency stimulation parameters on the pattern of discharge of subthalamic neurons. J Neurophysiol 2005; 94: 3662–9. [DOI] [PubMed] [Google Scholar]
- Hamani C, Saint-Cyr J, Fraser J, Kaplitt M, Lozano A. The subthalamic nucleus in the context of movement disorders. Brain 2004; 127: 4–20. [DOI] [PubMed] [Google Scholar]
- Hassler R. Fiber connections within the extrapyramidal system. Confin Neurol 1974; 36: 237–55. [DOI] [PubMed] [Google Scholar]
- Haynes WI, Haber SN. The organization of prefrontal-subthalamic inputs in primates provides an anatomical substrate for both functional specificity and integration: implications for Basal Ganglia models and deep brain stimulation. J Neurosci 2013; 33: 4804–14. [DOI] [PMC free article] [PubMed] [Google Scholar]
- Hilker R, Voges J, Weisenbach S, Kalbe E, Burghaus L, Ghaemi M, et al. Subthalamic nucleus stimulation restores glucose metabolism in associative and limbic cortices and in cerebellum: evidence from a FDG-PET study in advanced Parkinson’s disease. J Cereb Blood Flow Metab 2004; 24: 7–16. [DOI] [PubMed] [Google Scholar]
- Hughes AJ, Daniel SE, Kilford L, Lees AJ. Accuracy of clinical diagnosis of idiopathic Parkinson’s disease: a clinico-pathological study of 100 cases. J Neurol Neurosurg Psychiatr 1992; 55: 181–4. [DOI] [PMC free article] [PubMed] [Google Scholar]
- Johnson M, McIntyre C. Quantifying the neural elements activated and inhibited by globus pallidus deep brain stimulation. J Neurophysiol 2008; 100: 2549–63. [DOI] [PMC free article] [PubMed] [Google Scholar]
- Jones DK. Studying connections in the living human brain with diffusion MRI. Cortex 2008; 44: 936–52. [DOI] [PubMed] [Google Scholar]
- Keuken MC, Bazin P-LL, Schäfer A, Neumann J, Turner R, Forstmann BU. Ultra-high 7T MRI of structural age-related changes of the subthalamic nucleus. J Neurosci 2013; 33: 4896–900. [DOI] [PMC free article] [PubMed] [Google Scholar]
- Kühn AA, Kempf F, Brücke C, Gaynor Doyle L, Martinez-Torres I, Pogosyan A, et al. High-frequency stimulation of the subthalamic nucleus suppresses oscillatory beta activity in patients with Parkinson’s disease in parallel with improvement in motor performance. J Neurosci 2008; 28: 6165–73. [DOI] [PMC free article] [PubMed] [Google Scholar]
- Lauro PM, Vanegas-Arroyave N, Huang L, Taylor PA, Zaghloul KA, Lungu C, et al. DBSproc: an open source process for DBS electrode localization and tractographic analysis. Hum Brain Mapp 2016; 37: 422–33. DOI: 10.1002/hbm.23039. [DOI] [PMC free article] [PubMed] [Google Scholar]
- Li Q, Ke Y, Chan DC, Qian Z-MM, Yung KK, Ko H, et al. Therapeutic deep brain stimulation in Parkinsonian rats directly influences motor cortex. Neuron 2012; 76: 1030–41. [DOI] [PubMed] [Google Scholar]
- Li Q, Qian Z-MM, Arbuthnott GW, Ke Y, Yung W-HH. Cortical effects of deep brain stimulation: implications for pathogenesis and treatment of Parkinson disease. JAMA Neurol 2014; 71: 100–3. [DOI] [PubMed] [Google Scholar]
- Li W, Qin W, Liu H, Fan L, Wang J, Jiang T, et al. Subregions of the human superior frontal gyrus and their connections. Neuroimage 2013; 78: 46–58. [DOI] [PubMed] [Google Scholar]
- Lungu C, Malone P, Wu T, Ghosh P, McElroy B, Zaghloul K, et al. Temporal macrodynamics and microdynamics of the postoperative impedance at the tissue-electrode interface in deep brain stimulation patients. J Neurol Neurosurg Psychiatr 2014; 85: 816–9. [DOI] [PMC free article] [PubMed] [Google Scholar]
- Mädler B, Coenen VA. Explaining clinical effects of deep brain stimulation through simplified target-specific modeling of the volume of activated tissue. Am J Neuroradiol 2012; 33: 1072–80. [DOI] [PMC free article] [PubMed] [Google Scholar]
- McAuliffe MJ, Lalonde FM, McGarry D, Gandler W, Csaky K, Trus BL. “Medical Image Processing, Analysis & Visualization in Clinical Research”, CBMS, 2001, Proceedings of the 26th IEEE International Symposium on Computer-Based Medical Systems, Proceedings of the 26th IEEE International Symposium on Computer-Based Medical Systems 2001, pp. 0381, doi:10.1109/CBMS.2001.941749
- McIntyre CC, Grill WM, Sherman DL, Thakor NV. Cellular effects of deep brain stimulation: model-based analysis of activation and inhibition. J Neurophysiol 2004; 91: 1457–69. [DOI] [PubMed] [Google Scholar]
- Min H-K, Ross E, Lee K, Dennis K, Han S, Jeong J, et al. Subthalamic nucleus deep brain stimulation induces motor network BOLD activation: use of a high precision MRI guided stereotactic system for nonhuman primates. Brain Stimul 2014; 7: 603–7. [DOI] [PMC free article] [PubMed] [Google Scholar]
- Min H-KK, Hwang S-CC, Marsh MP, Kim I, Knight E, Striemer B, et al. Deep brain stimulation induces BOLD activation in motor and non-motor networks: an fMRI comparison study of STN and EN/GPi DBS in large animals. Neuroimage 2012; 63: 1408–20. [DOI] [PMC free article] [PubMed] [Google Scholar]
- Moro E, Lozano AM, Pollak P, Agid Y, Rehncrona S, Volkmann J, et al. Long-term results of a multicenter study on subthalamic and pallidal stimulation in Parkinson’s disease. Mov Disord 2010; 25: 578–86. [DOI] [PubMed] [Google Scholar]
- Pan M-KK, Tai C-HH, Liu W-CC, Pei J-CC, Lai W-SS, Kuo C-CC. Deranged NMDAergic cortico-subthalamic transmission underlies parkinsonian motor deficits. J Clin Invest 2014; 124: 4629–41. [DOI] [PMC free article] [PubMed] [Google Scholar]
- Park H-J, Park B, Kim H, Oh M-K, Kim J, Yoon M, et al. A network analysis of 15O-H2O PET reveals deep brain stimulation effects on brain network of Parkinson’s disease. Yonsei Med J 2014; 56: 726–36. [DOI] [PMC free article] [PubMed] [Google Scholar]
- Patel NK, Heywood P, O’Sullivan K, McCarter R, Love S, Gill SS. Unilateral subthalamotomy in the treatment of Parkinson’s disease. Brain 2003; 126: 1136–45. [DOI] [PubMed] [Google Scholar]
- Pierpaoli C, Basser P. Toward a quantitative assessment of diffusion anisotropy. Magn Reson Med 1996; 36: 893–906. [DOI] [PubMed] [Google Scholar]
- Pierpaoli C, Walker L, Irfanoglu MO, Barnett A, Basser P, Chang LC, et al. TORTOISE: an integrated software package for processing of diffusion MRI data. In: ISMRM 18th annual meeting, Stockholm, Sweden, 2010. p. 1597.
- Plaha P, Ben-Shlomo Y, Patel NK, Gill S. Stimulation of the caudal zona incerta is superior to stimulation of the subthalamic nucleus in improving contralateral parkinsonism. Brain 2006; 129: 1732–47. [DOI] [PubMed] [Google Scholar]
- Pourfar MH, Mogilner AY, Farris S, Giroux M, Gillego M, Zhao Y, et al. Model-based deep brain stimulation programming for Parkinson’s disease: the GUIDE pilot study. Stereotact Funct Neurosurg 2015; 93: 231–9. [DOI] [PubMed] [Google Scholar]
- Reveley C, Seth A, Pierpaoli C, Silva A, Yu D, Saunders R, et al. Superficial white matter fiber systems impede detection of long-range cortical connections in diffusion MR tractography. Proc Natl Acad Sci USA 2015; 112: E2820–8. [DOI] [PMC free article] [PubMed] [Google Scholar]
- Riva-Posse P, Choi KS, Holtzheimer PE, McIntyre CC, Gross RE, Chaturvedi A, et al. Defining critical white matter pathways mediating successful subcallosal cingulate deep brain stimulation for treatment-resistant depression. Biol Psychiatry 2014; 76: 963–9. [DOI] [PMC free article] [PubMed] [Google Scholar]
- Rozanski VE, Vollmar C, Cunha JPP, Tafula SMM, Ahmadi S-AA, Patzig M, et al. Connectivity patterns of pallidal DBS electrodes in focal dystonia: a diffusion tensor tractography study. Neuroimage 2014; 84: 435–42. [DOI] [PubMed] [Google Scholar]
- Saad ZS, Reynolds RC. SUMA. Neuroimage 2012; 62: 768–73. [DOI] [PMC free article] [PubMed] [Google Scholar]
- Sánchez Castro FJ, Pollo C, Meuli R, Maeder P, Cuadra MB, Cuisenaire O, et al. Cross validation of experts versus registration methods for target localization in deep brain stimulation. Med Image Comput Comput Assist Interv 2005; 8: 417–24. [DOI] [PubMed] [Google Scholar]
- Taylor PA, Saad ZS. FATCAT: (an efficient) functional and tractographic connectivity analysis toolbox. Brain Connect 2013; 3: 523–35. [DOI] [PMC free article] [PubMed] [Google Scholar]
- Tomlinson C, Stowe R, Patel S, Rick C, Gray R, Clarke C. Systematic review of levodopa dose equivalency reporting in Parkinson’s disease. Mov Disord 2010; 25: 2649–53. [DOI] [PubMed] [Google Scholar]
- Torres C, Manzanares Sola RG. Integrating diffusion tensor imaging-based tractography into deep brain stimulation surgery: a review of the literature. Stereotac Func Neurosurg 2014; 92: 282–90. [DOI] [PubMed] [Google Scholar]
- Voges J, Volkmann J, Allert N, Lehrke R, Koulousakis A, Freund H-J, et al. Bilateral high-frequency stimulation in the subthalamic nucleus for the treatment of Parkinson disease: correlation of therapeutic effect with anatomical electrode position. J Neurosurg 2002; 96: 269–79. [DOI] [PubMed] [Google Scholar]
- Volkmann J, Moro E, Pahwa R. Basic algorithms for the programming of deep brain stimulation in Parkinson’s disease. Mov Disord 2006; 21 (Suppl 14): S284–9. [DOI] [PubMed] [Google Scholar]
- Wagle Shukla A, Okun MS. Surgical treatment of Parkinson’s disease: patients, targets, devices, and approaches. Neurotherapeutics 2014; 11: 47–59. [DOI] [PMC free article] [PubMed] [Google Scholar]
- Weaver FM, Follett K, Stern M, Hur K, Harris C, Marks WJ, et al. Bilateral deep brain stimulation vs best medical therapy for patients with advanced Parkinson disease: a randomized controlled trial. JAMA 2009; 301: 63–73. [DOI] [PMC free article] [PubMed] [Google Scholar]
- Whitmer D, de Solages C, Hill B, Yu H, Henderson JM, Bronte-Stewart H. High frequency deep brain stimulation attenuates subthalamic and cortical rhythms in Parkinson’s disease. Front Hum Neurosci 2012; 6: 155. [DOI] [PMC free article] [PubMed] [Google Scholar]
Associated Data
This section collects any data citations, data availability statements, or supplementary materials included in this article.