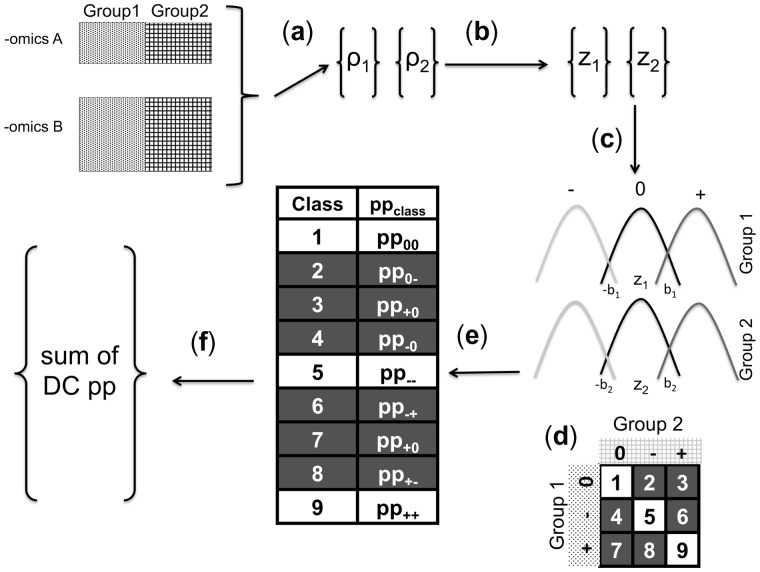
Fig. 1.
Discordant algorithm pipeline. (a) Pearson’s correlation coefficients for all A and B pairs. (b) Fisher’s transformation. (c) Mixture model based on z scores. (d) Class matrix describing between group relationships. (e) EM Algorithm to estimate posterior probability of each class for each pair. (f) Features of —omics A and B that have high pp of DC

