

Abstract
OBJECTIVES
Previous studies have identified predictors of prolonged length of stay (LOS) following pulmonary lobectomy. LOS is typically described to have a direct relationship to postoperative complications. We sought to determine the LOS and factors associated with variability after uncomplicated pulmonary lobectomy.
METHODS
Analysing the State Inpatient Databases, Healthcare Cost and Utilization Project, Agency for Healthcare Research and Quality database, we reviewed lobectomies performed (2009–11) on patients in California, Florida and New York. LOS and comorbidities were identified. Multivariable regression analysis (MVA) was used to determine factors associated with LOS greater than the median. Patients with postoperative complications or death were excluded.
RESULTS
Among 22 647 lobectomies performed, we identified 13 099 patients (58%) with uncomplicated postoperative courses (mean age = 66 years; 56% female; 76% white, 57% Medicare; median DEYO comorbidity score = 3, 55% thoracotomy, 45% thoracoscopy/robotic). There was a wide distribution in LOS [median LOS = 5 days; interquartile range (IQR) 4–7]. By MVA, predictors of prolonged LOS included, age ≥75 years [odds ratio (OR) 1.7, 95% confidence interval (CI) 1.4–2.0], male gender (OR 1.2, 95% CI 1.1–1.2), chronic obstructive pulmonary disease (OR 1.6, 95% CI 1.5–1.7) and other comorbidities, Medicaid payer (OR 1.7, 95% CI 1.4–2.1) versus private insurance, thoracotomy (OR 3.0, 95% CI 2.8–3.3) versus video-assisted thoracoscopic surgery/robotic approach and low hospital volume (OR 2.4, 95% CI 2.1–2.6).
CONCLUSIONS
Variability exists in LOS following even uncomplicated pulmonary lobectomy. Variability is driven by clinical factors such as age, gender, payer and comorbidities, but also by surgical approach and volume. All of these factors should be taken into account when designing clinical care pathways or when allocating payment resources. Attempts to define an optimal LOS depend heavily upon the patient population studied.
Keywords: Length of stay, Lobectomy, Lung cancer, Surgery, Quality
INTRODUCTION
With an increased focus on health care expenditures, length of hospital stay following surgical procedures has been increasingly scrutinized [1–3]. Decreasing the length of stay (LOS) for commonly performed cardiothoracic procedures has the potential to save significant costs and would allow for increased access to hospital beds for other patients although this must be weighed against the potential for increased readmissions in patients leaving the hospital early after major procedures [4, 5]. In addition to financial considerations, LOS has been examined as a quality metric following lobectomy for lung cancer [6, 7]. Following an analysis of the Society of Thoracic Surgeons database, it was suggested that prolonged length of stay (PLOS), defined as greater than 14 days, was a surrogate marker of morbidity that could allow for meaningful risk-adjusted outcome comparisons between institutions [6]. However, the definition of PLOS was subsequently challenged as was its validity as a stand-alone metric [7]. LOS following pulmonary lobectomy has also been examined as a benchmarking metric in Europe, where considerable variability between institutions was shown [8].
From all these studies, it is clear that LOS depends upon several factors, most notably postoperative complications. However, it is likely that several preoperative, demographic factors not under the control of the surgeon and not related to quality of care also affect LOS. These variables are critical to identify prior to considering LOS as a quality metric as they are completely independent of surgical quality. For example, a recent study demonstrated that preoperative patient characteristics and comorbidities can be used to predict LOS following coronary artery bypass grafting [5]. We hypothesize that such factors are also of significant importance in determining LOS following pulmonary lobectomy. Supporting this, Krell et al. [1] recently demonstrated that 43% of colorectal surgery patients with extended LOS did not have documented complications. Because most LOS models are heavily dependent upon postoperative complications, we elected to exclude patients with complications in order to focus solely on preoperative factors and the surgical approach. We believe such information would be helpful to establish expectations for LOS preoperatively and to allow for appropriate resource utilization. Identification of non-modifiable risk factors will also help to better risk-adjust prediction models for LOS following pulmonary lobectomy.
METHODS
Database and study population
We examined hospitalizations from adults (age ≥18 years) using 2009–11 discharge data from California, Florida and New York from the State Inpatient Database (SID); Healthcare Cost and Utilization Project, Agency for Healthcare Research and Quality. All study activities were approved by the Weill Cornell Medicine Institutional Review Board. The database and methods utilized have been described previously, but briefly, the SID is an all-payer inpatient database, containing discharges from non-federal, non-psychiatric community hospital [9, 10]. It contains more than one hundred clinical and non-clinical variables such as principal and secondary diagnoses and procedures, admission and discharge status, patient demographics, total charge and LOS. International Classification of Diseases, Ninth Revision, Clinical Modification (ICD-9M) codes were used to identify and create two mutually exclusive groups: open lobectomy (OL: 32.49, 32.4; excluding 34.03, 32.41, 34.21, 17.4x) versus minimally invasive lobectomy (MIL: thoracoscopic lobectomy: 32.41; excluding 32.4, 32.49, 34.03, 17.4x and robotic lobectomy: 17.4x and 32.4, 32.41, or 32.49; excluding 34.03, 34.21). Pre-existing diagnoses and complications may be identified by matching a unique identifier with each diagnosis code. Furthermore, each discharge record contains a unique identification code allowing the linking of patient records to identify not only readmission but also time to readmission [9, 10].
Outcomes
The primary outcome of this study is LOS for the index admission associated with uncomplicated pulmonary lobectomy. LOS was determined from the day of admission to the day of discharge. Patients who experienced in-hospital mortality or in-hospital complications not present on admission (supraventricular arrhythmia, myocardial infarction, postoperative stroke, deep venous thrombosis, pulmonary embolism, pneumonia, postoperative acute respiratory insufficiency, postoperative acute pneumothorax, postoperative pulmonary oedema, pulmonary collapse, empyema with and without fistula, mechanical ventilation, non-invasive ventilation, tracheostomy, sepsis/shock, urinary tract infection, postoperative wound infection, accidental puncture or laceration complicating surgery, bleeding complicating procedure) were excluded from the study population. The secondary outcome of interest was 30-day readmission. To identify hospital readmissions, a unique identifier was utilized to link discharge records. To ensure that only true readmissions were analysed, clinical classification software code 254, denoting rehabilitation visit, was excluded and a subsequent readmission was identified. Furthermore, patients with an admission date in the final quarter of 2011 were excluded because appropriate follow-up could not be conducted to identify a subsequent readmission [10].
Covariates
Data were obtained for patient demographics (age, gender, race, state and insurance status), comorbidities (with the indication of present on admission), surgical approach, hospital lobectomy volume quartile (first quartile: 0–48; second quartile: 49–98; third quartile: 99–202; fourth quartile: 203+) and LOS. Baseline comorbidities were measured using the modified Deyo index, which adapts the commonly used Charlson index for predicting adjusted relative risk of 1-year mortality to administrative data and Elixhauser comorbidities [11, 12]. Additionally, hospital lobectomy volume quartiles were created.
Statistical analysis
We analysed patient baseline demographic and comorbidity variables using frequencies and proportions for categorical variables and means, standard deviations (SDs), medians and interquartile ranges (IQR) for continuous variables. Differences in LOS across patient demographic and comorbidity categories were compared using Wilcoxon–Mann–Whitney test for binary variables or Kruskal–Wallis test for variables with more than two categories. Additionally, we reanalysed the cohort using a 14-day LOS cut point (LOS of ≤14 days and a second group with an LOS of >14 days) to match the STS definition of PLOS. Furthermore, we compared the percentage of patients readmitted to the hospital within 30 days as a function of LOS.
For exploratory purposes, we used stepwise multivariable logistic regression modelling to identify significant factors associated with prolonged LOS, defined by having an index hospitalization LOS greater than or equal to the median LOS (5 days) of the study sample. Covariates of interest were patients' demographics, comorbidities, hospital lobectomy volume quartiles and procedure type (OL and MIL). A significance level of 0.2 was required to enter the model and a level of 0.05 was required to remain in the model. Adjusted odds ratios (ORs) and 95% confidence intervals (95% CIs) were presented. All P-values are two sided with statistical significance evaluated at the 0.05 α level. SAS version 9.3 (SAS Institute, Cary, NC, USA) was used to perform all statistical analyses.
RESULTS
During the time period studied (2009–11), we identified a total of 22 647 pulmonary lobectomies of which 13 099 were performed in patients without subsequent complications. The uncomplicated lobectomies were analysed from a relatively equal distribution (Table 1) between California (n = 4732; 36.1%), Florida (n = 3896; 29.7%) and New York (n = 4471, 34.1%). A majority of patients (n = 7331; 56.0%) were female and most patients were white (n = 9973; 76.1%). The mean age for the cohort was 65.7 years (SD, 11.6 years). Most lobectomies were performed open via thoracotomy (n = 7266; 55.5%), whereas the remainder were minimally invasive (n = 5833; 44.5%), either video-assisted thoracoscopic surgery (VATS) or robotic-assisted thoracoscopic surgery (RATS). Regarding payer status, 56.6% of patients were covered by Medicare (n = 7417), whereas 33.7% were covered by private insurance (n = 4416), and 6.4% were covered by Medicaid (n = 832).
Table 1:
Demographics of patient population
| Characteristic | n | % |
|---|---|---|
| Total | 22 647 | |
| Uncomplicated | 13 099 | 100.0 |
| Gender | ||
| Male | 5768 | 44.0 |
| Female | 7331 | 56.0 |
| Age (years) | ||
| Mean (standard deviation) | 65.7 | 11.56 |
| Age by category | ||
| 18–54 | 2028 | 15.5 |
| 55–64 | 3274 | 25.0 |
| 65–74 | 4740 | 36.2 |
| ≥75 | 3057 | 23.3 |
| State | ||
| California | 4732 | 36.1 |
| Florida | 3896 | 29.7 |
| New York | 4471 | 34.1 |
| Race | ||
| White | 9973 | 76.1 |
| Black | 852 | 6.5 |
| Hispanic | 1084 | 8.3 |
| Other | 1011 | 7.7 |
| Missing | 179 | 1.4 |
| Surgical approach | ||
| Thoracotomy (OL) | 7266 | 55.5 |
| VATS or RATS (MIL) | 5833 | 44.5 |
| Payer | ||
| Medicare | 7417 | 56.6 |
| Medicaid | 832 | 6.4 |
| Private insurance | 4416 | 33.7 |
| Self-pay | 153 | 1.2 |
| No charge | 33 | 0.3 |
| Other | 248 | 1.9 |
LOS: length of stay; VATS: video-assisted thoracoscopic surgery; RATS: robotic-assisted thoracoscopic surgery; MIL: minimally invasive lobectomy; OL: open lobectomy.
The median modified Deyo index of this cohort of patients was 3 (IQR 2–4); however, nearly a fifth of patients (n = 2288; 17.5%) had a Deyo index of 7 or more (Table 2). The majority of patients had a diagnosis of malignancy (n = 11 520, 87.9%). Hypertension, (n = 7399; 56.5%), chronic obstructive pulmonary disease (COPD) (n = 5052; 38.6%), diabetes (n = 2205; 16.8%) and hypothyroidism (n = 1378; 10.5%) were among the most common comorbidities. Other clinically notable comorbidities included obesity (n = 881; 6.7%), renal failure (n = 568; 4.3%) and congestive heart failure (CHF) (n = 292; 2.2%).
Table 2:
Patient comorbidities
| Comorbidities | n | % |
|---|---|---|
| Deyo index [median, (Q1; Q3)] | 3 | (2; 4) |
| Deyo index, by number | ||
| 0 | 857 | 6.5 |
| 1 | 593 | 4.5 |
| 2 | 4912 | 37.5 |
| 3 | 3416 | 26.1 |
| 4 | 431 | 3.3 |
| 5 | 167 | 1.3 |
| 6 | 435 | 3.3 |
| 7+ | 2288 | 17.5 |
| Elixhauser comorbidities | ||
| Alcohol abuse | 273 | 2.1 |
| Anaemia | 985 | 7.5 |
| Chronic pulmonary disease | 5052 | 38.6 |
| Coagulopathy | 156 | 1.2 |
| Congestive heart failure | 292 | 2.2 |
| Depression | 959 | 7.3 |
| Diabetes | 2205 | 16.8 |
| Drug abuse | 150 | 1.1 |
| Fluid and electrolyte disorders | 511 | 3.9 |
| Hypertension | 7399 | 56.5 |
| Hypothyroidism | 1378 | 10.5 |
| Liver disease | 212 | 1.6 |
| Lymphoma | 155 | 1.2 |
| Metastatic cancer | 2661 | 20.3 |
| Obesity | 881 | 6.7 |
| Other neurological disorders | 282 | 2.2 |
| Peripheral vascular disorders | 765 | 5.8 |
| Psychoses | 228 | 1.7 |
| Pulmonary circulation disorders | 98 | 0.7 |
| Rheumatoid arthritis/collagen vascular diseases | 365 | 2.8 |
| Renal failure | 568 | 4.3 |
| Solid tumour without metastasis | 11 011 | 84.1 |
| Valvular disease | 423 | 3.2 |
| Weight loss | 200 | 1.5 |
Despite the lack of complications in this patient population, there was still a wide distribution in LOS with 23.8% of patients (n = 3120) leaving the hospital in 0–3 days, 38.8% (n = 5088) in 4–5 days, 25.1% (n = 3289) in 6–8 days and 12.2% of patients (n = 1602) requiring admission for 9 or more days (Fig. 1). The median LOS for the entire cohort was 5 days with an IQR of 4–7 days. Notably, 3.1% of these patients without complications (n = 401) still required greater than 14 days of hospital admission, which would meet the STS definition of PLOS [6]. The majority of patients had routine discharge home (69.5%; 9098), whereas 5.2% (n = 682) were transferred to a short-term care facility or other hospital, left against medical advice or had an unknown destination. The remaining 25.3% of patients (n = 3319) were discharged home with home health care.
Figure 1:
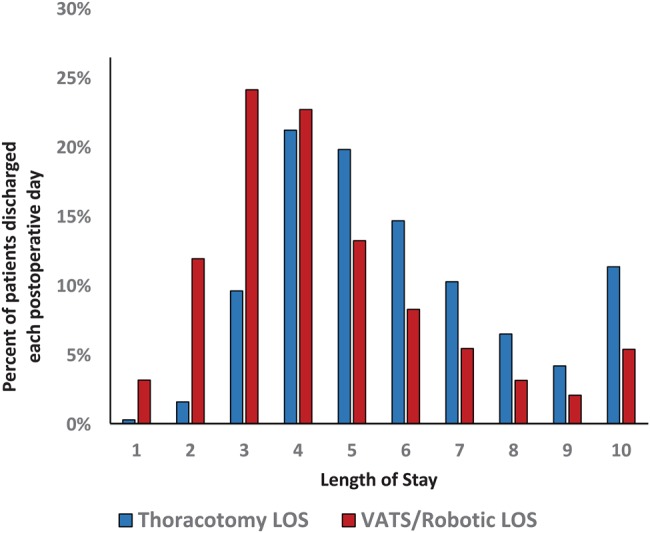
Length of stay by surgical approach.
We next compared LOS between patients with several different demographic variables or comorbidities (Table 3). Within variables such as age, gender, year operation performed and several comorbidities, there was no appreciable difference in the absolute median LOS among subgroups, yet statistically significant differences were still present as revealed by the higher IQR for older age, male gender, earlier time period of operation and the presence of comorbidities. On the other hand, variables such as the payer, surgical approach and hospital volume all had noticeable effects on the median LOS. OL versus MIL, Medicaid versus Medicare payer and lower versus higher surgical volume quartiles all added at least 1 day to median LOS.
Table 3:
Median length of stay by patient variable
| Characteristic | Median (IQR) | Median (IQR) | P-value |
|---|---|---|---|
| Age by category | <0.0001 | ||
| 18–54 | 5 (3.5–7) | ||
| 55–64 | 5 (3–6) | ||
| 65–74 | 5 (4–6) | ||
| ≥75 | 5 (4–7) | ||
| Gender | <0.0001 | ||
| Male | 5 (4–7) | ||
| Female | 5 (3–6) | ||
| Comorbidities | Present | Absent | |
| Alcohol abuse | 6 (4–9) | 5 (4–7) | <0.0001 |
| Anaemia | 6 (4–10) | 5 (4–6) | <0.0001 |
| Chronic pulmonary disease | 5 (4–7) | 4 (3–6) | <0.0001 |
| Coagulopathy | 6 (4–7.5) | 5 (4–7) | <0.0001 |
| Congestive heart failure | 6 (4–8) | 5 (4–7) | <0.0001 |
| Diabetes | 5 (4–7) | 5 (4–6) | <0.0001 |
| Drug abuse | 6 (4–9) | 5 (4–7) | <0.0001 |
| Fluid and electrolyte disorders | 7 (5–11) | 5 (4–6) | <0.0001 |
| Obesity | 5 (4–7) | 5 (4–7) | <0.0001 |
| Other neurological disorders | 5 (4–8) | 5 (4–7) | <0.0001 |
| Peripheral vascular disorders | 5 (4–8) | 5 (4–7) | <0.0001 |
| Psychoses | 6 (4–8) | 5 (4–7) | <0.0001 |
| Renal failure | 6 (4–8) | 5 (4–6) | <0.0001 |
| Weight loss | 6 (5–11) | 5 (4–7) | <0.0001 |
| Year | <0.0001 | ||
| 2009 | 5 (4–7) | ||
| 2010 | 5 (4–7) | ||
| 2011 | 5 (3–6) | ||
| Payer | <0.0001 | ||
| Medicare | 5 (4–7) | ||
| Medicaid | 6 (4–8) | ||
| Private insurance | 4 (3–6) | ||
| Self-pay | 6 (4–9) | ||
| No charge | 7 (4–14) | ||
| Other | 6 (4–8.5) | ||
| Hospital lobectomy volume quartiles | <0.0001 | ||
| First quartile | 6 (4–8) | ||
| Second quartile | 5 (4–7) | ||
| Third quartile | 5 (4–6) | ||
| Fourth quartile | 4 (3–5) | ||
| Surgical approach | <0.0001 | ||
| Thoracotomy | 5 (4–7) | ||
| Thoracoscopic/robotic | 4 (3–5) |
IQR: interquartile range.
We subsequently used stepwise multivariable logistic modelling (Table 4) to identify independent risk factors associated with LOS greater than or equal to the median (5 days). Compared with patients 18–54 years old, advanced age was associated with longer LOS with patients 65–74 years of age (OR 1.26, 95% CI 1.08–1.47, P = 0.003) and patients 75 years or older (OR 1.69, 95% CI 1.43–2.00, P < 0.0001) more likely to have longer LOS. Male gender was also associated with longer LOS (OR 1.15, 95% CI 1.06–1.24, P = 0.0004). Compared with patients with private insurance, there was no difference in LOS for patients with Medicare. However, patients with Medicaid and self-paying patients were more likely to experience longer LOS (OR 1.72, 95% CI 1.44–2.06, P < 0.0001 and OR 1.98, 95% CI 1.32–2.97, P = 0.0009, respectively). Hospital lobectomy volume was also associated with increased LOS. Patients having procedures at the lowest volume hospitals were more than twice as likely to have longer LOS compared with patients operated on at the highest volume hospitals (OR 2.36, 95% CI 2.11–2.64, P < 0.0001). Not surprisingly, surgical approach was also associated with LOS, with patients undergoing OL being three times more likely to have LOS greater than or equal to the median (5 days) compared with those patients undergoing MIL (OR 3.05, 95% CI 2.82–3.29, P < 0.0001).
Table 4:
Multivariable analysis of factors affecting LOS expressed as odds ratios for LOS>median LOS
| Patient variable | Adjusted OR | 95% CI of OR | P-value |
|---|---|---|---|
| Age by category | |||
| 18–54 | Referent | ||
| 55–64 | 1.05 | 0.93–1.19 | 0.44 |
| 65–74 | 1.26 | 1.08–1.47 | 0.003 |
| ≥75 | 1.69 | 1.43–2.00 | <0.0001 |
| Gender | |||
| Male | 1.15 | 1.06–1.24 | 0.0004 |
| Female | Referent | ||
| Comorbidities | |||
| Fluid and electrolyte disorders | 2.10 | 1.68–2.64 | <0.0001 |
| Weight loss | 2.06 | 1.45–2.93 | <0.0001 |
| Anaemia | 1.73 | 1.48–2.03 | <0.0001 |
| Alcohol abuse | 1.63 | 1.22–2.19 | 0.001 |
| Psychoses | 1.61 | 1.18–2.20 | 0.003 |
| Chronic pulmonary disease | 1.57 | 1.45–1.70 | <0.0001 |
| Coagulopathy | 1.57 | 1.08–2.28 | 0.02 |
| Drug abuse | 1.57 | 1.03–2.37 | 0.03 |
| Other neurological disorders | 1.48 | 1.13–1.94 | 0.004 |
| Renal failure | 1.33 | 1.08–1.62 | 0.01 |
| Congestive heart failure | 1.31 | 0.99–1.72 | 0.06 |
| Obesity | 1.31 | 1.12–1.53 | 0.0006 |
| Peripheral vascular disorders | 1.22 | 1.03–1.45 | 0.02 |
| Diabetes, uncomplicated | 1.13 | 1.02–1.25 | 0.02 |
| Year | |||
| 2009 | 1.18 | 1.08–1.30 | 0.0004 |
| 2010 | 1.05 | 0.95–1.15 | 0.34 |
| 2011 | Referent | ||
| Payer | |||
| Private insurance | Referent | ||
| Medicare | 1.01 | 0.89–1.15 | 0.84 |
| Medicaid | 1.72 | 1.44–2.06 | <0.0001 |
| Self-pay | 1.98 | 1.32–2.97 | 0.0009 |
| No charge | 1.46 | 0.67–3.16 | 0.34 |
| Other | 1.77 | 1.31–2.40 | 0.0002 |
| Hospital lobectomy volume quartiles | |||
| First quartile | 2.36 | 2.11–2.64 | <0.0001 |
| Second quartile | 1.52 | 1.37–1.69 | <0.0001 |
| Third quartile | 1.46 | 1.32–1.62 | <0.0001 |
| Fourth quartile | Referent | ||
| Surgical approach | |||
| Thoracotomy (OL) | 3.05 | 2.82–3.29 | <0.0001 |
| Thoracoscopic/robotic (MIL) | Referent | ||
LOS: length of stay; OR: odds ratio; CI: confidence interval; MIL: minimally invasive lobectomy; OL: open lobectomy.
Several preoperative individual patient comorbidities were associated with LOS, with the most highly associated comorbidities being fluid and electrolyte disorders (OR 2.10, 95% CI 1.68–2.64, P < 0.0001), weight loss (OR 2.06, 95% CI 1.45–2.93, P < 0.0001), anaemia (OR 1.73, 95% CI 1.48–2.03, P < 0.0001), alcohol abuse (OR 1.63, 95% CI 1.22–2.19, P = 0.001), psychosis (OR 1.61, 95% CI 1.18–2.20, P = 0.003), chronic pulmonary disease (OR 1.57, 95% CI 1.45–1.70, P < 0.0001), coagulopathy (OR 1.57, 95% CI 1.08–2.28, P = 0.02) and drug abuse (OR 1.57, 95% CI 1.03–2.37, P = 0.03). Additionally, many other comorbidities including renal failure, CHF, obesity, peripheral vascular disease and diabetes had smaller, but significant associations with LOS as listed in Table 4. The C-statistic for the predictive accuracy of the model was 0.73.
We next compared the percentage of patients readmitted to the hospital within 30 days as a function of LOS (Fig. 2). For the purpose of this study, we included all readmissions and did not attempt to retrospectively distinguish admissions directly related to the procedure versus those secondary to other causes. Among patients undergoing MIL, patients with a 2-day LOS had the lowest frequency of readmission (5.3%). Discharge prior to 2 days was associated with an over two-fold increase in readmission. The majority of patients sent home on Day 1 or 2 (n = 70) were readmitted for ‘complications of surgical procedures or medical care’ (n = 15, 21%), pulmonary diagnoses (n = 14, 20%) or cardiovascular diagnoses (n = 10, 14%). After 2 days, there was a steady rise in the rate of readmissions. For patients undergoing OL, patients with an LOS of 3 days had the lowest rate of readmission (5.9%). Discharge on Day 1 or 2 following OL was associated with higher rates of readmission. Similar to MIL, following OL the rate of readmission gradually increased with increasing LOS after 3 days, presumably due to the presence of demographic factors or comorbidities in these patients which prolonged their original LOS (Table 5).
Figure 2:

Readmission rates as a function of LOS for index hospital stay. LOS: length of stay.
Table 5:
Characteristics associated with Society of Thoracic Surgeons definition of prolonged length of stay (>14 days)
| Characteristic | 0- to 14-day stays | %* | 15+-day stays | % | P-value |
|---|---|---|---|---|---|
| Total | 12 698 | 96.9 | 401 | 3.1 | |
| Gender | <0.0001 | ||||
| Male | 5536 | 43.6 | 232 | 57.9 | |
| Female | 7162 | 56.4 | 169 | 42.1 | |
| Age in years | <0.0001 | ||||
| Mean (standard deviation) | 65.83 (11.48) | 62.75 (13.54) | |||
| Race | <0.0001 | ||||
| White | 9729 | 76.6 | 244 | 60.8 | |
| Black | 790 | 6.2 | 62 | 15.5 | |
| Hispanic | 1025 | 8.1 | 59 | 14.7 | |
| Other or missing | 1154 | 9.1 | 36 | 9.0 | |
| Deyo index, average | 0.263 | ||||
| Median (Q1; Q3) | 3 (2; 4) | 3 (1; 4) | |||
| Notable comorbidities | |||||
| Chronic pulmonary disease | 4833 | 38.1 | 219 | 54.6 | <0.0001 |
| Malignancy | 11 243 | 88.5 | 277 | 61.9 | <0.0001 |
| Payer | <0.0001 | ||||
| Medicare | 7218 | 56.8 | 199 | 49.6 | |
| Medicaid | 747 | 5.9 | 85 | 21.2 | |
| Private insurance | 4344 | 34.2 | 72 | 18.0 | |
| Self-pay | 136 | 1.1 | 17 | 4.2 | |
| Other or no charge | 253 | 2.0 | 28 | 7.0 | |
| Hospital lobectomy volume quartiles | <0.0001 | ||||
| First quartile | 2898 | 22.8 | 175 | 43.6 | |
| Fourth quartile | 3503 | 27.6 | 42 | 10.5 | |
| Surgical approach | <0.0001 | ||||
| Thoracotomy (OL) | 6962 | 54.8 | 304 | 75.8 | |
| Thoracoscopic/robotic (MIL) | 5736 | 45.2 | 97 | 24.2 |
MIL: minimally invasive lobectomy; OL: open lobectomy.
Finally, we examined patients in the cohort who met the STS definition of PLOS, greater than 14 days. Remarkably, despite the absence of complications in this cohort examined, 3.1% of patients (n = 401) were discharged after Day 14. Somewhat surprisingly, these patients were younger than those discharged with LOS up to 14 days (mean age 62.8 vs 65.8, P < 0.0001). However, patients with PLOS were more likely male (57.9 vs 43.6%, P < 0.0001), were more likely to have Medicaid as payer (21.2 vs 5.9%, P < 0.0001) and were more likely to be black (15.5 vs 6.2%, P < 0.0001). These patients were more likely to have COPD (54.6 vs 38.1%, P < 0.0001), but were less likely to have underlying malignancy (69.1 vs 88.5%, P < 0.0001). Patients with PLOS were more likely to have undergone OL (75.8 vs 54.8%, P < 0.0001) and were more likely to have been operated on at the lowest volume (Q1) hospitals (43.6 vs 22.8%, P < 0.0001).
DISCUSSION
In the current manuscript, we sought to use the SID database to examine LOS in patients undergoing uncomplicated pulmonary lobectomy and to define demographic characteristics and comorbidities that are associated with prolongation of LOS. Although limitations are inherent in administrative databases, such repositories may be ideally suited for examining LOS as they utilize claims data rather than self-reported data as is the case with the STS and European Society of Thoracic Surgeons (ESTS) databases. Additionally, the SID database includes comprehensive descriptors of demographic data and of comorbidities, which allows for in-depth statistical evaluation.
LOS has previously been examined as a quality metric for pulmonary lobectomy. Wright et al. identified several patient factors associated with prolonged LOS (in that case defined as LOS greater than 14 days) including age, male gender, Zubrod score and various comorbidities [6]. However, in their model, prolonged LOS was considered a surrogate for surgical morbidity. Indeed, patients with PLOS had significantly more postoperative adverse events than did patients without PLOS (3.4 vs 1.2, P < 0.0001). Similarly in the study by Farjah et al., 99% of patients with PLOS had postoperative adverse events [7]. It is not clear from either study whether demographic factors and comorbidities were independently associated with PLOS or whether these factors led to increased complications, which subsequently affected LOS. Such distinctions will become critically important as LOS is increasingly used to benchmark thoracic surgeons and to compare outcomes between different centres.
While postoperative complications clearly affect LOS, we hypothesized that patient factors not related to surgical quality would also have a significant impact on LOS. Supporting this, Krell et al. [1] recently reported that in surgical patients, there was only a weak correlation between risk-adjusted postoperative complications and risk-adjusted extended LOS. For this reason, we focused our study only on patients who underwent uncomplicated pulmonary lobectomy. Although administrative databases may not be perfectly suited to the analysis of complications, we could at least reliably exclude patients with significant postoperative adverse events based upon the coding data. After doing so, we were left with over 13 000 lobectomies for analysis. The study yielded several important findings.
Despite the lack of complications, there was a wide distribution in LOS for patients undergoing pulmonary lobectomy. The median LOS for the entire cohort was 5 days with an IQR of 4–7 days. LOS greater than or equal to the median was driven by a constellation of factors, including demographic distinctions such as older age and male gender and by several comorbidities including COPD, a common comorbidity in pulmonary lobectomy patients. Notably, several other comorbidities not specific to lobectomy patients also contributed to increased LOS, including fluid and electrolyte disorders, anaemias, coagulopathy, psychiatric disorders and substance abuse. It is intuitive that these conditions would require increased resource expenditure in the hospital and that they would potentially complicate plans for early discharge.
Insurance and hospital-based factors also influenced LOS. Having Medicaid as the payer was strongly associated with increased LOS (OR 1.72, 95% CI 1.44–2.06) compared with having private insurers or Medicare. This seems logical as Medicaid patients can be expected to have less resources and/or social support at home. Interestingly, self-pay patients also had longer LOS (OR 1.98, 95% CI 1.32–2.97) compared with privately insured and Medicare patients, suggesting that different expectations may be applied to these patients as well. There is clearly also an association between hospitals and LOS. Indeed, hospital volume appears to be a critical determinant of LOS. Hospitals in lower volume quartiles were 1.46–2.36 times more likely to exceed the median LOS for the cohort than were hospitals in the highest volume quartiles. Much has been written about the relationship of hospital procedure volume to outcomes; however, as we only evaluated patients without complications, our finding speaks to factors other than surgical quality per se. It is likely that higher volume hospitals have more established enhanced recovery pathways both for postoperative care and for discharge planning. It would seem that such pathways could be exported to lower volume hospitals when resources allow.
The choice of surgical approach is also strongly independently associated with LOS. Patients undergoing thoracotomy for lobectomy, as opposed to minimally invasive approaches, were three times more likely to meet or exceed the median LOS (5 days) for the entire cohort (OR 3.05, 95% CI 2.82–3.29). The association of decreased LOS with minimally invasive approaches to lobectomy has previously been described in large propensity-matched database studies from the USA (Nationwide Inpatient Sample database) and Europe (ESTS database) [13, 14]. In both of those studies, the hospital LOS was 2 days shorter for patients undergoing VATS approach compared with OL in matched sets of patients. In the current study, in unmatched patients median LOS was 4 days for patients undergoing MIL (IQR 3–5) and 5 days for patients undergoing OL (IQR 4–7, P < 0.0001). Clearly surgical centres wishing to minimize their LOS should strongly consider minimally invasive approaches.
Another notable feature of our study was the V-shaped curves describing readmission as a factor of LOS for both OL and MIL. A potential consequence of the inevitable push to get patients discharged earlier is a higher readmission rate. Patients not monitored in the hospital for a suitable duration postoperatively may be at risk for readmission from a variety of causes. Readmission following pulmonary lobectomy is subsequently associated with a higher risk for mortality [15]. Expected consequences and costs of readmission must therefore be balanced with the marginal cost of additional days of hospital stay [4]. In our study, discharge at Day 2 for patients undergoing MIL and at Day 3 for patients undergoing OL were associated with the lowest readmission rates. Discharge prior to those time points was associated with what appeared to be excessively high rates of readmission, the downside of which probably outweighs the benefits of sending the patients home earlier.
Finally, we addressed the issue of PLOS, greater than 14 days, as established from the STS database [6] and endorsed as a performance measure by the National Quality Forum, a non-profit organization dedicated to quality improvement [16]. Despite including no patients with documented postoperative complications, the rate of PLOS in the SID database was 3.1%, almost half of that reported in the STS database study and in a large single-institution study [6, 7]. This finding would argue against the validity of using PLOS as a quality metric to compare outcomes among surgeons or institutions given that many patients experience PLOS without adverse surgical events. Factors with the highest proportion of PLOS included age, male gender, black race, Medicaid payer, COPD and pulmonary lobectomy in patients without malignancy. Surgical approach and hospital volume are also strongly associated with PLOS.
Our study has notable limitations. It can be argued that administrative databases are not optimized for the evaluation and interpretation of clinical results or for quality improvement [17]. However, for a metric like LOS, we believe that administrative databases are highly accurate based upon billing codes and allow for comparisons not biased by the natural selection that goes into prospectively collected databases. Furthermore, these administrative data, carefully evaluated to exclude patients with complications, are widely generalizable and not restricted to the outcomes of specialized, experienced centres. However, patient-specific factors that may affect LOS such as performance status, frailty or adequacy of pain control are not accounted for in administrative databases. We therefore acknowledge that conclusions derived from large administrative datasets may not always be directly applicable to individual or institutional practices. Nevertheless, our findings suggest that patient demographics and comorbidities strongly influence LOS in a broad patient population. In this manner, LOS is perhaps best viewed as a ‘patient metric’ rather than a surgical quality metric as it is highly dependent upon many factors which are outside of the control of the operating surgeon. If LOS is ultimately to be used as a quality metric, such variables should be taken into account in risk-adjusted models. The optimal LOS following pulmonary lobectomy therefore remains unclear. What is clear however, is that the optimal LOS may be quite different for individual patients.
Funding
Funding for this project was provided by the Center for Perioperative Outcomes, Department of Anesthesiology at the Weill Cornell Medicine, NewYork-Presbyterian Hospital. Ms. Xian Wu, MPH, was partially supported by the following grant: Clinical and Translational Science Center at Weill Cornell Medicine (UL1-TR000457-06).
Conflict of interest: Co-authors Akshay U. Bhat, Ramin Zabih and Peter M. Fleischut have a financial interest in the company, Analytical Care.
REFERENCES
- 1.Krell RW, Girotti ME, Dimick JB. Extended length of stay after surgery: complications, inefficient practice, or sick patients? JAMA Surg 2014;149:815–20. [DOI] [PMC free article] [PubMed] [Google Scholar]
- 2.Romano PHP, Ritley D. Selecting Quality and Resource Use Measures: A Decision Guide for Community Quality Collaboratives. Agency for Healthcare Research and Quality, Rockville, MD: 2010. pp. 1–106. [Google Scholar]
- 3.Cohen ME, Bilimoria KY, Ko CY, Richards K, Hall BL. Variability in length of stay after colorectal surgery: assessment of 182 hospitals in the national surgical quality improvement program. Ann Surg 2009;250:901–7. [DOI] [PubMed] [Google Scholar]
- 4.Carey K. Measuring the hospital length of stay/readmission cost trade-off under a bundled payment mechanism. Health Econ 2014; doi:10.1002/hec.3061. [DOI] [PubMed]
- 5.Osnabrugge RL, Speir AM, Head SJ, Jones PG, Ailawadi G, Fonner CE, et al. Prediction of costs and length of stay in coronary artery bypass grafting. Ann Thorac Surg 2014;98:1286–93. [DOI] [PubMed] [Google Scholar]
- 6.Wright CD, Gaissert HA, Grab JD, O'Brien SM, Peterson ED, Allen MS. Predictors of prolonged length of stay after lobectomy for lung cancer: a Society of Thoracic Surgeons General Thoracic Surgery Database risk-adjustment model. Ann Thorac Surg 2008;85:1857–65. [DOI] [PubMed] [Google Scholar]
- 7.Farjah F, Lou F, Rusch VW, Rizk NP. The quality metric prolonged length of stay misses clinically important adverse events. Ann Thorac Surg 2012;94:881–7. [DOI] [PubMed] [Google Scholar]
- 8.Freixinet JL, Varela G, Molins L, Rivas JJ, Rodriguez-Paniagua JM, de Castro PL, et al. Benchmarking in thoracic surgery. Eur J Cardiothorac Surg 2011;40:124–9. [DOI] [PubMed] [Google Scholar]
- 9.Healthcare Cost and Utilization Project (HCUP). Rockville, MD, 2013. http://www.hcup-us.ahrq.gov/sidoverview.jsp (27 May 2015, date last accessed). [Google Scholar]
- 10.Stiles BM, Poon A, Giambrone GP, Gaber-Baylis LK, Wu X, Lee PC, et al. Incidence and factors associated with hospital readmission following pulmonary lobectomy. The Ann Thorac Surg 2015;pii:S0003-4975(15)01661-6. [Epub ahead of print]. [DOI] [PubMed] [Google Scholar]
- 11.Deyo RA, Cherkin DC, Ciol MA. Adapting a clinical comorbidity index for use with ICD-9-CM administrative databases. J Clin Epidemiol 1992;45:613–9. [DOI] [PubMed] [Google Scholar]
- 12.Quan H, Li B, Couris CM, Fushimi K, Graham P, Hider P, et al. Updating and validating the Charlson Comorbidity Index and score for risk adjustment in hospital discharge abstracts using data from 6 countries. Am J Epidemiol 2011;173:676–82. [DOI] [PubMed] [Google Scholar]
- 13.Paul S, Sedrakyan A, Chiu YL, Nasar A, Port JL, Lee PC, et al. Outcomes after lobectomy using thoracoscopy vs thoracotomy: a comparative effectiveness analysis utilizing the Nationwide Inpatient Sample database. Eur J Cardiothorac Surg 2013;43:813–7. [DOI] [PubMed] [Google Scholar]
- 14.Falcoz PE, Puyraveau M, Thomas PA, Decaluwe H, Hurtgen M, Petersen RH, et al. Video-assisted thoracoscopic surgery versus open lobectomy for primary non-small-cell lung cancer: a propensity-matched analysis of outcome from the European Society of Thoracic Surgeon database. Eur J Cardiothorac Surg 2015; doi:10.1093/ejcts/ezv154. [DOI] [PubMed] [Google Scholar]
- 15.Hu Y, McMurry TL, Isbell JM, Stukenborg GJ, Kozower BD. Readmission after lung cancer resection is associated with a 6-fold increase in 90-day postoperative mortality. J Thorac Cardiovasc Surg 2014;148:2261–7.e2261. [DOI] [PMC free article] [PubMed] [Google Scholar]
- 16.NQF. National Quality Forum Endorses National Consensus Standards Promoting Accountability and Public Reporting. 2008. www.qualityforum.org (27 May 2015, date last accessed). [Google Scholar]
- 17.Cleary R, Beard R, Coles J, Devlin B, Hopkins A, Schumacher D, et al. Comparative hospital databases: value for management and quality. Qual Health Care 1994;3:3–10. [DOI] [PMC free article] [PubMed] [Google Scholar]