We have successfully demonstrated that optical molecular imaging of marrow stromal cells (MSC) after cardiac cell therapy (CCT) for myocardial infarction can be used to quantitatively determine cell fate and to satisfy specific imaging end points needed for a follow-up large-animal, multimodality molecular imaging CCT study of the same MSC.
Abstract
Purpose
To use multimodality reporter-gene imaging to assess the serial survival of marrow stromal cells (MSC) after therapy for myocardial infarction (MI) and to determine if the requisite preclinical imaging end point was met prior to a follow-up large-animal MSC imaging study.
Materials and Methods
Animal studies were approved by the Institutional Administrative Panel on Laboratory Animal Care. Mice (n = 19) that had experienced MI were injected with bone marrow–derived MSC that expressed a multimodality triple fusion (TF) reporter gene. The TF reporter gene (fluc2-egfp-sr39ttk) consisted of a human promoter, ubiquitin, driving firefly luciferase 2 (fluc2), enhanced green fluorescent protein (egfp), and the sr39tk positron emission tomography reporter gene. Serial bioluminescence imaging of MSC-TF and ex vivo luciferase assays were performed. Correlations were analyzed with the Pearson product-moment correlation, and serial imaging results were analyzed with a mixed-effects regression model.
Results
Analysis of the MSC-TF after cardiac cell therapy showed significantly lower signal on days 8 and 14 than on day 2 (P = .011 and P = .001, respectively). MSC-TF with MI demonstrated significantly higher signal than MSC-TF without MI at days 4, 8, and 14 (P = .016). Ex vivo luciferase activity assay confirmed the presence of MSC-TF on days 8 and 14 after MI.
Conclusion
Multimodality reporter-gene imaging was successfully used to assess serial MSC survival after therapy for MI, and it was determined that the requisite preclinical imaging end point, 14 days of MSC survival, was met prior to a follow-up large-animal MSC study.
© RSNA, 2016
Introduction
Heart failure is responsible for one in 8.6 deaths and costs approximately $39 billion U.S. dollars annually (1). Cardiac cell therapy (CCT), a potential treatment for heart failure, has emerged as an extremely promising area of research and experimental therapy (2). Seminal studies of bone marrow–derived cells for acute myocardial infarction (MI) (3) spurred experimentation with several therapeutic cell types in clinical CCT trials (4), including bone marrow–derived marrow stromal cells (MSC). MSC are a nontumorigenic, adherent fraction of heterogeneous cells that exhibit spindlelike morphology and clonogenic growth and express CD90, CD105, and CD73 but not CD34 or CD45 (5). After acute MI, MSC reverse both pathologic remodeling and scar size and enhance both ventricular mass and ejection fraction (6,7). Overall, MSC have proven to be a safe, attractive, and potent candidate for CCT.
Despite the promise of MSC, linking preclinical CCT data in small animals with data in large animals and, eventually, humans has been an enormous challenge (8), in part because of the natural complicating factors of CCT. For example, CCT enables complex processes in vivo like multilineage growth and differentiation, angiogenesis, and ventricular remodeling, while pharmacologic therapy predictably targets a single cellular receptor for efficacy. Further confounding CCT is the choice of therapeutic cells (4,9) and cell delivery techniques (10), as well as the impact of host factors (11), suggesting that new approaches are needed to link data between model systems (12).
The ability to combine imaging modalities for a particular imaging strategy (13) by using reporter gene imaging is a critical approach for linking small-animal, large-animal, and, eventually, human CCT data. Fluorescent reporter genes, like egfp (enhanced green fluorescent protein) (14), enable the interrogation of cellular events in vitro but are not valuable for in vivo imaging, owing to background autofluorescence and both absorption and scattering of light (with some exceptions) (15–18). In contrast, the bioluminescent enzymatic reporter genes such as firefly luciferase (fluc or fluc2 [humanized fluc]) (19) have greatly facilitated in vivo imaging. The bioluminescent reporter genes emit linear signal proportional to luciferase activity over a wide range (20), with no background signal. Luciferases have been used to quantitatively assess stem cell differentiation (21) and to perform in vivo cell tracking (22) but demonstrate steep loss of sensitivity with incremental increases in tissue depth. A third approach is positron emission tomography (PET) reporter gene imaging, which enables equal spatial resolution or sensitivity at all depths. Three PET reporter genes, the hsv1tk, its sr39tk mutant, and the truncated sr39tk (sr39ttk), function by enabling selective accumulation of a radiolabeled reporter probe (23), and this approach has been used for CCT in small animals (22), large animals (24–26), and human patients (27). Importantly, the combination of the these three reporter genes, egfp, fluc2, and sr39ttk, expressed as a fused protein, the triple fusion (TF) reporter gene, enables multimodality cell imaging (13).
Here we have used multimodality reporter gene imaging to assess serial MSC survival after therapy for MI and to determine if the requisite preclinical imaging end point is met prior to a follow-up large-animal MSC imaging study.
Materials and Methods
Industry Support
We obtained financial support from the GE Global Research Center (Niskayuna, NY). S.B. worked for GE Global research center during a portion of the study. All other authors, who are not employees of GE Global Research Center, had control of inclusion of any data, and no information in this article represents any conflict of interest for S.B. or for the GE Global Research Center.
Study Workflow
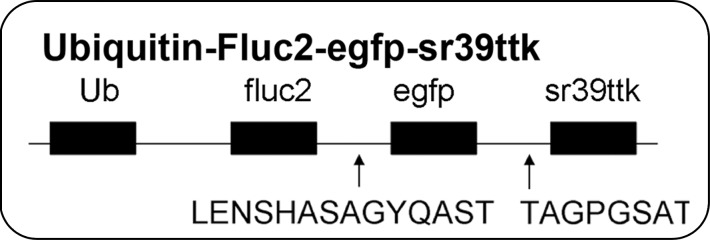
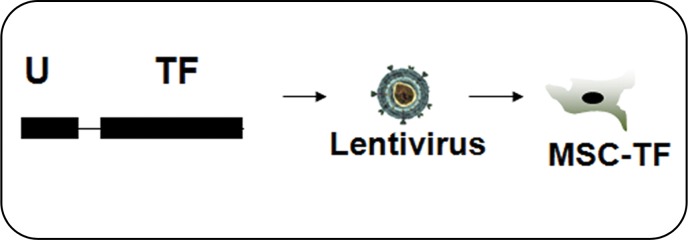
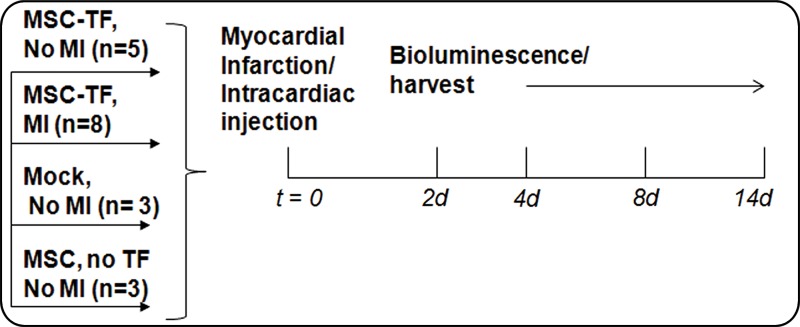
The TF reporter gene construct was composed of the human ubiquitin C promoter driving fluc2-egfp-sr39ttk (Fig 1a) in a second-generation lentiviral backbone and incorporated into lentivirus. MSC were transfected with lentivirus to create MSC-TF (Fig 1b). MSC-TF were expanded and sorted for EGFPhigh MSC-TF. These EGFPhigh MSC-TF were expanded for 2 weeks and re-sorted again for EGFPhigh expression. This serial sorting and expansion procedure was performed three times (Fig 1c). The final MSC-TF cell population was expanded and cryopreserved. It was hypothesized that MSC-TF could survive for 14 days in a murine MI model. The four groups used in the study were no MI (n = 5), MI (n = 8), mock injection (n = 3), and MSC with no TF (n = 3) (Fig 1d). Mice were imaged at four time points and harvested. Two separate groups of mice (MI [n = 8] and no MI [n = 5]) were analyzed for luciferase activity at three different time points.
Figure 1a:
General study design and workflow. (a) Schematic for the TF reporter gene construct fluc2-egfp-sr39ttk driven by the ubiquitin C promoter. The TF reporter gene consists of fluc2, a 14–amino acid spacer, egfp, an eight–amino acid spacer, and sr39ttk. (b) Schematic for lentiviral transduction of MSC. The ubiquitin (U) TF reporter gene construct was excised and cloned into a second-generation self-inactivating lentiviral vector system. High-titer lentivirus containing the ubiquitin TF reporter gene was produced, and MSC were transduced with lentivirus containing the ubiquitin TF reporter gene in cell culture, generating MSC-TF. (c) MSC-TF were expanded for 2 weeks and were then sorted for cells showing high enhanced green fluorescent protein (EGFP) (GFP+) and those showing low EGFP (GFP−). This was referred to as sort 1. After expansion in culture for 2 weeks, the EGFPhigh cells from sort 1 were sorted again; this was referred to as sort 2. Again, after expansion in culture, the EGFPhigh cells from sort 2 were sorted for high-expressing, EGFPhigh cells; this was referred to as sort 3. The EGFPhigh cells from sort 3 were expanded in culture, and the resulting MSC-TF were frozen in aliquots and used in all mouse, rat, and swine studies. (d) Schematic for study design for CCT after MI in mice. MSC-TF were divided into four groups, including MSC-TF with no MI (n = 5), MSC-TF with MI (n = 8), mock injection (n = 3), or MSC with no reporter gene (n = 3). Each group underwent MI induction, injection of 5 × 10⁵ MSC-TF, and bioluminescence imaging on days 2, 4, 8, and 14.
Figure 1b:
General study design and workflow. (a) Schematic for the TF reporter gene construct fluc2-egfp-sr39ttk driven by the ubiquitin C promoter. The TF reporter gene consists of fluc2, a 14–amino acid spacer, egfp, an eight–amino acid spacer, and sr39ttk. (b) Schematic for lentiviral transduction of MSC. The ubiquitin (U) TF reporter gene construct was excised and cloned into a second-generation self-inactivating lentiviral vector system. High-titer lentivirus containing the ubiquitin TF reporter gene was produced, and MSC were transduced with lentivirus containing the ubiquitin TF reporter gene in cell culture, generating MSC-TF. (c) MSC-TF were expanded for 2 weeks and were then sorted for cells showing high enhanced green fluorescent protein (EGFP) (GFP+) and those showing low EGFP (GFP−). This was referred to as sort 1. After expansion in culture for 2 weeks, the EGFPhigh cells from sort 1 were sorted again; this was referred to as sort 2. Again, after expansion in culture, the EGFPhigh cells from sort 2 were sorted for high-expressing, EGFPhigh cells; this was referred to as sort 3. The EGFPhigh cells from sort 3 were expanded in culture, and the resulting MSC-TF were frozen in aliquots and used in all mouse, rat, and swine studies. (d) Schematic for study design for CCT after MI in mice. MSC-TF were divided into four groups, including MSC-TF with no MI (n = 5), MSC-TF with MI (n = 8), mock injection (n = 3), or MSC with no reporter gene (n = 3). Each group underwent MI induction, injection of 5 × 10⁵ MSC-TF, and bioluminescence imaging on days 2, 4, 8, and 14.
Figure 1c:
General study design and workflow. (a) Schematic for the TF reporter gene construct fluc2-egfp-sr39ttk driven by the ubiquitin C promoter. The TF reporter gene consists of fluc2, a 14–amino acid spacer, egfp, an eight–amino acid spacer, and sr39ttk. (b) Schematic for lentiviral transduction of MSC. The ubiquitin (U) TF reporter gene construct was excised and cloned into a second-generation self-inactivating lentiviral vector system. High-titer lentivirus containing the ubiquitin TF reporter gene was produced, and MSC were transduced with lentivirus containing the ubiquitin TF reporter gene in cell culture, generating MSC-TF. (c) MSC-TF were expanded for 2 weeks and were then sorted for cells showing high enhanced green fluorescent protein (EGFP) (GFP+) and those showing low EGFP (GFP−). This was referred to as sort 1. After expansion in culture for 2 weeks, the EGFPhigh cells from sort 1 were sorted again; this was referred to as sort 2. Again, after expansion in culture, the EGFPhigh cells from sort 2 were sorted for high-expressing, EGFPhigh cells; this was referred to as sort 3. The EGFPhigh cells from sort 3 were expanded in culture, and the resulting MSC-TF were frozen in aliquots and used in all mouse, rat, and swine studies. (d) Schematic for study design for CCT after MI in mice. MSC-TF were divided into four groups, including MSC-TF with no MI (n = 5), MSC-TF with MI (n = 8), mock injection (n = 3), or MSC with no reporter gene (n = 3). Each group underwent MI induction, injection of 5 × 10⁵ MSC-TF, and bioluminescence imaging on days 2, 4, 8, and 14.
Figure 1d:
General study design and workflow. (a) Schematic for the TF reporter gene construct fluc2-egfp-sr39ttk driven by the ubiquitin C promoter. The TF reporter gene consists of fluc2, a 14–amino acid spacer, egfp, an eight–amino acid spacer, and sr39ttk. (b) Schematic for lentiviral transduction of MSC. The ubiquitin (U) TF reporter gene construct was excised and cloned into a second-generation self-inactivating lentiviral vector system. High-titer lentivirus containing the ubiquitin TF reporter gene was produced, and MSC were transduced with lentivirus containing the ubiquitin TF reporter gene in cell culture, generating MSC-TF. (c) MSC-TF were expanded for 2 weeks and were then sorted for cells showing high enhanced green fluorescent protein (EGFP) (GFP+) and those showing low EGFP (GFP−). This was referred to as sort 1. After expansion in culture for 2 weeks, the EGFPhigh cells from sort 1 were sorted again; this was referred to as sort 2. Again, after expansion in culture, the EGFPhigh cells from sort 2 were sorted for high-expressing, EGFPhigh cells; this was referred to as sort 3. The EGFPhigh cells from sort 3 were expanded in culture, and the resulting MSC-TF were frozen in aliquots and used in all mouse, rat, and swine studies. (d) Schematic for study design for CCT after MI in mice. MSC-TF were divided into four groups, including MSC-TF with no MI (n = 5), MSC-TF with MI (n = 8), mock injection (n = 3), or MSC with no reporter gene (n = 3). Each group underwent MI induction, injection of 5 × 10⁵ MSC-TF, and bioluminescence imaging on days 2, 4, 8, and 14.
Culture of MSC and MSC-TF
To avoid variation in rat MSC isolation, all reagents, including MSC, culture medium, and serum supplement, were purchased together (Cell Applications, San Diego, Calif; catalog number, #R492–05). Cells at passage 2 were received, thawed, washed, and cultured in tissue culture–treated T225 flasks (Corning, Corning, NY) in a volume of 25 mL medium with 1% penicillin/streptomycin (Life Technologies [Invitrogen], Carlsbad, Calif) and 10 mg/mL gentamycin (Gibco; Life Technologies, #15710–064). Further details are provided in Appendix E1 (online).
Construction of Lentivirus Containing the TF Reporter Gene
The TF reporter gene construct consisted of firefly luciferase 2 (fluc2); enhanced green fluorescent protein (egfp); and truncated, mutated herpes simplex virus type I thymidine kinase (sr39ttk), together called FGT, and was modified from the original (13). The FGT vector was excised from the pcDNA vector and was used to replace the egfp sequence in pFUG (kindly provided by Dr Owen Witte, of the University of California Los Angeles) that contained the ubiquitin C promoter. Blunt-end cloning was used to create the lentiviral vector pFU FGT (pFU-ubiquitin-fluc2-egfp-sr39ttk). This vector contains FGT driven by the ubiquitin C promoter (Fig 1a, 1b). The reporter gene construct was approximately 3.45 kb and consisted of “F” (fluc2, 1.6 kb), “G” (egfp, 795 bp), and “T” (sr39 truncated mutated HSV1-tk, 993 bp), along with the two small spacers (Fig 1b).
Lentiviral Vector Production and Calculation of Virus Titer
The pFU-FGT vector containing the TF reporter gene was used to engineer a high-titer self-inactivating lentivirus with a second-generation lentiviral vector system, as described previously (16). Further details are provided in Appendix E1 (online).
Transduction of MSC with Lentivirus Containing the TF Reporter Gene
MSC were washed and plated into a T75 flask (Corning) at 500 000 cells per flask. A 5-mL mixture of OptiMEM (Life Technologies [Invitrogen], #31985070) with 1% penicillin/streptomycin (Life Technologies [Invitrogen]) and 8 µg/mL polybrene (Sigma-Aldrich, Milwaukee, Wis; #AL-118) was added to titered lentivirus at a multiplicity of infection of 10. Medium was replaced after 8–12 hours and then every other day. The resulting MSC are referred to as MSC-TF throughout this report.
Fluorescence-activated Serial Cell Sorting of MSC-TF
To obtain MSC-TF that expressed the highest levels of the TF reporter gene after lentiviral transfection, MSC-TF were serially expanded for 2 weeks and were serially sorted for EGFPhigh cells, as described in the Study Workflow section and Fig 1c. Fluorescence-activated serial cell sorting was performed by using the Stanford University shared cell-sorting facility. For cell sorting, gates were drawn on the phycoerythrin-against-EGFP plot, and the EGFPhigh cells that were sorted were typically at 103–104 in arbitrary fluorescence level, at least 100 times higher than background, and clearly shifted toward the EGFP axis. During each sort, approximately 1%–10% of total cells were expanded. Further details are provided in Appendix E1 (online).
In Vitro Bioluminescence Imaging of MSC-TF
To determine levels of reporter gene activity, MSC-TF populations were assessed for FLUC2 activity. The following three populations were analyzed with bioluminescence imaging: (a) high-expressing MSC-TF from the first sort, (b) high-expressing MSC-TF from the second sort, and (c) high-expressing MSC-TF from the third sort. Bioluminescence imaging was performed by using an IVIS-50 cooled charge-coupled device camera system (Caliper Life Sciences, Hopkinton, Mass). Medium binning, defined by using Living Image Software, version 2.5 (Xenogen, Alameda, Calif), was used during the analysis. Ten thousand cells from the first, second, and third sorts were plated per well in a 48-well plate. The average radiance (in photons per second per square centimeter per steridian) was calculated for five samples and was compared between each condition. Further details are provided in Appendix E1 (online).
Cell Culture Uptake Studies of MSC-TF Populations for Thymidine Kinase Activity
To determine levels of reporter gene activity of SR39TTK, MSC-TF, already serially sorted three times, were assessed for thymidine kinase activity compared with MSC alone. Further details are provided in Appendix E1 (online).
Immunocytochemistry of MSC
We characterized rat MSC and MSC-TF for the established cell surface markers CD45 (Biolegend, San Diego, Calif; #202201), CD90 (Biolegend, #202501), and CD105 (Santa Cruz, Santa Cruz, Calif; #SC-19793) using immunohistochemistry. Further details are provided in Appendix E1 (online).
MTT Assay of MSC-TF
Tetrazolium dye (3-(4,5-dimethylthiazol-2-yl)-2,5-diphenyltetrazolium bromide) MTT assays were performed by using the Vybrant MTT cell proliferation kit (Life Technologies, #V13154) according to the manufacturer’s instructions. Further details are provided in Appendix E1 (online).
In Vivo Bioluminescence Imaging of Subcutaneously Implanted MSC-TF
All animal procedures were approved by the Institutional Administrative Panel on Laboratory Animal Care at Stanford University. So that we could determine whether signal correlated with cell number, MSC-TF were implanted at equal cell numbers, subcutaneously in the right and left hind limbs of each nude mice, over several cell numbers (16 injections in eight mice), and were imaged with bioluminescence. Mice were anesthetized with 2% isofluorane, were placed into the IVIS 200 (Caliper Life Sciences), and were kept in a continuous state of anesthesia for bioluminescence imaging. Medium binning, defined by using Living Image Software, version 2.5 (manufacturer), was used during the analysis. In each mouse, two technical replicates were performed, and these data were plotted as means ± standard deviations at each cell number. The mean values at each cell number were correlated. Further details are provided in Appendix E1 (online).
Induction of MI in Mice and Intracardiac MSC Injection
Animal procedures were approved as stated above. All surgical procedures were performed in 8–10-week-old female nude mice (Charles River Laboratories, Davis, Calif) and were performed by three microsurgeons with extensive experience (J.E.C., and A.B.G.). Briefly, after thoracotomy and left anterior descending artery ligation, 5 × 10⁵ MSC-TF in a total volume of 20 µL of phosphate-buffered saline with 50% Matrigel (BD Biosciences, San Jose, Calif; #356234) were injected intramyocardially, and the animals were allowed to recover. Further details are provided in Appendix E1 (online).
Induction of MI in Rats and Intracardiac MSC Injection
Animal procedures were approved as stated above. All surgical procedures were performed in adult female Sprague-Dawley rats (weight range, 200–300 g; Charles River Laboratories, Wilmington, Mass) by a single experienced microsurgeon. Briefly, after thoracotomy and left anterior descending artery ligation, 5 × 10⁶ MSC-TF in a total volume of 50 µL of phosphate-buffered saline with 50% Matrigel (BD Biosciences, #356234) were injected intramyocardially, and the animals were allowed to recover. Further details are provided in Appendix E1 (online).
In Vivo Bioluminescence Imaging of MSC-TF after CCT
Animal procedures were approved as stated above. Bioluminescence imaging was performed as described above. The maximum radiance or average radiance (in photons per second per square centimeter per steridian) was calculated and compared between conditions. For the CCT studies, animals were imaged on days 2, 4, 8, and 14. The four groups evaluated were MSC-TF with no MI (n = 5), MSC-TF with MI (n = 8), mock injection (n = 3), and MSC with no reporter gene (n = 3). Further details are provided in Appendix E1 (online).
Luminometry Assay for Luciferase Activity on Ex Vivo Heart Tissue
Two separate groups of mice (eight with MI and five without MI) were analyzed for ex vivo luciferase activity by sacrificing the mice on days 4, 8, and 14 and using the Luciferase Assay System (Promega, Fitchburg, Wis; #E1500). Further details are provided in Appendix E1 (online).
Statistical Analysis
Data are reported as means ± standard deviations. For comparison of two groups, means were compared, and a Student t test was used to calculate P values. An α = .05 was considered to indicate a significant difference, and a two-tailed distribution was assumed. The sample size for each comparison is stated in the Results section and/or in the figure legends. This approach was used for comparison of MSC-TF that were sorted different amounts of times (Fig 2, B and C), and for comparing MSC and MSC-TF with and those without SR39TTK activity (Fig 2, D). For comparing mice with MSC-TF and MI and mice without MI, effects of time point and group were assessed with a mixed-effects regression of log signal on time point and group, with mouse sample as the random effect. For data correlations, the Pearson product-moment correlation was performed, and P = .05 were considered to indicate a significant difference. This analysis was performed for correlation between bioluminescence and subcutaneously transplanted MSC-TF cell number and between ex vivo luciferase activity and in vivo bioluminescence. Listed for each correlation is the correlation coefficient and P value. We also recorded the standard error of the correlation coefficient, the t test for significance, and degrees of freedom. These calculations were made by using a statistical software package (Statistics Calculator, version 3.0; StatPac, Bloomington, Minn). The mixed-effects regression model was calculated by using Stata, release 14 (Stata, College Station, Tex). The assumption for each cell injection as a single sample was two-tailed distribution samples of equal variance.
Figure 2:
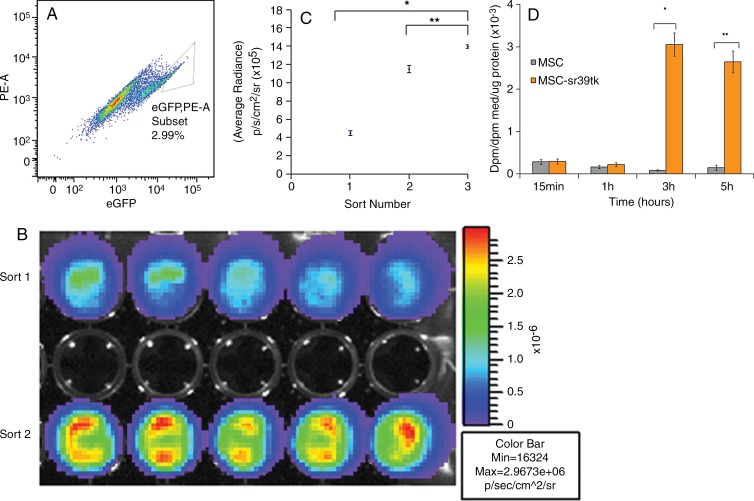
In vitro characterization of engineered MSC-TF. A, Dot plot shows phycoerythrin (PE) versus EGFP from fluorescence-activated cell sorting of the second serial sort of MSC-TF. A gate was drawn around EGFPhigh MSC-TF, which were sorted and represented 2.99% of the population. B, In vitro bioluminescence image of FLUC2 signal obtained by using a cooled charge-coupled device, or CCD, camera shows equal amounts of two unique EGFPhigh MSC-TF sorted populations. Top row: EGFPhigh MSC-TF from the first sort. Bottom row: EGFPhigh cells from the second sort. Signal is measured in photons per second per square centimeter per steridian. C, Plot of bioluminescence signal versus number of serially sorted MSC-TF. MSC-TF were sorted for the EGFPhigh (and hence high-FLUC2) population after three serial sorts. Ten thousand cells from the first, second, and third sorts were plated per well in a 48-well plate. The average radiance (in photons per second per square centimeter per steridian) was calculated for five samples and was compared between each condition. The means ± standard deviations of the average radiance were plotted. Statistically significant differences are depicted with an asterisk (* = sort 1 and sort 3, P = .0001) or (** = sort 2 and 3, P = .0001). D, Bar graph shows ability to accumulate 8–3H-penciclovir, a substrate for sr39ttk, versus time in cell culture. MSC-TF (serially sorted three times) were cultured in 12-well plates and were exposed to 8–3H-penciclovir (0.82 µCi/mL) for 15 minutes to 5 hours. Data were expressed in disintegrations per minute (dpm), as (dpm cells/dpm medium [med]/microgram protein), or as fractional uptake of 8–3H-penciclovir for three samples.
Results
In Vitro Characterization of Engineered MSC-TF
MSC-TF were serially sorted by using fluorescence-activated cell sorting, and the EGFPhigh population from the third sort was used for all animal experiments. In a typical sort, 2%–5% of the EGFPhigh population was selected (Fig 2, A). As expected, MSC-TF demonstrated increasing bioluminescence signal due to increasing FLUC2 activity after each serial sort (Fig 2, B and C; sort 1 and sort 3, P = .0001; sort 2 and 3, P = .0001). These triple-sorted MSC-TF showed statistically significant uptake of the radiolabeled reporter probe, indicating HSV1-SR39TTK activity in MSC-TF (Fig 2, D; P = .0007 at 3 hours and P = .0001 at 5 hours).
In Vitro Characterization of MSC-TF
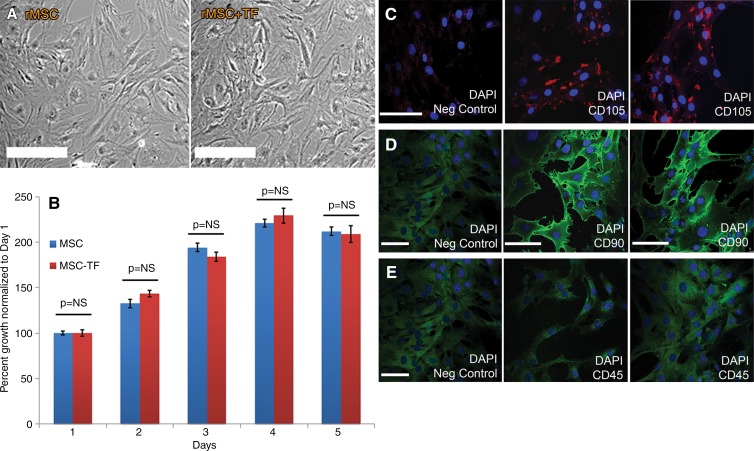
Both MSC and MSC-TF showed spindlelike morphology, and no morphologic differences were observed (Fig 3, A). MSC and MSC-TF expressed normal proliferative ability when assessed for 5 days in cell culture (Fig 3, B). Immunostaining for CD105 demonstrated clear staining in punctuate areas primarily on the cell surface compared with negative controls (Fig 3, C–E). Immunostaining for CD90 demonstrated clear detection on the cell surface compared with negative controls. Immunostaining for CD45 demonstrated no difference compared with negative controls, as expected. These data indicate that MSC-TF display normal morphology and growth and a CD105(+)-CD90(+)-CD45(−) phenotype, as expected.
Figure 3:
In vitro characterization of MSC-TF. A, Phase-contrast micrographs of rat MSC (rMSC) and MSC-TF (rMSC-TF ) show no differences in morphology. Bar = 100 μm. B, Bar graph shows results of MTT assay of cellular proliferation in MSC and MSC-TF. Twenty thousand cells were plated in 12-well plates and assayed for proliferative activity on days 1, 2, 3, 4, and 5. MTT assays at each time point were normalized to day 1 and performed in duplicate. Three replicates per experiment for three experiments were performed. Means ± standard errors of the mean are plotted. P = NS (not significant) for all time points. C, Immunocytochemistry of MSC-TF for CD105. Left: Negative (Neg) control, which was stained only with secondary antibody. Middle and right: Images in two independent fields. Bar = 100 µm. D, Immunocytochemistry of MSC-TF for CD90. Left: Negative (Neg) control, which was stained only with secondary antibody. Middle and right: Images in two independent fields. Bar = 100 µm. E, Immunocytochemistry of MSC-TF for CD45. Left: Negative (Neg) control, which was stained only with secondary antibody. Middle and right: Images in two independent fields. Bar = 100 μm.
Optical in Vivo Imaging of Transplanted MSC in a Small-Animal Model of MI
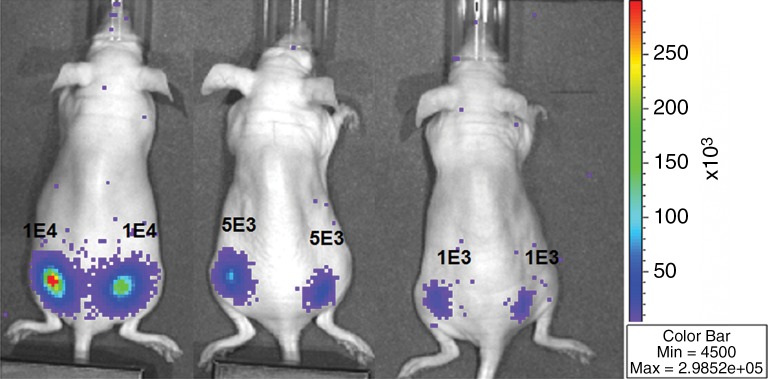
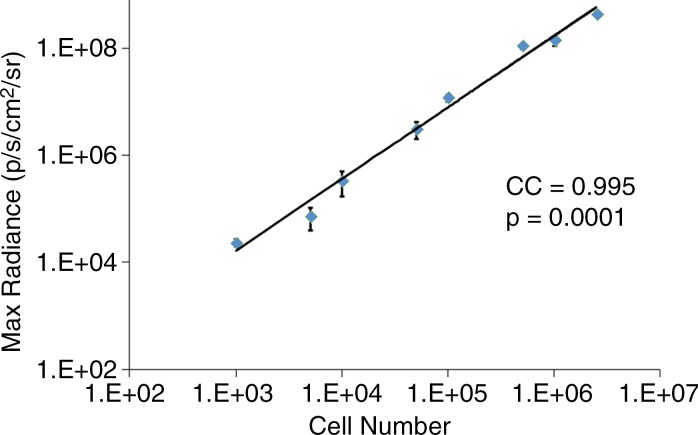
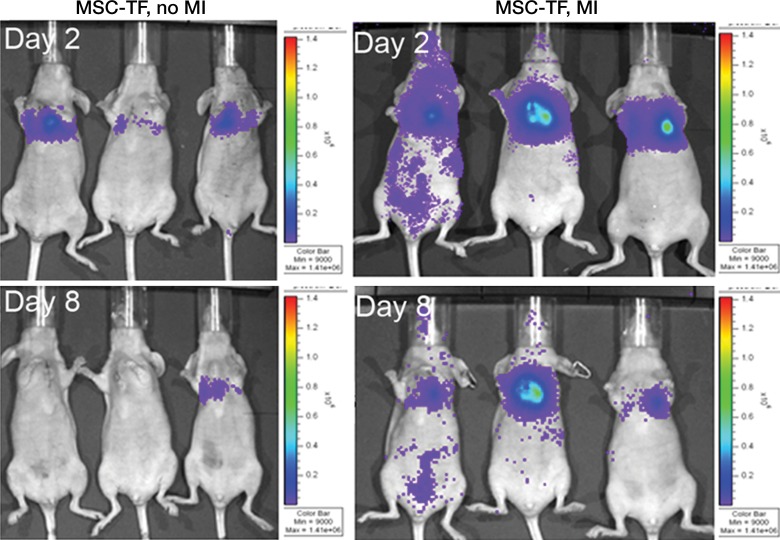
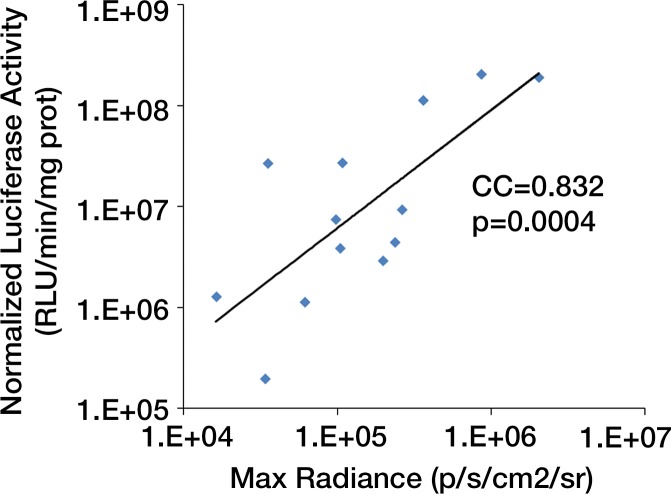
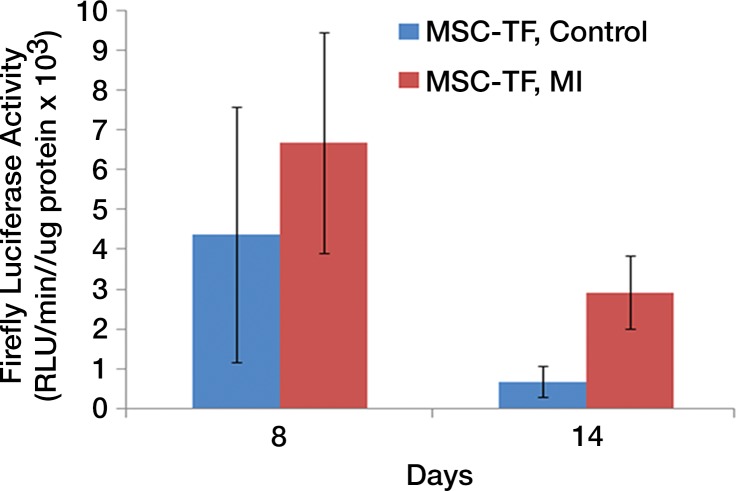
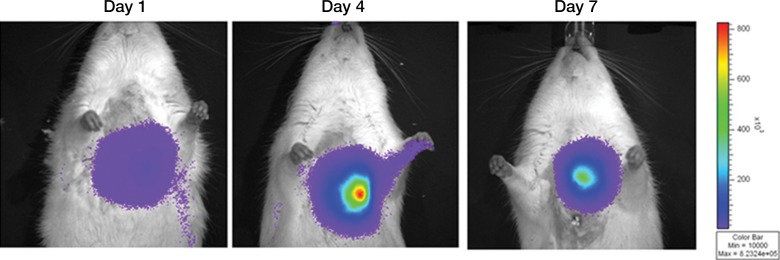
We first calculated the limit of detection in vivo to be at least 1 × 10³ cells, with a linear relationship between cell number and signaling (Fig 4a, 4b; n = 8; correlation coefficient = 0.995; P = .0001). Analysis of the MSC-TF transplanted into animals with and those without MI demonstrated that signal was significantly lower on days 8 and 14 than on day 2 (P = .011 and P = .001, respectively), as expected, indicating cell death over time (Fig 4c, 4d). Importantly, MSC-TF with MI demonstrated significantly higher signal than did MSC-TF without MI at days 4, 8, and 14 (P = .016) (Fig 4c, 4d). We correlated ex vivo luciferase activity with in vivo bioluminescence (Fig 4e, correlation coefficient = 0.832, P = .004). We determined the presence of ex vivo luciferase activity between MSC-TF with no MI (n = 6) and MSC-TF with MI (n = 8) at days 4, 8, and 14 (Fig 4f, day 8 and 14 shown), and this showed similar trends to those in Figure 4d. Finally, we imaged the same MSC-TF in a rat model of MI, demonstrating survival on day 7 (Fig 4g).
Figure 4a:
Optical imaging of transplanted MSC in a small-animal model of MI. (a) In vivo bioluminescence image of representative nude mice subcutaneously injected with various amounts of triple-sorted MSC-TF shows mice injected with between 1 × 10³, 5 × 10³, and 5 × 10⁴ MSC-TF, as labeled. The imaging parameters were as follows: medium binning; field of view, 12 cm; f-stop, 1; and time, 20 seconds. (b) Graph shows quantitation of bioluminescence images in a by using the maximum radiance (photons per second per square centimeter per steridian) for each injection and the plotted means ± standard deviations for eight cell numbers (two injections per cell number) (there were 16 injections in eight mice; correlation coefficient = 0.995, P = .0001). (c) Serial in vivo bioluminescence images of nude mice after CCT with MSC-TF show the same three mice from the MSC-TF-no-MI and MSC-TF MI groups on days 2 and 8. The imaging parameters were as follows: medium binning; field of view, 12 cm; f-stop, 1; and time, 1 minute. Optical imaging of transplanted MSC in a small-animal model of MI. (d) Bar graph shows differences in cell growth kinetics between the mock-injection group (n = 3), the group with MSC but no reporter (n = 3), the group with MSC-TF but no MI (n = 5), and the group with MSC-TF and MI (n = 8) for images of nude mice after CCT with MSC-TF. Maximum (Max) radiance (in photons per second per square centimeter per steridian) was calculated for each region of interest, was averaged between mice of the same group, and was plotted as the mean ± standard deviation. Analysis with a mixed regression model showed significantly lower signal on days 8 and 14 than on day 2 (P = .011 and P = .001, respectively). The group with MSC-TF and MI showed significantly higher signal than the group without MI at days 4, 8, and 14 (P = .016). (e) Scatterplot shows correlation of normalized luciferase activity (in relative light units [RLU] per minute per microgram [of total heart protein]) of ex vivo heart lysates versus maximum radiance (in photons per second per square centimeter per steridian) for 13 mice at days 4, 8, and 12. Data were pooled from the MSC-TF-with-no-MI (n = 6) and MSC-TF-with-MI (n = 8) conditions. Luciferase activity versus maximum radiance was correlated (correlation coefficient = 0.832, P = .0004). (f) Bar graph shows normalized luciferase activity (in relative light units [RLU] per minute per microgram [of total heart protein]) of heart lysates after transplantation of MSC-TF, with and without MI, on days 8 and 14. Conditions were MSC-TF with no MI on day 8 (n = 2) and day 14 (n = 2) compared with MSC-TF with MI on day 8 (n = 2) and day 14 (n = 3). Data are plotted as means ± standard errors of the mean. (g) Bioluminescence images show activity in rats at days 1, 4, and 7 after 5 × 10⁶ MSC-TF for CCT after MI.
Figure 4b:
Optical imaging of transplanted MSC in a small-animal model of MI. (a) In vivo bioluminescence image of representative nude mice subcutaneously injected with various amounts of triple-sorted MSC-TF shows mice injected with between 1 × 10³, 5 × 10³, and 5 × 10⁴ MSC-TF, as labeled. The imaging parameters were as follows: medium binning; field of view, 12 cm; f-stop, 1; and time, 20 seconds. (b) Graph shows quantitation of bioluminescence images in a by using the maximum radiance (photons per second per square centimeter per steridian) for each injection and the plotted means ± standard deviations for eight cell numbers (two injections per cell number) (there were 16 injections in eight mice; correlation coefficient = 0.995, P = .0001). (c) Serial in vivo bioluminescence images of nude mice after CCT with MSC-TF show the same three mice from the MSC-TF-no-MI and MSC-TF MI groups on days 2 and 8. The imaging parameters were as follows: medium binning; field of view, 12 cm; f-stop, 1; and time, 1 minute. Optical imaging of transplanted MSC in a small-animal model of MI. (d) Bar graph shows differences in cell growth kinetics between the mock-injection group (n = 3), the group with MSC but no reporter (n = 3), the group with MSC-TF but no MI (n = 5), and the group with MSC-TF and MI (n = 8) for images of nude mice after CCT with MSC-TF. Maximum (Max) radiance (in photons per second per square centimeter per steridian) was calculated for each region of interest, was averaged between mice of the same group, and was plotted as the mean ± standard deviation. Analysis with a mixed regression model showed significantly lower signal on days 8 and 14 than on day 2 (P = .011 and P = .001, respectively). The group with MSC-TF and MI showed significantly higher signal than the group without MI at days 4, 8, and 14 (P = .016). (e) Scatterplot shows correlation of normalized luciferase activity (in relative light units [RLU] per minute per microgram [of total heart protein]) of ex vivo heart lysates versus maximum radiance (in photons per second per square centimeter per steridian) for 13 mice at days 4, 8, and 12. Data were pooled from the MSC-TF-with-no-MI (n = 6) and MSC-TF-with-MI (n = 8) conditions. Luciferase activity versus maximum radiance was correlated (correlation coefficient = 0.832, P = .0004). (f) Bar graph shows normalized luciferase activity (in relative light units [RLU] per minute per microgram [of total heart protein]) of heart lysates after transplantation of MSC-TF, with and without MI, on days 8 and 14. Conditions were MSC-TF with no MI on day 8 (n = 2) and day 14 (n = 2) compared with MSC-TF with MI on day 8 (n = 2) and day 14 (n = 3). Data are plotted as means ± standard errors of the mean. (g) Bioluminescence images show activity in rats at days 1, 4, and 7 after 5 × 10⁶ MSC-TF for CCT after MI.
Figure 4c:
Optical imaging of transplanted MSC in a small-animal model of MI. (a) In vivo bioluminescence image of representative nude mice subcutaneously injected with various amounts of triple-sorted MSC-TF shows mice injected with between 1 × 10³, 5 × 10³, and 5 × 10⁴ MSC-TF, as labeled. The imaging parameters were as follows: medium binning; field of view, 12 cm; f-stop, 1; and time, 20 seconds. (b) Graph shows quantitation of bioluminescence images in a by using the maximum radiance (photons per second per square centimeter per steridian) for each injection and the plotted means ± standard deviations for eight cell numbers (two injections per cell number) (there were 16 injections in eight mice; correlation coefficient = 0.995, P = .0001). (c) Serial in vivo bioluminescence images of nude mice after CCT with MSC-TF show the same three mice from the MSC-TF-no-MI and MSC-TF MI groups on days 2 and 8. The imaging parameters were as follows: medium binning; field of view, 12 cm; f-stop, 1; and time, 1 minute. Optical imaging of transplanted MSC in a small-animal model of MI. (d) Bar graph shows differences in cell growth kinetics between the mock-injection group (n = 3), the group with MSC but no reporter (n = 3), the group with MSC-TF but no MI (n = 5), and the group with MSC-TF and MI (n = 8) for images of nude mice after CCT with MSC-TF. Maximum (Max) radiance (in photons per second per square centimeter per steridian) was calculated for each region of interest, was averaged between mice of the same group, and was plotted as the mean ± standard deviation. Analysis with a mixed regression model showed significantly lower signal on days 8 and 14 than on day 2 (P = .011 and P = .001, respectively). The group with MSC-TF and MI showed significantly higher signal than the group without MI at days 4, 8, and 14 (P = .016). (e) Scatterplot shows correlation of normalized luciferase activity (in relative light units [RLU] per minute per microgram [of total heart protein]) of ex vivo heart lysates versus maximum radiance (in photons per second per square centimeter per steridian) for 13 mice at days 4, 8, and 12. Data were pooled from the MSC-TF-with-no-MI (n = 6) and MSC-TF-with-MI (n = 8) conditions. Luciferase activity versus maximum radiance was correlated (correlation coefficient = 0.832, P = .0004). (f) Bar graph shows normalized luciferase activity (in relative light units [RLU] per minute per microgram [of total heart protein]) of heart lysates after transplantation of MSC-TF, with and without MI, on days 8 and 14. Conditions were MSC-TF with no MI on day 8 (n = 2) and day 14 (n = 2) compared with MSC-TF with MI on day 8 (n = 2) and day 14 (n = 3). Data are plotted as means ± standard errors of the mean. (g) Bioluminescence images show activity in rats at days 1, 4, and 7 after 5 × 10⁶ MSC-TF for CCT after MI.
Figure 4d:
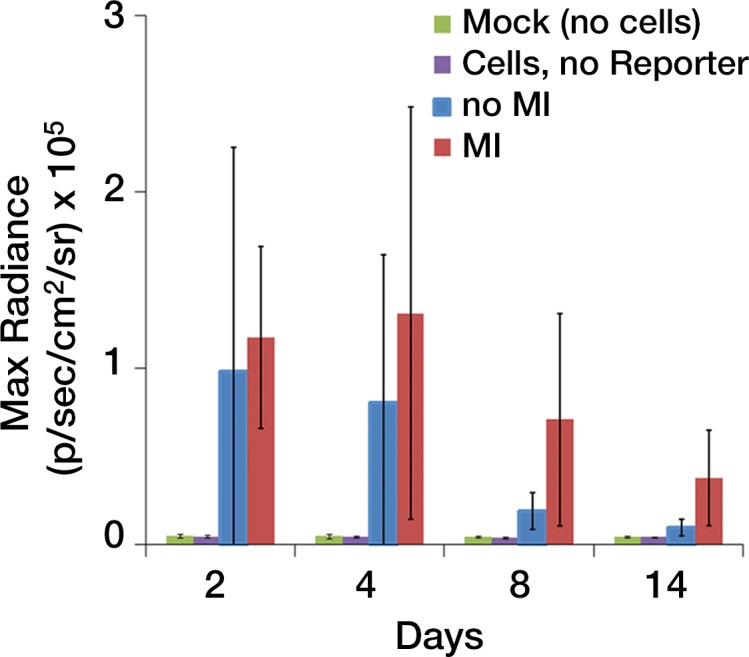
Optical imaging of transplanted MSC in a small-animal model of MI. (a) In vivo bioluminescence image of representative nude mice subcutaneously injected with various amounts of triple-sorted MSC-TF shows mice injected with between 1 × 10³, 5 × 10³, and 5 × 10⁴ MSC-TF, as labeled. The imaging parameters were as follows: medium binning; field of view, 12 cm; f-stop, 1; and time, 20 seconds. (b) Graph shows quantitation of bioluminescence images in a by using the maximum radiance (photons per second per square centimeter per steridian) for each injection and the plotted means ± standard deviations for eight cell numbers (two injections per cell number) (there were 16 injections in eight mice; correlation coefficient = 0.995, P = .0001). (c) Serial in vivo bioluminescence images of nude mice after CCT with MSC-TF show the same three mice from the MSC-TF-no-MI and MSC-TF MI groups on days 2 and 8. The imaging parameters were as follows: medium binning; field of view, 12 cm; f-stop, 1; and time, 1 minute. Optical imaging of transplanted MSC in a small-animal model of MI. (d) Bar graph shows differences in cell growth kinetics between the mock-injection group (n = 3), the group with MSC but no reporter (n = 3), the group with MSC-TF but no MI (n = 5), and the group with MSC-TF and MI (n = 8) for images of nude mice after CCT with MSC-TF. Maximum (Max) radiance (in photons per second per square centimeter per steridian) was calculated for each region of interest, was averaged between mice of the same group, and was plotted as the mean ± standard deviation. Analysis with a mixed regression model showed significantly lower signal on days 8 and 14 than on day 2 (P = .011 and P = .001, respectively). The group with MSC-TF and MI showed significantly higher signal than the group without MI at days 4, 8, and 14 (P = .016). (e) Scatterplot shows correlation of normalized luciferase activity (in relative light units [RLU] per minute per microgram [of total heart protein]) of ex vivo heart lysates versus maximum radiance (in photons per second per square centimeter per steridian) for 13 mice at days 4, 8, and 12. Data were pooled from the MSC-TF-with-no-MI (n = 6) and MSC-TF-with-MI (n = 8) conditions. Luciferase activity versus maximum radiance was correlated (correlation coefficient = 0.832, P = .0004). (f) Bar graph shows normalized luciferase activity (in relative light units [RLU] per minute per microgram [of total heart protein]) of heart lysates after transplantation of MSC-TF, with and without MI, on days 8 and 14. Conditions were MSC-TF with no MI on day 8 (n = 2) and day 14 (n = 2) compared with MSC-TF with MI on day 8 (n = 2) and day 14 (n = 3). Data are plotted as means ± standard errors of the mean. (g) Bioluminescence images show activity in rats at days 1, 4, and 7 after 5 × 10⁶ MSC-TF for CCT after MI.
Figure 4e:
Optical imaging of transplanted MSC in a small-animal model of MI. (a) In vivo bioluminescence image of representative nude mice subcutaneously injected with various amounts of triple-sorted MSC-TF shows mice injected with between 1 × 10³, 5 × 10³, and 5 × 10⁴ MSC-TF, as labeled. The imaging parameters were as follows: medium binning; field of view, 12 cm; f-stop, 1; and time, 20 seconds. (b) Graph shows quantitation of bioluminescence images in a by using the maximum radiance (photons per second per square centimeter per steridian) for each injection and the plotted means ± standard deviations for eight cell numbers (two injections per cell number) (there were 16 injections in eight mice; correlation coefficient = 0.995, P = .0001). (c) Serial in vivo bioluminescence images of nude mice after CCT with MSC-TF show the same three mice from the MSC-TF-no-MI and MSC-TF MI groups on days 2 and 8. The imaging parameters were as follows: medium binning; field of view, 12 cm; f-stop, 1; and time, 1 minute. Optical imaging of transplanted MSC in a small-animal model of MI. (d) Bar graph shows differences in cell growth kinetics between the mock-injection group (n = 3), the group with MSC but no reporter (n = 3), the group with MSC-TF but no MI (n = 5), and the group with MSC-TF and MI (n = 8) for images of nude mice after CCT with MSC-TF. Maximum (Max) radiance (in photons per second per square centimeter per steridian) was calculated for each region of interest, was averaged between mice of the same group, and was plotted as the mean ± standard deviation. Analysis with a mixed regression model showed significantly lower signal on days 8 and 14 than on day 2 (P = .011 and P = .001, respectively). The group with MSC-TF and MI showed significantly higher signal than the group without MI at days 4, 8, and 14 (P = .016). (e) Scatterplot shows correlation of normalized luciferase activity (in relative light units [RLU] per minute per microgram [of total heart protein]) of ex vivo heart lysates versus maximum radiance (in photons per second per square centimeter per steridian) for 13 mice at days 4, 8, and 12. Data were pooled from the MSC-TF-with-no-MI (n = 6) and MSC-TF-with-MI (n = 8) conditions. Luciferase activity versus maximum radiance was correlated (correlation coefficient = 0.832, P = .0004). (f) Bar graph shows normalized luciferase activity (in relative light units [RLU] per minute per microgram [of total heart protein]) of heart lysates after transplantation of MSC-TF, with and without MI, on days 8 and 14. Conditions were MSC-TF with no MI on day 8 (n = 2) and day 14 (n = 2) compared with MSC-TF with MI on day 8 (n = 2) and day 14 (n = 3). Data are plotted as means ± standard errors of the mean. (g) Bioluminescence images show activity in rats at days 1, 4, and 7 after 5 × 10⁶ MSC-TF for CCT after MI.
Figure 4f:
Optical imaging of transplanted MSC in a small-animal model of MI. (a) In vivo bioluminescence image of representative nude mice subcutaneously injected with various amounts of triple-sorted MSC-TF shows mice injected with between 1 × 10³, 5 × 10³, and 5 × 10⁴ MSC-TF, as labeled. The imaging parameters were as follows: medium binning; field of view, 12 cm; f-stop, 1; and time, 20 seconds. (b) Graph shows quantitation of bioluminescence images in a by using the maximum radiance (photons per second per square centimeter per steridian) for each injection and the plotted means ± standard deviations for eight cell numbers (two injections per cell number) (there were 16 injections in eight mice; correlation coefficient = 0.995, P = .0001). (c) Serial in vivo bioluminescence images of nude mice after CCT with MSC-TF show the same three mice from the MSC-TF-no-MI and MSC-TF MI groups on days 2 and 8. The imaging parameters were as follows: medium binning; field of view, 12 cm; f-stop, 1; and time, 1 minute. Optical imaging of transplanted MSC in a small-animal model of MI. (d) Bar graph shows differences in cell growth kinetics between the mock-injection group (n = 3), the group with MSC but no reporter (n = 3), the group with MSC-TF but no MI (n = 5), and the group with MSC-TF and MI (n = 8) for images of nude mice after CCT with MSC-TF. Maximum (Max) radiance (in photons per second per square centimeter per steridian) was calculated for each region of interest, was averaged between mice of the same group, and was plotted as the mean ± standard deviation. Analysis with a mixed regression model showed significantly lower signal on days 8 and 14 than on day 2 (P = .011 and P = .001, respectively). The group with MSC-TF and MI showed significantly higher signal than the group without MI at days 4, 8, and 14 (P = .016). (e) Scatterplot shows correlation of normalized luciferase activity (in relative light units [RLU] per minute per microgram [of total heart protein]) of ex vivo heart lysates versus maximum radiance (in photons per second per square centimeter per steridian) for 13 mice at days 4, 8, and 12. Data were pooled from the MSC-TF-with-no-MI (n = 6) and MSC-TF-with-MI (n = 8) conditions. Luciferase activity versus maximum radiance was correlated (correlation coefficient = 0.832, P = .0004). (f) Bar graph shows normalized luciferase activity (in relative light units [RLU] per minute per microgram [of total heart protein]) of heart lysates after transplantation of MSC-TF, with and without MI, on days 8 and 14. Conditions were MSC-TF with no MI on day 8 (n = 2) and day 14 (n = 2) compared with MSC-TF with MI on day 8 (n = 2) and day 14 (n = 3). Data are plotted as means ± standard errors of the mean. (g) Bioluminescence images show activity in rats at days 1, 4, and 7 after 5 × 10⁶ MSC-TF for CCT after MI.
Figure 4g:
Optical imaging of transplanted MSC in a small-animal model of MI. (a) In vivo bioluminescence image of representative nude mice subcutaneously injected with various amounts of triple-sorted MSC-TF shows mice injected with between 1 × 10³, 5 × 10³, and 5 × 10⁴ MSC-TF, as labeled. The imaging parameters were as follows: medium binning; field of view, 12 cm; f-stop, 1; and time, 20 seconds. (b) Graph shows quantitation of bioluminescence images in a by using the maximum radiance (photons per second per square centimeter per steridian) for each injection and the plotted means ± standard deviations for eight cell numbers (two injections per cell number) (there were 16 injections in eight mice; correlation coefficient = 0.995, P = .0001). (c) Serial in vivo bioluminescence images of nude mice after CCT with MSC-TF show the same three mice from the MSC-TF-no-MI and MSC-TF MI groups on days 2 and 8. The imaging parameters were as follows: medium binning; field of view, 12 cm; f-stop, 1; and time, 1 minute. Optical imaging of transplanted MSC in a small-animal model of MI. (d) Bar graph shows differences in cell growth kinetics between the mock-injection group (n = 3), the group with MSC but no reporter (n = 3), the group with MSC-TF but no MI (n = 5), and the group with MSC-TF and MI (n = 8) for images of nude mice after CCT with MSC-TF. Maximum (Max) radiance (in photons per second per square centimeter per steridian) was calculated for each region of interest, was averaged between mice of the same group, and was plotted as the mean ± standard deviation. Analysis with a mixed regression model showed significantly lower signal on days 8 and 14 than on day 2 (P = .011 and P = .001, respectively). The group with MSC-TF and MI showed significantly higher signal than the group without MI at days 4, 8, and 14 (P = .016). (e) Scatterplot shows correlation of normalized luciferase activity (in relative light units [RLU] per minute per microgram [of total heart protein]) of ex vivo heart lysates versus maximum radiance (in photons per second per square centimeter per steridian) for 13 mice at days 4, 8, and 12. Data were pooled from the MSC-TF-with-no-MI (n = 6) and MSC-TF-with-MI (n = 8) conditions. Luciferase activity versus maximum radiance was correlated (correlation coefficient = 0.832, P = .0004). (f) Bar graph shows normalized luciferase activity (in relative light units [RLU] per minute per microgram [of total heart protein]) of heart lysates after transplantation of MSC-TF, with and without MI, on days 8 and 14. Conditions were MSC-TF with no MI on day 8 (n = 2) and day 14 (n = 2) compared with MSC-TF with MI on day 8 (n = 2) and day 14 (n = 3). Data are plotted as means ± standard errors of the mean. (g) Bioluminescence images show activity in rats at days 1, 4, and 7 after 5 × 10⁶ MSC-TF for CCT after MI.
Discussion
Despite widely successful preclinical animal studies, inconclusive data in clinical trials (8,28) have limited CCT implementation, in part due to the inability to link small-animal and large-animal preclinical data to clinical data. To address this, we designed a two-part study to use multimodality imaging as an enabling tool to analyze MSC for CCT and to achieve a specific small-animal imaging endpoint prior to the large-animal study. In this first study, we introduced the TF reporter gene into MSC and then characterized the MSC-TF, observing no disturbance of normal morphology, growth, and cell surface phenotype. We established stable levels of TF reporter gene through fluorescence cell sorting and quantitative evaluation of FLUC2 and SR39TTK activity. We demonstrated a detection level of at least 1 × 10³ cells using optical (bioluminescence) imaging in small animals with a linear signal (P = .0001). Next, we performed a preclinical molecular imaging study of MSC-TF as CCT for MI. We designated 14 days of survival after MI as a required imaging end point. Studies of CCT after treatment of mouse MI with MSC-TF indicated survival in the MI condition and significant differences in signal compared with MSC with no MI on day 14 (P = .016), and this trend was confirmed with ex vivo luciferase assays. Having achieved the required imaging end point, we proceeded with a follow-up large-animal multimodality molecular imaging CCT study of the same MSC.
We focused on reporter gene imaging of a key biologic event, MSC-TF survival after CCT for acute MI, and our desired preclinical end point was 14 days. Importantly, MSC survival during MI has been linked to improved outcomes. For instance, the dose of MSC can have a strong stimulatory effect on heart function (7), with an accompanying functional benefit (29). The preclinical end point of 14 days was selected on the basis of the wide range of reported MSC survival rates, ranging from 1 week (30) to 14 days (9,31) to 3 months with genetic modification (29). Moreover, at 14 days, the increases observed in heart function stabilize (7), potentially representing a critical junction of cell survival and efficacy. Thus, 14 days represents a middle ground for measuring cell survival and for demonstrating efficacy. Importantly, our in vivo data demonstrated a mean of 32% ± 23 of day 2 maximum signal present on day 14 after MI, and our ex vivo luciferase activity data demonstrated similar trends, which led us to confidently proceed with these same MSC-TF in the follow-up large-animal study.
Although noninvasive in vivo bioluminescence imaging is a powerful approach for estimating cell number in vivo, it is not quantitative, and improving quantitative approaches can improve assessment. A complementary quantitative approach for imaging MSC-TF is micro-PET, a mouse small-animal PET imaging approach, which, in contrast to bioluminescence imaging, has equal sensitivity and spatial resolution at all depths. Although the MSC-TF also express the PET reporter gene, and PET reporter gene imaging can be performed after CCT, we did not perform micro-PET imaging of MSC-TF. Below, we describe why the MSC here would likely not have been detectable with micro-PET. A similar study (22) involving embryonic stem cells and the same hsv1tk PET reporter gene and ubiquitin promoter detected PET signal only 4 days after transplantation of 1 × 10⁷ embryonic stem cells, suggesting that initial reporter gene activity was below the detection limit. In our case, we injected 5 × 10⁵ MSC-TF, 20-fold fewer cells than in Cao et al (22), and MSC are known to rapidly lose survival after CCT, while embryonic stem cells are highly proliferative. Assuming 4 days of embryonic stem cell proliferation, it is likely that MSC-TF cell number in our study was approximately 50–100-fold lower than that of the embryonic stem cells at the time of initial embryonic stem cell detection, well below the minimum detectable level with micro-PET, with further loss of cells over time. In this regard, the best technique for directly accounting for the entire cell mass with PET reporter gene imaging is ex vivo whole-body autoradiography, which is an end-point technique (23). Given the wide range of potential mechanisms of MSC-mediated repair after CCT (29–32), future work for improving PET reporter gene sensitivity is needed.
The analysis of in vivo cell fate in this study had further limitations worth mentioning. For example, we observed a large variation in cell signal after initial CCT, which was likely due to the combined effects of the variation in the induction of MI, cell counting, and cell injection, which can be improved. Furthermore, in terms of improving reporter technology, the in vivo imaging signal depends, in part, on the promoter activity, the levels of reporter gene activity per cell, the number of cells expressing the reporter gene reporter, the probe transport to the reporter gene, the chemical biology and physics by which the reporter gene generates imaging signal, and the physics of the imaging device. Strategies to improve optical imaging signal include red shifting of light emitted from the reporter gene (33), a signal amplification strategy (34), bioluminescence resonance energy transfer cell imaging for deep tissue imaging (35), and blood-based monitoring of stem cells (36). Alternate modalities for improved small-animal preclinical imaging include photoacoustic tomography (37), the integration with nanoparticles and existing imaging techniques (38), and pushing the boundaries of existing techniques like magnetic resonance imaging (39). Finally, the use of human MSC and immunodeficient mice will also improve the clinical translation of these studies.
A key point here is that integrating multimodality molecular imaging with CCT not only can enable the analysis of cell fate in small animals but can also help discriminate between various CCT types by employing a specific imaging endpoint. If this specific end point is achieved, then large-animal studies can be performed by using clinical imaging modalities. We expect that this approach can be used to identify new MSC therapies and other CCT candidate cell types that function favorably after MI. Small-animal models are ideal for testing molecular pathways, effects of specific genetic modification, and host factors (ie, aging) on CCT. Targeting more biologic events critical for stem cell functions, including self-renewal, differentiation, stem cell niche, and MSC-tissue interaction, can be accomplished with future reporter strategies. We strongly believe that multimodality imaging directly enables both measurement of complex stem cell events in small animals and the use of specific imaging end points as criteria for discriminating which CCTs should be used large-animal studies.
Practical application: The practical application of this work is the preclinical evaluation, in small animals, of MSC into which a special reporter gene has been inserted. This reporter gene is special because it allows expression of three reporter proteins as a single protein and because it allows biologic events in cells to be assessed by using multiple imaging modalities, like fluorescence, bioluminescence, and PET imaging. This allows the benefits of all three imaging modalities to be combined synergistically. As a result, this approach allows the integration of preclinical data in mice and rats with large-animal data in swine, thereby informing the design of clinical trials.
Advances in Knowledge
■ Marrow stromal cells (MSC) can be successfully engineered with a multimodality triple fusion (TF) reporter gene for preclinical evaluation of in vivo cell fate.
■ The extent of in vivo cell fate of MSC-TF, directly associated with improved therapeutic effect, can be assessed with noninvasive optical molecular imaging after cardiac cell therapy (CCT) for myocardial infarction (MI).
■ After CCT for MI, noninvasive optical molecular imaging combined with an ex vivo luciferase assay demonstrated that MSC can survive at least 14 days, satisfying the specific imaging end point needed for initiating a follow-up, multimodality MSC imaging study in large animals.
Implication for Patient Care
■ Incorporating the TF reporter gene into candidate MSC for CCT enables direct, quantitative comparison of the in vivo cell fate of CCT candidates in small animals prior to the launch of large-animal studies with the same MSC; this approach would streamline preclinical studies and eventually inform the design of clinical CCT trials, thereby accelerating implementation of CCT.
APPENDIX
Acknowledgments
Acknowledgments
The authors acknowledge Xi Wang, BS, for his help with mouse and rat surgery. The authors thank Jarrett Rosenberg, PhD, for excellent assistance with statistical analysis and Andrei Iaguru, MD, PhD, and Ian Y. Chen, MD, PhD, for their excellent experimental advice and assistance.
Received Jan 27, 2014; revision requested March 18, 2014, and received May 21, 2015; accepted Jan 5, 2016; final version accepted Feb 17.
S.S.G. supported in part by National Cancer Institute in Vivo Cellular and Molecular Imaging Center grant P50CA114747 and the Canary Foundation. N.P. was supported by a Stanford University Dean’s Fellowship, Stanford University National Institute of Biomedical Imaging and Bioengineering T32 training grant EB009035, and a California Institute of Regenerative Medicine fellowship. K.Z. was supported by a Pfizer fellowship of the Life Science Research Foundation.
Current addresses: Department of Chemical and Biological Engineering, University at Buffalo, State University of New York, Buffalo, NY.
Current addresses: Nanotechnology Research Center, Faculty of Pharmacy, Tehran University of Medical Sciences, Tehran, Iran.
Disclosures of Conflicts of Interest: N.P. Activities related to the present article: institution was funded in part by a grant from General Electric for 1 year. Activities not related to the present article: disclosed no relevant relationships. Other relationships: disclosed no relevant relationships. B.C.A. disclosed no relevant relationships. K.Z. disclosed no relevant relationships. K.I. disclosed no relevant relationships. R.P. disclosed no relevant relationships. J.K.W. disclosed no relevant relationships. J.C. disclosed no relevant relationships. F.I. disclosed no relevant relationships. J.C.S. disclosed no relevant relationships. D.R.M. disclosed no relevant relationships. J.K.L. disclosed no relevant relationships. D.Y. disclosed no relevant relationships. T.T. disclosed no relevant relationships. H.K. disclosed no relevant relationships. C.N.D. disclosed no relevant relationships. P.R. disclosed no relevant relationships. M.P. disclosed no relevant relationships. Y.C. disclosed no relevant relationships. M.M. disclosed no relevant relationships. J.E.C. disclosed no relevant relationships. A.B.G. disclosed no relevant relationships. F.H. disclosed no relevant relationships. S.B. Activities related to the present article: institution was funded in part by a grant from General Electric for 1 year. Activities not related to the present article: disclosed no relevant relationships. Other relationships: disclosed no relevant relationships. S.Y. Activities related to the present article: disclosed no relevant relationships. Activities not related to the present article: received a salary from and holds stock or stock options in CellSight Technologies. Other relationships: disclosed no relevant relationships. R.C.R. disclosed no relevant relationships. R.D. disclosed no relevant relationships. P.C.Y. disclosed no relevant relationships. T.J.B. disclosed no relevant relationships. P.G.Y. disclosed no relevant relationships. M.V.M. Activities related to the present article: disclosed no relevant relationships. Activities not related to the present article: received a grant from GE Healthcare for MR research support. Other relationships: disclosed no relevant relationships. S.S.G. Activities related to the present article: disclosed no relevant relationships. Activities not related to the present article: has received personal fees from Bracco Diagnostics; owns stock in CellSight Technologies, Endra, ImaginAb, MagArray, PureTech, RioImaging, and VisualSonics/Sonosite. Other relationships: disclosed no relevant relationships.
Abbreviations:
- CCT
- cardiac cell therapy
- EGFP
- enhanced green fluorescent protein
- MI
- myocardial infarction
- MSC
- marrow stromal cells
- TF
- triple fusion
References
- 1.WRITING GROUP MEMBERS , Lloyd-Jones D, Adams RJ, et al. Heart disease and stroke statistics—2010 update: a report from the American Heart Association. Circulation 2010;121(7):e46–e215. [DOI] [PubMed] [Google Scholar]
- 2.Gerbin KA, Murry CE. The winding road to regenerating the human heart. Cardiovasc Pathol 2015;24(3):133–140. [DOI] [PMC free article] [PubMed] [Google Scholar]
- 3.Orlic D, Kajstura J, Chimenti S, et al. Bone marrow cells regenerate infarcted myocardium. Nature 2001;410(6829):701–705. [DOI] [PubMed] [Google Scholar]
- 4.Oldroyd KG, Berry C, Bartunek J. Myocardial repair and regeneration: bone marrow or cardiac stem cells? Mol Ther 2012;20(6):1102–1105. [DOI] [PMC free article] [PubMed] [Google Scholar]
- 5.Mazo M, Araña M, Pelacho B, Prosper F. Mesenchymal stem cells and cardiovascular disease: a bench to bedside roadmap. Stem Cells Int 2012;2012:175979. [DOI] [PMC free article] [PubMed] [Google Scholar]
- 6.Amado LC, Schuleri KH, Saliaris AP, et al. Multimodality noninvasive imaging demonstrates in vivo cardiac regeneration after mesenchymal stem cell therapy. J Am Coll Cardiol 2006;48(10):2116–2124. [DOI] [PubMed] [Google Scholar]
- 7.Richardson JD, Bertaso AG, Psaltis PJ, et al. Impact of timing and dose of mesenchymal stromal cell therapy in a preclinical model of acute myocardial infarction. J Card Fail 2013;19(5):342–353. [DOI] [PubMed] [Google Scholar]
- 8.Rosen MR, Myerburg RJ, Francis DP, Cole GD, Marbán E. Translating stem cell research to cardiac disease therapies: pitfalls and prospects for improvement. J Am Coll Cardiol 2014;64(9):922–937. [DOI] [PMC free article] [PubMed] [Google Scholar]
- 9.van der Bogt KE, Sheikh AY, Schrepfer S, et al. Comparison of different adult stem cell types for treatment of myocardial ischemia. Circulation 2008;118(14 Suppl):S121–S129. [DOI] [PMC free article] [PubMed] [Google Scholar]
- 10.Wei H, Ooi TH, Tan G, et al. Cell delivery and tracking in post-myocardial infarction cardiac stem cell therapy: an introduction for clinical researchers. Heart Fail Rev 2010;15(1):1–14. [DOI] [PubMed] [Google Scholar]
- 11.Golpanian S, El-Khorazaty J, Mendizabal A, et al. Effect of aging on human mesenchymal stem cell therapy in ischemic cardiomyopathy patients. J Am Coll Cardiol 2015;65(2):125–132. [DOI] [PMC free article] [PubMed] [Google Scholar]
- 12.Jung B, Odening KE, Dall’Armellina E, et al. A quantitative comparison of regional myocardial motion in mice, rabbits and humans using in-vivo phase contrast CMR. J Cardiovasc Magn Reson 2012;14:87. [DOI] [PMC free article] [PubMed] [Google Scholar]
- 13.Ray P, De A, Min JJ, Tsien RY, Gambhir SS. Imaging tri-fusion multimodality reporter gene expression in living subjects. Cancer Res 2004;64(4):1323–1330. [DOI] [PMC free article] [PubMed] [Google Scholar]
- 14.Tsien RY. The green fluorescent protein. Annu Rev Biochem 1998;67:509–544. [DOI] [PubMed] [Google Scholar]
- 15.Zhao Y, Graf BW, Chaney EJ, et al. Integrated multimodal optical microscopy for structural and functional imaging of engineered and natural skin. J Biophotonics 2012;5(5-6):437–448. [DOI] [PMC free article] [PubMed] [Google Scholar]
- 16.Parashurama N, Lobo NA, Ito K, et al. Remodeling of endogenous mammary epithelium by breast cancer stem cells. Stem Cells 2012;30(10):2114–2127. [DOI] [PMC free article] [PubMed] [Google Scholar]
- 17.Kotsuma M, Parashurama N, Smith BR, Wo J, Ito K, Gambhir SS. Nondestructive, serial in vivo imaging of a tissue-flap using a tissue adhesion barrier. Intravital 2012;1(1):69–76. [Google Scholar]
- 18.Chu J, Haynes RD, Corbel SY, et al. Non-invasive intravital imaging of cellular differentiation with a bright red-excitable fluorescent protein. Nat Methods 2014;11(5):572–578. [DOI] [PMC free article] [PubMed] [Google Scholar]
- 19.Contag CH, Spilman SD, Contag PR, et al. Visualizing gene expression in living mammals using a bioluminescent reporter. Photochem Photobiol 1997;66(4):523–531. [DOI] [PubMed] [Google Scholar]
- 20.Wu JC, Sundaresan G, Iyer M, Gambhir SS. Noninvasive optical imaging of firefly luciferase reporter gene expression in skeletal muscles of living mice. Mol Ther 2001;4(4):297–306. [DOI] [PubMed] [Google Scholar]
- 21.Ahn BC, Parashurama N, Patel M, et al. Noninvasive reporter gene imaging of human Oct4 (pluripotency) dynamics during the differentiation of embryonic stem cells in living subjects. Mol Imaging Biol 2014;16(6):865–876. [DOI] [PubMed] [Google Scholar]
- 22.Cao F, Lin S, Xie X, et al. In vivo visualization of embryonic stem cell survival, proliferation, and migration after cardiac delivery. Circulation 2006;113(7):1005–1014. [DOI] [PMC free article] [PubMed] [Google Scholar]
- 23.Gambhir SS, Barrio JR, Phelps ME, et al. Imaging adenoviral-directed reporter gene expression in living animals with positron emission tomography. Proc Natl Acad Sci U S A 1999;96(5):2333–2338. [DOI] [PMC free article] [PubMed] [Google Scholar]
- 24.Bengel FM, Anton M, Richter T, et al. Noninvasive imaging of transgene expression by use of positron emission tomography in a pig model of myocardial gene transfer. Circulation 2003;108(17):2127–2133. [DOI] [PubMed] [Google Scholar]
- 25.Miyagawa M, Anton M, Haubner R, et al. PET of cardiac transgene expression: comparison of 2 approaches based on herpesviral thymidine kinase reporter gene. J Nucl Med 2004;45(11):1917–1923. [PubMed] [Google Scholar]
- 26.Willmann JK, Paulmurugan R, Rodriguez-Porcel M, et al. Imaging gene expression in human mesenchymal stem cells: from small to large animals. Radiology 2009;252(1):117–127. [DOI] [PMC free article] [PubMed] [Google Scholar]
- 27.Yaghoubi SS, Jensen MC, Satyamurthy N, et al. Noninvasive detection of therapeutic cytolytic T cells with 18F-FHBG PET in a patient with glioma. Nat Clin Pract Oncol 2009;6(1):53–58. [DOI] [PMC free article] [PubMed] [Google Scholar]
- 28.Lipinski MJ, Biondi-Zoccai GG, Abbate A, et al. Impact of intracoronary cell therapy on left ventricular function in the setting of acute myocardial infarction: a collaborative systematic review and meta-analysis of controlled clinical trials. J Am Coll Cardiol 2007;50(18):1761–1767. [DOI] [PubMed] [Google Scholar]
- 29.Shujia J, Haider HK, Idris NM, Lu G, Ashraf M. Stable therapeutic effects of mesenchymal stem cell-based multiple gene delivery for cardiac repair. Cardiovasc Res 2008;77(3):525–533. [DOI] [PubMed] [Google Scholar]
- 30.Toma C, Pittenger MF, Cahill KS, Byrne BJ, Kessler PD. Human mesenchymal stem cells differentiate to a cardiomyocyte phenotype in the adult murine heart. Circulation 2002;105(1):93–98. [DOI] [PubMed] [Google Scholar]
- 31.Westrich J, Yaeger P, He C, et al. Factors affecting residence time of mesenchymal stromal cells (MSC) injected into the myocardium. Cell Transplant 2010;19(8):937–948. [DOI] [PubMed] [Google Scholar]
- 32.Ip JE, Wu Y, Huang J, Zhang L, Pratt RE, Dzau VJ. Mesenchymal stem cells use integrin beta1 not CXC chemokine receptor 4 for myocardial migration and engraftment. Mol Biol Cell 2007;18(8):2873–2882. [DOI] [PMC free article] [PubMed] [Google Scholar]
- 33.Loening AM, Dragulescu-Andrasi A, Gambhir SS. A red-shifted Renilla luciferase for transient reporter-gene expression. Nat Methods 2010;7(1):5–6. [DOI] [PMC free article] [PubMed] [Google Scholar]
- 34.Iyer M, Salazar FB, Lewis X, et al. Non-invasive imaging of a transgenic mouse model using a prostate-specific two-step transcriptional amplification strategy. Transgenic Res 2005;14(1):47–55. [DOI] [PubMed] [Google Scholar]
- 35.Dragulescu-Andrasi A, Chan CT, De A, Massoud TF, Gambhir SS. Bioluminescence resonance energy transfer (BRET) imaging of protein-protein interactions within deep tissues of living subjects. Proc Natl Acad Sci U S A 2011;108(29):12060–12065. [DOI] [PMC free article] [PubMed] [Google Scholar]
- 36.Yamashita H, Nguyen DT, Chung E. Blood-based assay with secreted Gaussia luciferase to monitor tumor metastasis. Methods Mol Biol 2014;1098:145–151. [DOI] [PubMed] [Google Scholar]
- 37.Filonov GS, Krumholz A, Xia J, Yao J, Wang LV, Verkhusha VV. Deep-tissue photoacoustic tomography of a genetically encoded near-infrared fluorescent probe. Angew Chem Int Ed Engl 2012;51(6):1448–1451. [DOI] [PMC free article] [PubMed] [Google Scholar]
- 38.Foroutan F, Jokerst JV, Gambhir SS, Vermesh O, Kim HW, Knowles JC. Sol-gel synthesis and electrospraying of biodegradable (P2O5)55-(CaO)30-(Na2O)15 glass nanospheres as a transient contrast agent for ultrasound stem cell imaging. ACS Nano 2015;9(2):1868–1877. [DOI] [PMC free article] [PubMed] [Google Scholar]
- 39.Ribot EJ, Gaudet JM, Chen Y, Gilbert KM, Foster PJ. In vivo MR detection of fluorine-labeled human MSC using the bSSFP sequence. Int J Nanomedicine 2014;9:1731–1739. [DOI] [PMC free article] [PubMed] [Google Scholar]
Associated Data
This section collects any data citations, data availability statements, or supplementary materials included in this article.


