Figure 2:
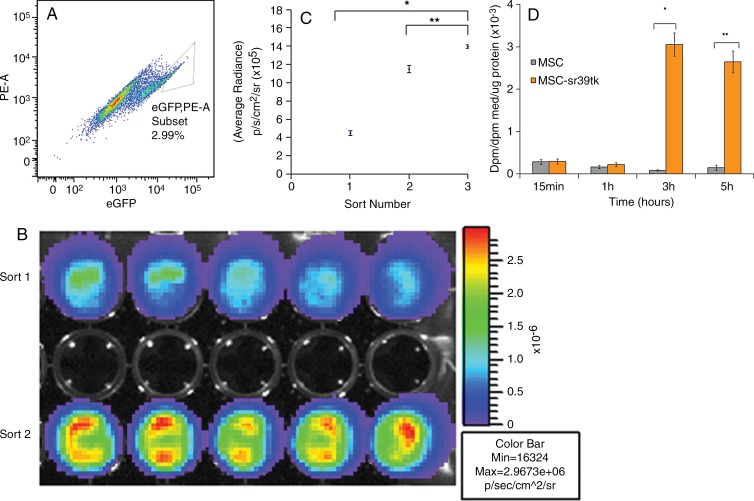
In vitro characterization of engineered MSC-TF. A, Dot plot shows phycoerythrin (PE) versus EGFP from fluorescence-activated cell sorting of the second serial sort of MSC-TF. A gate was drawn around EGFPhigh MSC-TF, which were sorted and represented 2.99% of the population. B, In vitro bioluminescence image of FLUC2 signal obtained by using a cooled charge-coupled device, or CCD, camera shows equal amounts of two unique EGFPhigh MSC-TF sorted populations. Top row: EGFPhigh MSC-TF from the first sort. Bottom row: EGFPhigh cells from the second sort. Signal is measured in photons per second per square centimeter per steridian. C, Plot of bioluminescence signal versus number of serially sorted MSC-TF. MSC-TF were sorted for the EGFPhigh (and hence high-FLUC2) population after three serial sorts. Ten thousand cells from the first, second, and third sorts were plated per well in a 48-well plate. The average radiance (in photons per second per square centimeter per steridian) was calculated for five samples and was compared between each condition. The means ± standard deviations of the average radiance were plotted. Statistically significant differences are depicted with an asterisk (* = sort 1 and sort 3, P = .0001) or (** = sort 2 and 3, P = .0001). D, Bar graph shows ability to accumulate 8–3H-penciclovir, a substrate for sr39ttk, versus time in cell culture. MSC-TF (serially sorted three times) were cultured in 12-well plates and were exposed to 8–3H-penciclovir (0.82 µCi/mL) for 15 minutes to 5 hours. Data were expressed in disintegrations per minute (dpm), as (dpm cells/dpm medium [med]/microgram protein), or as fractional uptake of 8–3H-penciclovir for three samples.

