Noninvasive molecular imaging of in vivo marrow stromal cell (MSC) fate in large animals for cardiac cell therapy with translational components and instrumentation, and with quantitative preclinical noninvasive molecular imaging end points of the same MSC in small animals, enables direct comparison between animal models, removing barriers toward clinical translation.
Abstract
Purpose
To quantitatively determine the limit of detection of marrow stromal cells (MSC) after cardiac cell therapy (CCT) in swine by using clinical positron emission tomography (PET) reporter gene imaging and magnetic resonance (MR) imaging with cell prelabeling.
Materials and Methods
Animal studies were approved by the institutional administrative panel on laboratory animal care. Seven swine received 23 intracardiac cell injections that contained control MSC and cell mixtures of MSC expressing a multimodality triple fusion (TF) reporter gene (MSC-TF) and bearing superparamagnetic iron oxide nanoparticles (NP) (MSC-TF-NP) or NP alone. Clinical MR imaging and PET reporter gene molecular imaging were performed after intravenous injection of the radiotracer fluorine 18–radiolabeled 9-[4-fluoro-3-(hydroxyl methyl) butyl] guanine (18F-FHBG). Linear regression analysis of both MR imaging and PET data and nonlinear regression analysis of PET data were performed, accounting for multiple injections per animal.
Results
MR imaging showed a positive correlation between MSC-TF-NP cell number and dephasing (dark) signal (R2 = 0.72, P = .0001) and a lower detection limit of at least approximately 1.5 × 10⁷ cells. PET reporter gene imaging demonstrated a significant positive correlation between MSC-TF and target-to-background ratio with the linear model (R2 = 0.88, P = .0001, root mean square error = 0.523) and the nonlinear model (R2 = 0.99, P = .0001, root mean square error = 0.273) and a lower detection limit of 2.5 × 10⁸ cells.
Conclusion
The authors quantitatively determined the limit of detection of MSC after CCT in swine by using clinical PET reporter gene imaging and clinical MR imaging with cell prelabeling.
© RSNA, 2016
Introduction
There has been considerable interest in cardiac cell therapy (CCT) (1). Marrow stromal cells (MSC) are a safe candidate for CCT, with mixed clinical efficacy (2). Large-animal preclinical swine models of CCT, which best model the human heart (3), are greatly needed. In vivo MSC survival after swine CCT ranges from 10 days (4) to 4 months (5). This marked variation can be explained by complex in vivo MSC fate, including cell-related factors such as differentiation (5), host-related factors such as disease state, and cellular delivery–related factors (6). Currently, these complex factors play unknown roles in large-animal studies as compared with small-animal studies. Thus, new techniques for assessing the fate of MSC in vivo are needed.
Molecular imaging is the noninvasive, spatiotemporal visualization of biochemical events in living subjects (7). A simple in vivo MSC imaging approach is cell prelabeling, which consists of intracellular loading of superparamagnetic iron oxide (SPIO) nanoparticles (NP) followed by transplantation and magnetic resonance (MR) imaging (8). A complementary approach, positron emission tomography (PET) reporter gene imaging, involves expressing the reporter gene followed by transplantation, reporter probe injection, and PET. A well-characterized PET reporter gene is the herpes simplex virus 1 thymidine kinase (hsv1-tk) or its mutant, sr39tk. PET signal arises when the exogenous HSV1-TK or sr39TK selectively phosphorylates the PET reporter probe fluorine 18–radiolabeled 9-[4-fluoro-3-(hydroxyl methyl) butyl] guanine) (18F-FHBG), causing intracellular probe accumulation (9). Currently, swine CCT studies demonstrate a lower detection limit of approximately 1–5 × 10⁶ MSC (10) for MR imaging–based cell prelabeling and approximately 5–9 × 10⁶ MSC (4) to 1–3 × 10⁸ MSC (11,12) for PET. However, quantitative studies in swine are scarce, and combining MR imaging (prelabeling, high spatial resolution) and PET (reporter genes, high sensitivity) remains unexplored.
Cell prelabeling with MR imaging and PET reporter gene imaging are techniques that have a clear combined benefit in large animals. However, it remains unclear how in vivo MSC fate can be quantitatively compared between large- and small-animal studies. To address this, in the first part of this two-part study (13) we engineered MSC with a single triple fusion (TF) reporter gene containing an enhanced green fluorescent protein, firefly luciferase 2, and the sr39ttk PET reporter gene. The premise was that CCT can be tested in small animals, with an expected quantitative preclinical endpoint for entry into the large-animal study. In this case, in vivo bioluminescence imaging of MSC expressing TF reporter gene (MSC-TF) demonstrated 14 days of survival after murine myocardial infarction (13), achieving the endpoint needed to proceed with this large-animal study with the same MSC.
This study was performed to quantitatively determine the limit of detection of MSC after CCT in swine by using clinical PET/computed tomography (CT) reporter gene imaging and clinical MR imaging with prelabeled cells.
Materials and Methods
Industry Support
We obtained financial support from the GE Global Research Center (Niskayuna, NY). S.B. worked for the GE Global Research Center during the study. All other authors, who are not employees of the GE Global Research Center, had control of inclusion of any data.
Study Workflow
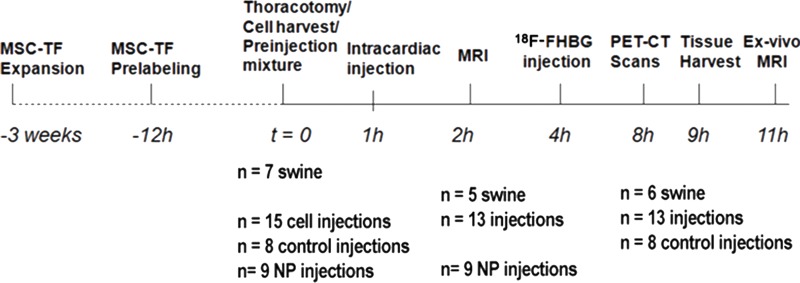
We used enhanced green fluorescent protein high-expressing MSC-TF cells (13). MSC-TF were expanded to large scale, cryopreserved, and then regrown to 2–20 × 108 cells. A fraction (15%–30%) of MSC-TF was labeled with SPIO NP overnight (14) (Fig 1a) to generate MSC-TF-NP. MSC-TF and MSC-TF-NP were mixed together with 50% Matrigel (#356234; BD Biosciences, San Jose, Calif) (Fig 1a) and injected at one or more locations in the left ventricle (Fig 1b). Control injections (n = 8) were performed with MSC without TF (n = 4) and with Matrigel (mock injection) (n = 4). Seven swine were injected with 23 intracardiac cell injections consisting of eight control cell injections and 15 mixtures of MSC-TF-NP and MSC-TF; all animals initially underwent MR imaging. Two swine were used to adjust prelabeling, workflow, and MR imaging sequences; thus, five swine with 13 cell injections and nine NP intracardiac injections were analyzed after clinical MR imaging. One of the seven swine died after MR imaging but before PET. Clinical MR imaging was followed by 18F-FHBG injection and PET/CT imaging for approximately 5 hours, tissue harvesting, and ex vivo MR imaging (Fig 1b). Thus, six swine with 13 cell injections and eight control injections underwent PET/CT. Details of injections and analysis are shown in Figure 1, and details of each injection in each animal, together with imaging modality used, are detailed in Table E1 (online).
Figure 1a:
General study design and workflow. Schematics for (a) preparation of intracardiac swine injection and (b) study design. MSC expressing TF reporter gene (MSC-TF) were expanded for approximately 2–3 weeks before swine study. MSC mixture containing MSC-TF and MSC-TF bearing SPIO NP was harvested and counted during a 2–4-hour period, and preinjection cell mixture containing approximately 80% MSC-TF, approximately 20% MSC-TF NP, was prepared. MSC cell mixture was loaded into 5-mL syringes with 50% Matrigel, at 200 × 106 cells/mL, and stored on ice. Next, cells were injected intramyocardially, 1 hour after thoracotomy, in the beating swine heart. Clinical MR imaging was performed in five swine. Next, the animal was transferred to clinical PET/CT scanner and injected with 18F-FHBG. Four hours later, a series of four 15-minute static PET scans was obtained in six swine. Finally, the heart was harvested after scanning, and ex vivo MR imaging was performed at the end of the study, 2 hours after harvest of heart.
Figure 1b:
General study design and workflow. Schematics for (a) preparation of intracardiac swine injection and (b) study design. MSC expressing TF reporter gene (MSC-TF) were expanded for approximately 2–3 weeks before swine study. MSC mixture containing MSC-TF and MSC-TF bearing SPIO NP was harvested and counted during a 2–4-hour period, and preinjection cell mixture containing approximately 80% MSC-TF, approximately 20% MSC-TF NP, was prepared. MSC cell mixture was loaded into 5-mL syringes with 50% Matrigel, at 200 × 106 cells/mL, and stored on ice. Next, cells were injected intramyocardially, 1 hour after thoracotomy, in the beating swine heart. Clinical MR imaging was performed in five swine. Next, the animal was transferred to clinical PET/CT scanner and injected with 18F-FHBG. Four hours later, a series of four 15-minute static PET scans was obtained in six swine. Finally, the heart was harvested after scanning, and ex vivo MR imaging was performed at the end of the study, 2 hours after harvest of heart.
Cell Culture of MSC and MSC-TF
MSC were cultured and passaged as done previously (13). Further details are given in Appendix E1 (online).
Large-Scale Expansion of MSC-TF
MSC-TF were grown in both T225 tissue culture–treated flasks (Corning, Corning, NY) and in Nunc cell factories (Nunclon Surface 4-Tray, version 140004, Thermofisher, Rochester, NY; total area, 2528 cm2) following manufacturer’s directions. Each Nunc factory yielded approximately 2.50 × 10⁸ cells during a 7–10-day period, with 96% viability.
In Vitro Labeling of MSC-TF with SPIO NP
SPIO NP (version SMG25, Ocean NanoTech, Springdale, Ark; stock concentration, 5 mg/mL) were 35 nm in diameter. MSC-TF were labeled with SPIO NP overnight for 12 hours, as done previously (14). Further details are given in Appendix E1 (online).
MR Imaging of MSC-TF Labeled with SPIO NP in Cell Culture
We determined the labeling efficiency of MSC with NP. To do this, in vitro cellular MR imaging was performed with whole-body 3.0-T MR imaging (Signa Excite HD 3T; GE Healthcare, Milwaukee, Wis) by using a 5-inch receive-only surface coil. The cell suspension was prepared in 96-well plates (E & K Scientific, Santa Clara, Calif), and MR imaging was performed with a gradient-echo (GRE) sequence (100/10 [repetition time msec/echo time msec]; 30° flip angle; 12 × 12-cm field of view; 1-mm-thick sections; and 256 × 256 matrix).
Swine Thoracotomy with Injection of NP and Mixtures of MSC-TF and MSC-TF-NP in the Heart
All animal procedures were approved by the Institutional Administrative Panel on Laboratory Animal Care at Stanford University. Seven female Yorkshire swine (mean weight, 40 kg; range, 33–42 kg; Pork Power Farms, Turlock, Calif) underwent surgery and intracardiac injections, including MSC without TF (n = 4), mock injection (Matrigel) (n = 4), NP alone (n = 9), and cell mixtures of MSC-TF and MSC-TF-NP (n = 13). Further details are given in Appendix E1 (online).
MR Imaging of Swine Injected with MSC-TF
MR imaging was performed to localize and validate cell injections and determine the limit of detection of cell number. Anesthetized swine (n = 7) were placed supine in a whole-body 3.0-T MR unit (Signa Excite HD) with an eight-channel chest coil (GE Healthcare) and imaged. Cardiac and respiratory gating and/or breath holding was used. Two swine were used to optimize cell prelabeling, workflow, sequences, localization, and breath holding and thus were not analyzed. Imaging sequences were as follows: (a) fast imaging employing steady-state acquisition for cine imaging of the left ventricle in short-axis, three-chamber, and long-axis views (3.8/1.6, 45° flip angle, 10-mm-thick sections, no section gap, 12 × 12-cm field of view, and 256 × 256 matrix) and (b) fast GRE sequence for T2*-weighted imaging (variety of repetition times and echo times, 45° flip angle, 4-mm-thick sections, 12 × 12-cm field of view, and 256 × 256 matrix).
Analysis of MR Images
Cardiac injections of MSC-TF-NP and NP alone were analyzed (Inveon Research Workplace, version 3.0; Siemens Medical Solutions USA, Knoxville, Tenn). Analysis of five swine for all NP (n = 9) and all MSC-TF-NP (n = 13) injections was performed by N.P. (with 5 years of experience), who was blinded to injection type. Signal loss in regions of interest (ROIs) were identified and analyzed across the cardiac cycle. On the basis of a previous study (15), areas of lost signal, or dark voxels, were thresholded by using 2 standard deviations below the mean signal intensity of the background, which was 90% of the noninjected myocardial section volume. We calculated the signal-to-noise ratio, contrast-to-noise ratio (CNR), and thresholded volume for both the NP only and MSC-TF-NP injections. Further details are given in Appendix E1 (online).
PET/CT in Swine
After MR imaging, six animals underwent PET/CT with a clinical scanner (Discovery LightSpeed Plus, GE Healthcare) as previously described (16). Briefly, after an initial scout view (30 mAs, 120 kV), an unenhanced four-detector CT scan of the heart was obtained. Four hours after intramyocardial human MSC injection and 2 hours after MR imaging, animals were injected with 148–592 MBq of the radiotracer 18F-FHBG. Five hours after injection of the radiotracer, four 15-minute static PET scans were obtained; the last 15-minute scan was analyzed. Transverse section reconstructions of the CT data sets were performed as previously described (16). All PET images were reconstructed by using an iterative algorithm (ordered-subset expectation maximization, two iterative steps, 28 subsets) with CT-based attenuation. Cardiac gating was not performed.
Harvest of Swine Tissue and Histologic Examination
After in vivo PET/CT reporter gene imaging of MSC-TF, the swine were sacrificed by means of intravenous administration of saturated potassium chloride. Further details are given in Appendix E1 (online).
Validation of Cardiac Injections of MSC-TF and NP in a Single Swine
To determine that in vivo injections visualized with MR imaging were not artifacts, we performed multiview injections with in vivo MR imaging and ex vivo MR imaging on harvested hearts. For injections in a single swine, we injected NP alone (0.165 mg or 0.330 mg/mL) anteriorly and superiorly, near the interventricular septum between the left and right ventricles, and NP alone (0.021 mg or 0.042 mg/mL) at the apex of the left ventricle. We injected approximately 1.56 × 10⁸ MSC-TF-NP (total injection, 5.0 × 10⁸ MSC-TF, with approximately 31% NP-labeled cells) in the midlateral wall of the left ventricle. We injected 1.11 × 10⁸ MSC-TF-NP (total injection, 5.0 × 10⁸ MSC-TF, with approximately 22% NP-labeled cells) in the inferior lateral wall of the left ventricle. Ex vivo MR imaging was performed as described below.
Ex Vivo MR Imaging of Harvested Swine Heart
To validate cell injections identified with in vivo MR imaging, we performed ex vivo MR imaging after MR imaging and PET/CT. Harvested swine hearts were placed within cylindrical containers in fresh phosphate-buffered saline and imaged the same day with ex vivo 3.0-T MR imaging (GE Signa Excite HD) by using an eight-channel chest coil (GE Healthcare). Multiple injections (MSC-TF-NP, NP alone, n = 3) were identified.
Analysis of PET/CT
We quantitatively determined the limit of detection between number of cells and PET signal for eight control injections and 13 injections of MSC-TF and MSC-TF-NP in six swine. All imaging data were analyzed offline (AMIDE, version 0.8.22, http://amide.sourceforge.net). Image analysis was performed in random order by one reader (N.P., with 5 years of experience in analysis of PET/CT scans), who was blinded to experimental groups. The last of the four static, 15-minute PET scans was analyzed. The ROIs were validated with MR imaging and were three-dimensional across multiple transverse sections (0.55-mm reconstructed section thickness). The three-dimensional ellipsoid ROIs had a mean volume (±standard deviation) of 491 mm3 ± 260. The posterior left ventricle myocardium was the background. ROI statistics on all voxels were calculated by using AMIDE software. The standard uptake value (SUV) was calculated with the AMIDE software by using the ROI voxel data, the time of injection, the dose of injection, and a scaling factor. After decay correction, the target-to-background ratio of decay-corrected SUV (signal-to-background ratio) was calculated.
Statistical Analysis
Data are shown as means ± standard deviations. α = .05 was considered indicative of a statistically significant difference, assuming a two-tailed distribution of equal variance. Sample size comparisons are stated in the Results section. Linear regression analysis was performed for the effects of the number of MSC-TF-NP cells on the CNR. The effects of iron concentrationand iron mass (data not shown) on MR imaging CNR were assessed with linear regression analysis on log-transformed predictors, adjusted for multiple injections within each animal. The effects of MSC-TF-NP cell number on thresholded MR volume were assessed with linear regression, adjusted for multiple injections within each animal . The effect of MSC cell number on normalized SUV uptake was assessed with both a linear regression and two-parameter nonlinear regression, with both adjusted for multiple injections within each animal. Listed are correlation coefficients and P values or the root mean square error, R2, and P value. These calculations were performed with software (Stata Release 14; StataCorp, College Station, Tex). We planned the study to have approximately three to four injections per animals and to test approximately five conditions of cell numbers, ranging from approximately 1.5 × 10⁸ to approximately 5 × 10⁸. Statistics (mean SUV, maximum SUV, standard deviation, and standard error) for each ROI were calculated with AMIDE software (Tables E2–E4 [online]).
Results
In Vitro Imaging of MSC-TF-NP
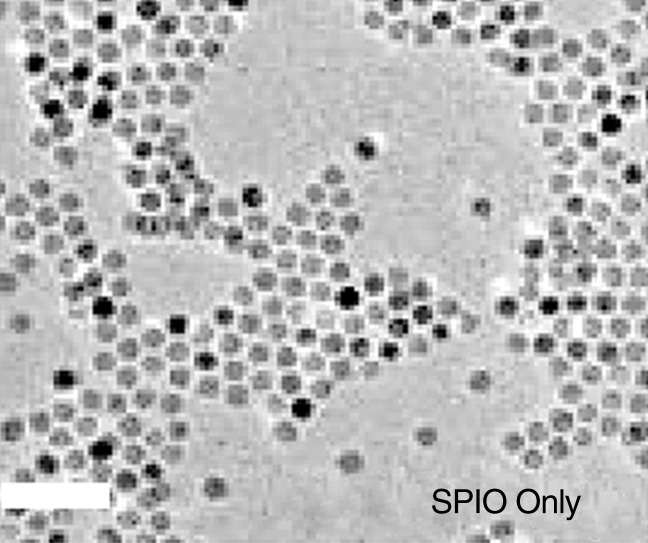
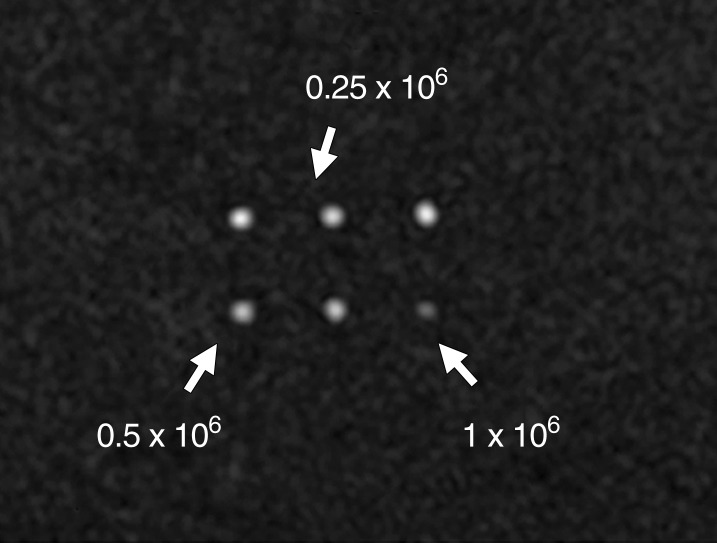
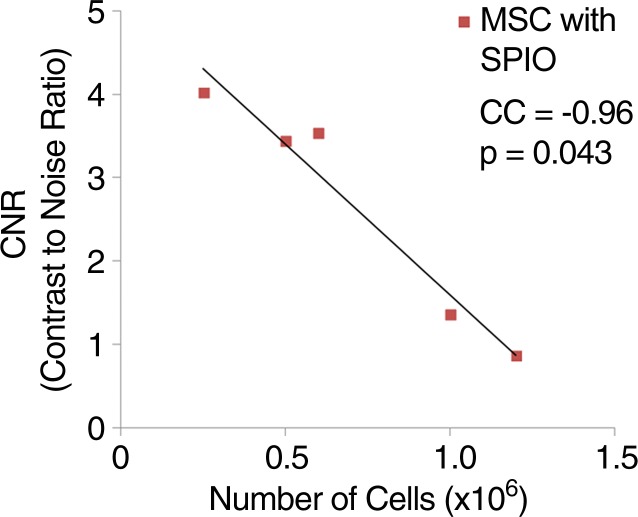
The size of SPIO NP was 35 nm, as confirmed by means of transmission electron microscopy (Fig 2a). MSC-TF-NP were then labeled with SPIO NP in vitro, and various cell numbers were imaged with MR imaging (Fig 2b). MR imaging analysis demonstrated a negative linear correlation between CNR and number of MSC-TF-NP cells (Fig 2c, R2 = 0.92, P = .0043).
Figure 2a:
In vitro SPIO labeling of MSC-TF. (a) Image from transmission electron microscopy of SPIO NP. NP are 35 nm in diameter. Bar = 100 nm. (Image courtesy of Y. Andrew Yang, PhD, Ocean Nanotech, Springdale, Ark). (b) MR image of MSC-TF loaded with SPIO NP (30 µg/mL). MSC-TF were transferred into 96-well tubes at varying cell numbers. MR imaging was performed with GRE sequence (100/12, 30° flip angle, 12 × 12-cm field of view, 1-mm-thick sections, and 256 × 256 matrix). (c) Plot (from b) of CNR versus number of cells after in vitro MR imaging shows significant correlation ( R2 = 0.92, P = .0043). CNR was calculated as follows: signal-to-background ratio/noise. CC = correlation coefficient.
Figure 2b:
In vitro SPIO labeling of MSC-TF. (a) Image from transmission electron microscopy of SPIO NP. NP are 35 nm in diameter. Bar = 100 nm. (Image courtesy of Y. Andrew Yang, PhD, Ocean Nanotech, Springdale, Ark). (b) MR image of MSC-TF loaded with SPIO NP (30 µg/mL). MSC-TF were transferred into 96-well tubes at varying cell numbers. MR imaging was performed with GRE sequence (100/12, 30° flip angle, 12 × 12-cm field of view, 1-mm-thick sections, and 256 × 256 matrix). (c) Plot (from b) of CNR versus number of cells after in vitro MR imaging shows significant correlation ( R2 = 0.92, P = .0043). CNR was calculated as follows: signal-to-background ratio/noise. CC = correlation coefficient.
Figure 2c:
In vitro SPIO labeling of MSC-TF. (a) Image from transmission electron microscopy of SPIO NP. NP are 35 nm in diameter. Bar = 100 nm. (Image courtesy of Y. Andrew Yang, PhD, Ocean Nanotech, Springdale, Ark). (b) MR image of MSC-TF loaded with SPIO NP (30 µg/mL). MSC-TF were transferred into 96-well tubes at varying cell numbers. MR imaging was performed with GRE sequence (100/12, 30° flip angle, 12 × 12-cm field of view, 1-mm-thick sections, and 256 × 256 matrix). (c) Plot (from b) of CNR versus number of cells after in vitro MR imaging shows significant correlation ( R2 = 0.92, P = .0043). CNR was calculated as follows: signal-to-background ratio/noise. CC = correlation coefficient.
Validation of Cardiac Injections in a Single Swine Heart with in Vivo and ex Vivo MR Imaging
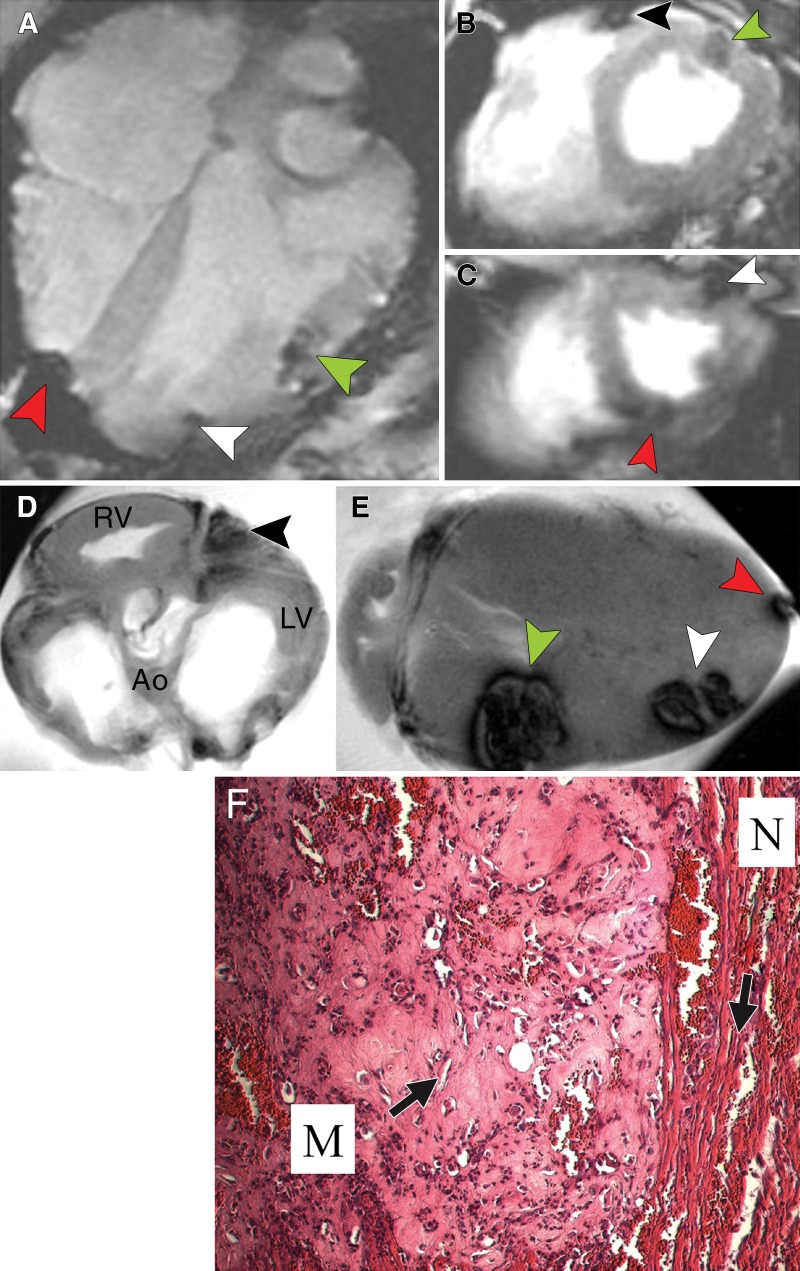
Our preliminary studies suggested that attempting to track multiple intracardiac injections with imaging is challenging because of imaging artifacts. To address this, we focused on validation of all cellular injections with multiview in vivo and ex vivo MR imaging. Herein, we show the results in a single swine (Fig 3), representative of three swine. We show four intracardiac injections (two MSC-TF/MSC-TF-NP mixtures and two NP concentrations) with MR imaging in vivo in long-axis views (Fig 3, A), and short-axis views (Fig 3, B and C). After excision of the same heart, ex vivo MR imaging was performed with short-axis and long-axis views and all injections were validated (Fig 3, D and E). Hematoxylin-eosin staining helped confirm the presence of MSC in the myocardium at the site of injection (Fig 3, F).
Figure 3:
Validation of cardiac injections in one heart with in vivo and ex vivo MR imaging. A, In vivo MR image of swine heart (8.1/4.3). Long-axis view was obtained with breath holding by using a T2*-weighted fast GRE sequence after direct injection of NP alone (total of two injections) and MSC-TF/MSC-TF-NP mixtures (total of two cell injections). Arrowheads indicate dephasing (dark) signal. NP injection 1 is at anterior interventricular border (not shown). Cell injection 1 is seen on lateral portion of left ventricle (green arrowhead). Cell injection 2 is seen at inferior lateral portion of left ventricle (white arrowhead). NP injection 2 is seen near inferior and posterior portion of right ventricle (red arrowhead). B, In vivo MR image of swine heart (4.061/1.82). Short-axis view was obtained with fast imaging employing steady-state acquisition cine sequence. Arrowheads indicate dephasing (dark) signal. NP injection 1 (black arrowhead) is seen in anterior interventricular region, and cell injection 1 (green arrowhead) is seen on anterolateral portion of left ventricle. C, In vivo MR image of swine heart (4.061/1.82) obtained with same parameters as in B except in a more inferior view. Arrowheads indicate dephasing (dark) signal. Cell injection 2 (white arrowhead) is seen at anterolateral portion of left ventricle. NP injection 1 (red arrowhead) is seen on posterior portion of left ventricle. D, Short-axis view of same swine heart, in anatomic position, imaged ex vivo by using T2*-weighted fast GRE sequence (50/10). NP injection 1 (arrowhead) is seen at interventricular region between right and left ventricles. Ao = aorta, LV = left ventricle, RV = right ventricle. E, Ex vivo MR image of swine heart (50/15). Long-axis view of same swine heart was obtained with T2*-weighted fast GRE sequence. Arrowheads indicate dephasing (dark) signal. Cell injection 1 is seen on lateral portion of left ventricle (green arrowhead). Cell injection 2 is seen at inferior lateral portion of left ventricle (white arrowhead). NP injection 2 is seen near inferior and posterior portion of right ventricle (red arrowhead). NP injection 1 is present in a more anterior plane (data not shown). F, Photomicrograph of MSC-TF after swine study (hematoxylin-eosin stain; original magnification, ×4) shows myocardium injected with MSC after thoracotomy, injection, and imaging. M = pink Matrigel with MSC, N = normal myocardium.
Quantitation of MR Imaging Signal Intensity Loss and Determination of Limit of Detection in Swine Heart
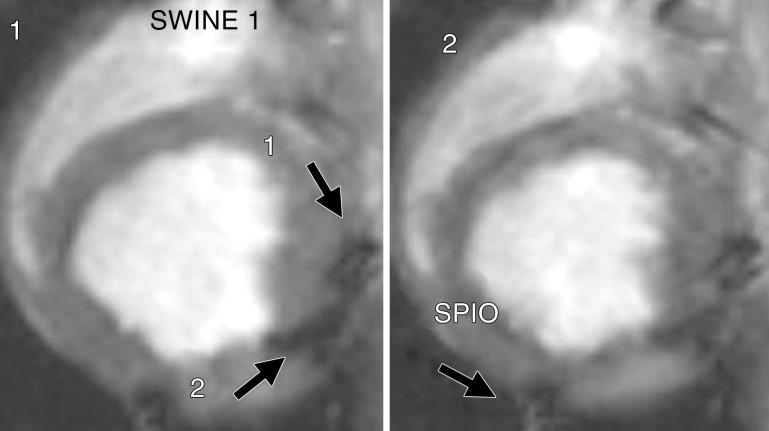
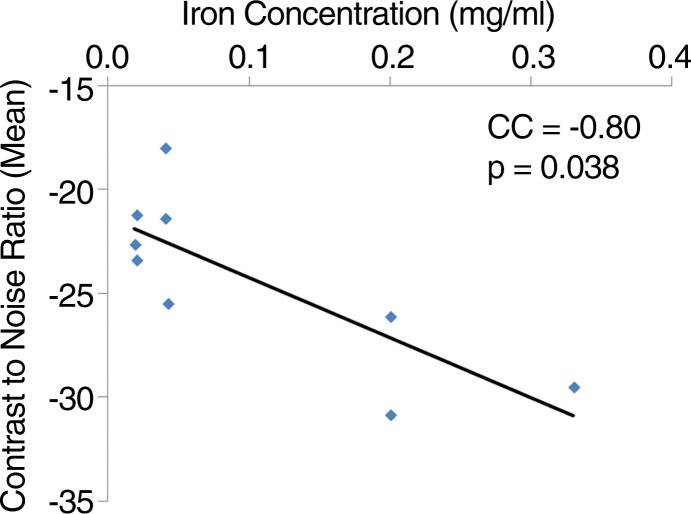
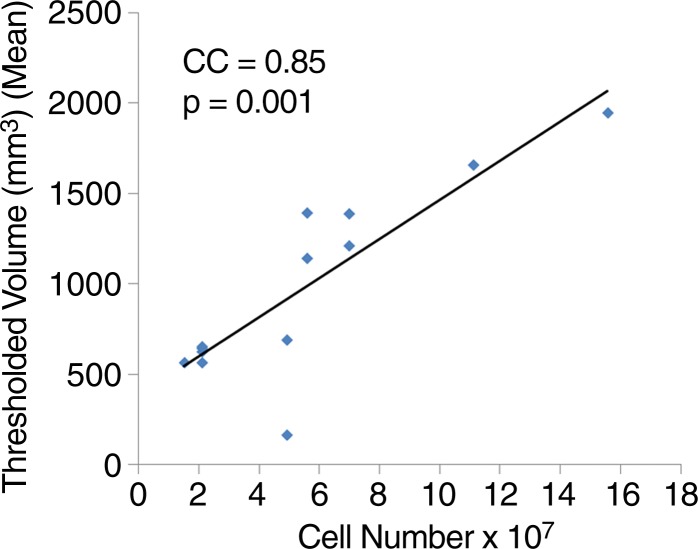
We quantitatively analyzed in vivo MR images to determine sensitivity. Representative images demonstrate two MSC-TF-NP injections (Fig 4a, frame 1) and one SPIO NP injection (Fig 4a, frame 2). For NP injections (n = 9), we observed a significant negative correlation between CNR and NP concentration (Fig 4b, R2 = 0.63, P = .038), whereas the correlation between CNR and NP mass was not significant (data not shown, R2 = 0.47, P = .059). For 13 MSC-TF-NP injections in five swine, we observed a significant positive correlation of dephasing signal volume versus cell number (Fig 4c, R2 = 0.72, P = .0001). Overall, we detected cell numbers as low as approximately 1.5 × 10⁷ MSC-TF-NP cells and iron concentrations as low as approximately 5.5 µg/mL.
Figure 4a:
Quantitation of MR imaging signal loss and sensitivity with injection of NP and MSC-TF-NP. (a) Two frames of cardiac cycle in swine obtained with single-plane short-axis view by using fast imaging employing steady-state acquisition (4.021/1.8). Frame numbers are in top left corner. Arrows depict dephasing (dark) signal from cell injections 1 and 2 in frame 1 and an NP injection in frame 2. (b) Scatterplot of mean CNR versus concentration of iron for each iron injection for nine injections in five swine (R2 = 0.63, P = .038). CC = correlation coefficient. (c) Scatterplot of thresholded volume (in cubic millimeters) versus NP-labeled cell number for each MSC-TF-NP cell injection for 13 injections in five swine (R2 = 0.72, P = .0001). Number of MSC-TF-NP–labeled cells within each mixed MSC-TF and MSC-TF-NP cell injection is plotted. CC = correlation coefficient.
Figure 4b:
Quantitation of MR imaging signal loss and sensitivity with injection of NP and MSC-TF-NP. (a) Two frames of cardiac cycle in swine obtained with single-plane short-axis view by using fast imaging employing steady-state acquisition (4.021/1.8). Frame numbers are in top left corner. Arrows depict dephasing (dark) signal from cell injections 1 and 2 in frame 1 and an NP injection in frame 2. (b) Scatterplot of mean CNR versus concentration of iron for each iron injection for nine injections in five swine (R2 = 0.63, P = .038). CC = correlation coefficient. (c) Scatterplot of thresholded volume (in cubic millimeters) versus NP-labeled cell number for each MSC-TF-NP cell injection for 13 injections in five swine (R2 = 0.72, P = .0001). Number of MSC-TF-NP–labeled cells within each mixed MSC-TF and MSC-TF-NP cell injection is plotted. CC = correlation coefficient.
Figure 4c:
Quantitation of MR imaging signal loss and sensitivity with injection of NP and MSC-TF-NP. (a) Two frames of cardiac cycle in swine obtained with single-plane short-axis view by using fast imaging employing steady-state acquisition (4.021/1.8). Frame numbers are in top left corner. Arrows depict dephasing (dark) signal from cell injections 1 and 2 in frame 1 and an NP injection in frame 2. (b) Scatterplot of mean CNR versus concentration of iron for each iron injection for nine injections in five swine (R2 = 0.63, P = .038). CC = correlation coefficient. (c) Scatterplot of thresholded volume (in cubic millimeters) versus NP-labeled cell number for each MSC-TF-NP cell injection for 13 injections in five swine (R2 = 0.72, P = .0001). Number of MSC-TF-NP–labeled cells within each mixed MSC-TF and MSC-TF-NP cell injection is plotted. CC = correlation coefficient.
PET/CT Analysis of MSC-TF-NP Injections in the Swine Heart with MR Imaging Localization
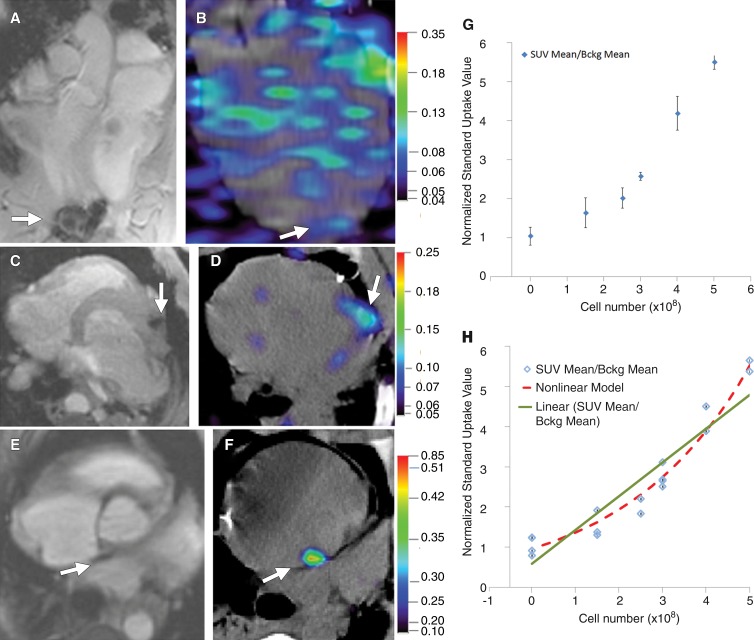
Mock injections of MSC without TF (n = 4) or with Matrigel alone (n = 4) showed a mean normalized SUV of 1.04 ± 0.23. Representative images of injections for both MR imaging and PET/CT are shown in Figure 5, A–F. For the injection of 1.5 × 10⁸ cells (three injections), 2.5 × 10⁸ cells (two injections), 3 × 10⁸ cells (four injections), 4 × 10⁸ cells (two injections), and 5 × 10⁸ cells (two injections), the normalized SUVs were 1.65 ± 0.38, 2.02 ± 0.26, 2.58 ± 0.10, 4.19 ± 0.43, and 5.51 ± 0.19, respectively (Fig 5, G). A linear regression model was applied to normalized SUV versus cell number in Figure 5, G (root mean square error = 0.524, R2 = 0.88, P = .0009). We also developed a nonlinear, two-parameter regression (root mean square error = 0.273, R2 = 0.99, P = .0001) for comparison (Fig 5, G). The raw data are summarized in Tables E2–E4 (online). In summary, signal intensity was proportional to cell number and we could detect approximately 2.5 × 10⁸ cells but not approximately 1.5 × 10⁸ cells with PET/CT.
Figure 5:
PET/CT analysis of MSC-TF-NP injections in swine heart with MR imaging localization. A, Long-axis view of MR image of swine heart obtained with T2*-weighted fast GRE breath-hold sequence after direct cell injection of MSC-TF (1.5 × 10⁸ cells, arrow) before PET/CT (8.516/4.836). B, Long-axis view obtained with PET/CT. Arrow depicts direct injection of 1.5 × 10⁸ MSC-TF. Blue areas throughout heart represent background signal. Color bar represents SUV. C, Axial MR image of swine heart obtained with T2*-weighted fast GRE breath-hold sequence after direct cell injection of MSC-TF (3 × 10⁸ cells, arrow) (8.105/4.5). D, Axial PET/CT scan in same animal as in C . Arrow depicts direct injection of 3 × 10⁸ MSC-TF. Color bar represents SUV. E, Axial MR image of swine heart obtained with fast imaging employing steady-state acquisition after direct cell injection of MSC-TF (5 × 10⁸ cells, arrow) (3.52/1.525). F, Axial PET/CT scan in same animal as in E. Arrow depicts direct injection of 5 × 10⁸ MSC-TF. Color bar represents SUV. G, Normalized SUV versus cell number after analysis of PET/CT image. Normalized SUV is decay-corrected mean SUV of ROI divided by decay-corrected mean SUV of ROI of background (Bckg). The mean (and maximum, not shown) SUV was used. Data are means ± standard deviations for 21 injections in six swine (one animal with two injections was not analyzed with PET/CT, only MR imaging). H, Scatterplot of individual value of normalized SUV versus cell number for all 21 cell injections in six swine together with plots of linear (green line) and nonlinear (red dashed line) regression models. Linear regression model used the following equation: SUV = a × (cell number) + b, where a = 0.079 (95% confidence interval: 0.005, 0.0107; P < .001) and b = 0.7802 (95% confidence interval: 0.3370, 1.2234; P < .006; root mean square error = 0.524; R2 = 0.88; P = .0001). Furthermore, a nonlinear regression model was applied with the following equation: SUV = b1 × b2cell number, where b1 = 0.096 (95% confidence interval: 0.7542, 1.1683; P = .0001) and b2 = 1.0035 (95% confidence interval: 1.0031, 1.0040; P = .0001; root mean square error = 0.273; R2 = 0.99; P = .0001).
Discussion
CCT with MSC is a safe and promising experimental treatment. However, MSC imaging is typically absent in swine studies, and two common methods, SPIO-NP cell prelabeling with MR imaging and reporter gene imaging with PET, have not been studied quantitatively or in tandem. Furthermore, comparisons between in vivo MSC fate in large-animal and small-animal studies are lacking. In this two-part study, we address these gaps. In the first part, we engineered MSC-TF for multimodality imaging and performed optical imaging to assess in vivo cell fate after CCT for myocardial infarction in small animals with a specific preclinical endpoint (13). Herein, we used the same MSC-TF and quantitatively determined the limit of detection of cell number after CCT in large animals (swine) with both MR imaging (prelabeling) and PET (reporter gene imaging).
A key finding was a limit of detection of approximately 1.5 × 10⁷ cells for MR imaging–based cell prelabeling and approximately 2.5 × 10⁸ cells for clinical PET/CT reporter gene cell imaging. Our limit of detection with use of prelabeling is an order of magnitude greater than reported (10), but increased NP loading can address this. For PET/CT reporter gene imaging in swine, Gyongyosi et al (4) reported imaging of approximately 5–9 × 10⁶ cells, which is approximately 50-fold lower than our results, but this study was not quantitative and the cytomegalovirus promoter was used, which has approximately 10-fold higher activity (17) than ubiquitin C. Lee et al (12) reported a PET reporter gene detection of approximately 1.0 × 10⁸ cells but did not perform a quantitative study. In contrast, Willmann et al (16) quantitatively demonstrated PET reporter gene imaging of approximately 1.0 × 10⁸ adenovirally transduced MSC expressing hsv1-tk. Because cytomegalovirus was used and there were increased reporter gene copies per cell (multiplicity of infection of 250 vs 10 in our study), a lower detection limit resulted. Overall, our data are comparable to the published data, for which quantitative studies have not been performed (11). In comparing these studies, key experimental factors can affect cell death and therefore confound PET signal data. These factors include the times between cell harvest, injection, and imaging, which can affect reporter gene activity, as can injection technique and injection contents.
The choice of promoter, ubiquitin versus cytomegalovirus, required important considerations, including strength, activity in cell types and during differentiation, risks of epigenetic silencing, and tumorigenesis. Although cytomegalovirus is stronger than ubiquitin, its activity varies among cell lines (17), exhibits tissue restriction (18), undergoes epigenetic silencing (19), and is associated with tumorigenesis (20). Conversely, ubiquitin is widely expressed in all cells (18) and is not associated with tumorigenesis. Future methods for further enhancing PET signal include promoter engineering (21), reporter gene engineering (22), and engineering of PET reporter probes (23).
For cell prelabeling, we correlated iron mass and/or concentration with signal loss or dephasing as done previously (24). We tested three orders of magnitude range (0.0055–0.165 mg). A nonideal correlation of these data reflects sources of variation, which was minimized by using the same injection equipment, injection solution, scanner and sequences, and coil, along with similar-sized swine. Here, variation may be due to inhomogeneous dispersion of NP, a nonhomogeneous magnetic field, motion artifacts, or error upon injection. We found that injection concentrations too high (approximately milligrams per milliliter) cause image distortion with T2*-weighted MR sequences, and volumes too large (approximately 1 mL) disrupt cardiac conduction. Furthermore, we performed imaging of multiple injections and noted that several imaging artifacts were apparent when multiple injections are performed. Thus, cellular injections in this setting may need to be validated with multiview in vivo and/or ex vivo MR imaging before analysis with PET/CT.
Our approach has several limitations, in particular for clinical studies. To properly use preclinical imaging data between small and large animals and patients, human MSC, not only rat MSC, need to be tested. This would require immunodeficient animals or immunosuppressive regimens. The PET reporter gene and reporter probe used herein have been approved for clinical use (25). However, the TF reporter gene used herein would have to be modified so that the enhanced green fluorescent protein and firefly luciferase 2 are excised before human studies, and a humanized PET reporter gene could be advantageous (26). An improved limit of detection could also be achieved with new quantitation techniques and cardiac gating. Furthermore, the SPIO particles we used are not approved in the clinic, whereas ferumoxytol (Feraheme; Amag Pharmaceuticals, Waltham, Mass) (approximately 18–31 nm in diameter) is (27) and so would be the iron nanoparticle of choice, although cell prelabeling with SPIO still requires approval. Other improvements include the use of PET/MR units for improved workflow.
Combining clinical molecular MR imaging (cell prelabeling) and clinical PET reporter gene molecular imaging offers several advantages. Our data indicate that injections as low as approximately 1.5 × 10⁷ prelabeled MSC-TF can be localized with MR imaging. After proliferation (11) to approximately 2.5 × 10⁸, the cells can be serially monitored with PET, whereas conventional MR imaging can be used to monitor heart function, tissue viability, and perfusion. Furthermore, the TF reporter gene for multimodality imaging enables comparison between small animals (rodents) and swine. We hope that these multimodality reporter gene approaches can be integrated into both preclinical and, eventually, clinical CCT studies and other cell therapy applications.
Practical applications: The practical applications of this work include determination of the limit of detection after CCT with both MR imaging and PET/CT, the ability to transition with the same cell line for CCT between small and large animals, and the ability to translate to humans (clinical PET/CT scanner, clinical MR imaging, approved PET-reporter probe, human promoter, and approved SPIO particle technology).
Advances in Knowledge
■ Measurement of the in vivo fate of marrow stromal cells (MSC) for cardiac cell therapy (CCT) is crucial for improving outcomes; clinical molecular MR imaging after CCT, with MSC expressing a multimodality triple fusion (TF) reporter gene (MSC-TF) and prelabeled with superparamagnetic iron oxide nanoparticles, demonstrated a significant correlation (R2 = 0.72, P = .0001) and a detection limit of approximately 1.5 × 10⁷ cells.
■ Clinical PET/CT reporter gene molecular imaging of MSC-TF after CCT demonstrated a strong correlation with a linear model (R2 = 0.88, P = .0001, root mean square error = 0.523) and a nonlinear model (R2 = 0.99, P = .0001, root mean square error = 0.273) and a detection limit of approximately 2.5 × 10⁸ cells.
■ Combining both the prelabeling of MSC-TF for MR imaging with PET/CT reporter gene imaging enables exact co-localization of MR imaging and PET signal, thereby validating injections for PET reporter gene analysis.
■ Combining large-animal and small-animal multimodality reporter gene imaging of the same MSC enables establishment of preclinical endpoints in small animals before use in large animals.
Implication for Patient Care
■ Molecular imaging can be used to improve our understanding of in vivo MSC cell fate after CCT, but we first need to determine what the limit of detection of cells is and learn how to combine the strength of normally disparate imaging modalities and fundamentally different cell labeling techniques; herein, we combined clinical PET/CT reporter gene imaging and clinical MR imaging–based cell prelabeling to localize and determine the limit of detection of MSC after CCT in swine and found that this approach can be used to improve our understanding of in vivo MSC fate after CCT in large animals and to compare MSC cell fate in small animals to inform clinical studies.
APPENDIX
Acknowledgments
Acknowledgments
The authors thank Jarrett Rosenberg, PhD, for his excellent assistance with statistical analysis and Andrei Iaguru, MD, PhD, and Ian Y. Chen, MD, PhD, for their excellent experimental advice and assistance.
Received May 21, 2015; revision requested July 23; revision received Dec 17; accepted Jan 5, 2016; final version accepted Feb 12.
S.S.G. supported in part by National Cancer Institute in Vivo Cellular and Molecular Imaging Center grant P50CA114747 and the Canary Foundation. N.P. was supported by a Stanford University Dean’s Fellowship, National Institute of Biomedical Imaging and Bioengineering T32 training grant EB009035, and a California Institute of Regenerative Medicine fellowship. K.Z. was supported by a Pfizer fellowship of the Life Science Research Foundation.
Current address: Department of Chemical and Biological Engineering, University at Buffalo, State University of New York, Buffalo, NY.
Current address: Nanotechnology Research Center, Faculty of Pharmacy, Tehran University of Medical Sciences, Tehran, Iran.
Disclosures of Conflicts of Interest: N.P. disclosed no relevant relationships. B.C.A. disclosed no relevant relationships. K.Z. disclosed no relevant relationships. K.I. disclosed no relevant relationships. R.P. disclosed no relevant relationships. J.K.W. disclosed no relevant relationships. J.C. disclosed no relevant relationships. F.I. disclosed no relevant relationships. J.C.S. disclosed no relevant relationships. D.R.M. disclosed no relevant relationships. J.K.L. disclosed no relevant relationships. D.Y. disclosed no relevant relationships. T.T. disclosed no relevant relationships. H.K. disclosed no relevant relationships. C.N.D. disclosed no relevant relationships. P.R. disclosed no relevant relationships. M.P. disclosed no relevant relationships. Y.C. disclosed no relevant relationships. M.M. disclosed no relevant relationships. J.E.C. disclosed no relevant relationships. A.B.G. disclosed no relevant relationships. F.H. disclosed no relevant relationships. S.B. disclosed no relevant relationships. S.Y. Activities related to the present article: disclosed no relevant relationships. Activities not related to the present article: received personal fees from CellSight Technologies. Other relationships: disclosed no relevant relationships. R.C.R. disclosed no relevant relationships. R.D. disclosed no relevant relationships. P.C.Y. disclosed no relevant relationships. T.J.B. disclosed no relevant relationships. P.G.Y. disclosed no relevant relationships. M.V.M. Activities related to the present article: disclosed no relevant relationships. Activities not related to the present article: received a grant from GE Healthcare; is an employee of Verily Life Sciences. Other relationships: disclosed no relevant relationships. S.S.G. Activities related to the present article: founder, owner of equity for Cellsight; received a consulting fee or honorarium from Cellsight. Activities not related to the present article: is on the board at Endra, Enlight, ImaginAb, VisualSonics/Sonosite, and Click Diagnostics; is a paid consultant for VisualSonics/Sonosite, Gamma Medica, BMEB, and Bracco; institution has grants/grants pending from GE and Sanofi-Aventis; has stock/stock options in Enlight and VisualSonics/Sonosite; received travel/accommodations/meeting expenses unrelated to activities listed from Gamma Medica. Other relationships: disclosed no relevant relationships.
Abbreviations:
- CCT
- cardiac cell therapy
- CNR
- contrast-to-noise ratio
- GRE
- gradient echo
- 18F-FHBG
- fluorine 18–radiolabeled 9-[4-fluoro-3-(hydroxyl methyl) butyl] guanine
- MSC
- marrow stromal cells
- NP
- nanoparticles
- ROI
- region of interest
- SPIO
- superparamagnetic iron oxide
- SUV
- standard uptake value
- TF
- triple fusion
References
- 1.Gerbin KA, Murry CE. The winding road to regenerating the human heart. Cardiovasc Pathol 2015;24(3):133–140. [DOI] [PMC free article] [PubMed] [Google Scholar]
- 2.Mazo M, Araña M, Pelacho B, Prosper F. Mesenchymal stem cells and cardiovascular disease: a bench to bedside roadmap. Stem Cells Int 2012;2012:175979. [DOI] [PMC free article] [PubMed] [Google Scholar]
- 3.Lelovas PP, Kostomitsopoulos NG, Xanthos TT. A comparative anatomic and physiologic overview of the porcine heart. J Am Assoc Lab Anim Sci 2014;53(5):432–438. [PMC free article] [PubMed] [Google Scholar]
- 4.Gyöngyösi M, Blanco J, Marian T, et al. Serial noninvasive in vivo positron emission tomographic tracking of percutaneously intramyocardially injected autologous porcine mesenchymal stem cells modified for transgene reporter gene expression. Circ Cardiovasc Imaging 2008;1(2):94–103. [DOI] [PMC free article] [PubMed] [Google Scholar]
- 5.Quevedo HC, Hatzistergos KE, Oskouei BN, et al. Allogeneic mesenchymal stem cells restore cardiac function in chronic ischemic cardiomyopathy via trilineage differentiating capacity. Proc Natl Acad Sci U S A 2009;106(33):14022–14027. [DOI] [PMC free article] [PubMed] [Google Scholar]
- 6.Hou D, Youssef EA, Brinton TJ, et al. Radiolabeled cell distribution after intramyocardial, intracoronary, and interstitial retrograde coronary venous delivery: implications for current clinical trials. Circulation 2005;112(9,Suppl):I150–I156. [DOI] [PubMed] [Google Scholar]
- 7.James ML, Gambhir SS. A molecular imaging primer: modalities, imaging agents, and applications. Physiol Rev 2012;92(2):897–965. [DOI] [PubMed] [Google Scholar]
- 8.Suzuki Y, Cunningham CH, Noguchi K, et al. In vivo serial evaluation of superparamagnetic iron-oxide labeled stem cells by off-resonance positive contrast. Magn Reson Med 2008;60(6):1269–1275. [DOI] [PMC free article] [PubMed] [Google Scholar]
- 9.Gambhir SS, Barrio JR, Herschman HR, Phelps ME. Assays for noninvasive imaging of reporter gene expression. Nucl Med Biol 1999;26(5):481–490. [DOI] [PubMed] [Google Scholar]
- 10.Hill JM, Dick AJ, Raman VK, et al. Serial cardiac magnetic resonance imaging of injected mesenchymal stem cells. Circulation 2003;108(8):1009–1014. [DOI] [PMC free article] [PubMed] [Google Scholar]
- 11.Perin EC, Tian M, Marini FC, III, et al. Imaging long-term fate of intramyocardially implanted mesenchymal stem cells in a porcine myocardial infarction model. PLoS One 2011;6(9):e22949. [DOI] [PMC free article] [PubMed] [Google Scholar]
- 12.Lee AS, Xu D, Plews JR, et al. Preclinical derivation and imaging of autologously transplanted canine induced pluripotent stem cells. J Biol Chem 2011;286(37):32697–32704. [DOI] [PMC free article] [PubMed] [Google Scholar]
- 13.Parashurama N, Ahn BC, Ziv K, et al. Multimodality molecular imaging of cardiac transplantation. I. Reporter design, characterization, and optical in vivo imaging of bone marrow stromal cells after myocardial infarction. Radiology 2016;28#(#):###–###. [DOI] [PMC free article] [PubMed] [Google Scholar]
- 14.Suzuki Y, Zhang S, Kundu P, Yeung AC, Robbins RC, Yang PC. In vitro comparison of the biological effects of three transfection methods for magnetically labeling mouse embryonic stem cells with ferumoxides. Magn Reson Med 2007;57(6):1173–1179. [DOI] [PubMed] [Google Scholar]
- 15.Flett AS, Hasleton J, Cook C, et al. Evaluation of techniques for the quantification of myocardial scar of differing etiology using cardiac magnetic resonance. JACC Cardiovasc Imaging 2011;4(2):150–156. [DOI] [PubMed] [Google Scholar]
- 16.Willmann JK, Paulmurugan R, Rodriguez-Porcel M, et al. Imaging gene expression in human mesenchymal stem cells: from small to large animals. Radiology 2009;252(1):117–127. [DOI] [PMC free article] [PubMed] [Google Scholar]
- 17.Qin JY, Zhang L, Clift KL, et al. Systematic comparison of constitutive promoters and the doxycycline-inducible promoter. PLoS One 2010;5(5):e10611. [DOI] [PMC free article] [PubMed] [Google Scholar]
- 18.Schorpp M, Jäger R, Schellander K, et al. The human ubiquitin C promoter directs high ubiquitous expression of transgenes in mice. Nucleic Acids Res 1996;24(9):1787–1788. [DOI] [PMC free article] [PubMed] [Google Scholar]
- 19.Krishnan M, Park JM, Cao F, et al. Effects of epigenetic modulation on reporter gene expression: implications for stem cell imaging. FASEB J 2006;20(1):106–108. [DOI] [PMC free article] [PubMed] [Google Scholar]
- 20.Lepiller Q, Aziz Khan K, Di Martino V, Herbein G. Cytomegalovirus and tumors: two players for one goal-immune escape. Open Virol J 2011;5:60–69. [DOI] [PMC free article] [PubMed] [Google Scholar]
- 21.Bianchi M, Crinelli R, Giacomini E, Carloni E, Radici L, Magnani M. Yin Yang 1 intronic binding sequences and splicing elicit intron-mediated enhancement of ubiquitin C gene expression. PLoS One 2013;8(6):e65932. [DOI] [PMC free article] [PubMed] [Google Scholar]
- 22.Lewis CM, Graves SA, Hernandez R, et al. 52Mn production for PET/MRI tracking of human stem cells expressing divalent metal transporter 1 (DMT1). Theranostics 2015;5(3):227–239. [DOI] [PMC free article] [PubMed] [Google Scholar]
- 23.Iyer M, Barrio JR, Namavari M, et al. 8-[18F]Fluoropenciclovir: an improved reporter probe for imaging HSV1-tk reporter gene expression in vivo using PET. J Nucl Med 2001;42(1):96–105. [PubMed] [Google Scholar]
- 24.Heyn C, Bowen CV, Rutt BK, Foster PJ. Detection threshold of single SPIO-labeled cells with FIESTA. Magn Reson Med 2005;53(2):312–320. [DOI] [PubMed] [Google Scholar]
- 25.Yaghoubi SS, Jensen MC, Satyamurthy N, et al. Noninvasive detection of therapeutic cytolytic T cells with 18F-FHBG PET in a patient with glioma. Nat Clin Pract Oncol 2009;6(1):53–58. [DOI] [PMC free article] [PubMed] [Google Scholar]
- 26.Campbell DO, Yaghoubi SS, Su Y, et al. Structure-guided engineering of human thymidine kinase 2 as a positron emission tomography reporter gene for enhanced phosphorylation of non-natural thymidine analog reporter probe. J Biol Chem 2012;287(1):446–454. [DOI] [PMC free article] [PubMed] [Google Scholar]
- 27.Osborn EA, Jaffer FA. The advancing clinical impact of molecular imaging in CVD. JACC Cardiovasc Imaging 2013;6(12):1327–1341. [DOI] [PMC free article] [PubMed] [Google Scholar]
Associated Data
This section collects any data citations, data availability statements, or supplementary materials included in this article.


