

Six experienced radiologists achieved moderate reproducibility for Prostate Imaging Reporting and Data System version 2 and neither required nor benefitted from a training session; agreement tended to be better in the peripheral zone than the transition zone, although it was weak for dynamic contrast–enhanced imaging in the peripheral zone.
Abstract
Purpose
To determine the interobserver reproducibility of the Prostate Imaging Reporting and Data System (PI-RADS) version 2 lexicon.
Materials and Methods
This retrospective HIPAA-compliant study was institutional review board–approved. Six radiologists from six separate institutions, all experienced in prostate magnetic resonance (MR) imaging, assessed prostate MR imaging examinations performed at a single center by using the PI-RADS lexicon. Readers were provided screen captures that denoted the location of one specific lesion per case. Analysis entailed two sessions (40 and 80 examinations per session) and an intersession training period for individualized feedback and group discussion. Percent agreement (fraction of pairwise reader combinations with concordant readings) was compared between sessions. κ coefficients were computed.
Results
No substantial difference in interobserver agreement was observed between sessions, and the sessions were subsequently pooled. Agreement for PI-RADS score of 4 or greater was 0.593 in peripheral zone (PZ) and 0.509 in transition zone (TZ). In PZ, reproducibility was moderate to substantial for features related to diffusion-weighted imaging (κ = 0.535–0.619); fair to moderate for features related to dynamic contrast material–enhanced (DCE) imaging (κ = 0.266–0.439); and fair for definite extraprostatic extension on T2-weighted images (κ = 0.289). In TZ, reproducibility for features related to lesion texture and margins on T2-weighted images ranged from 0.136 (moderately hypointense) to 0.529 (encapsulation). Among 63 lesions that underwent targeted biopsy, classification as PI-RADS score of 4 or greater by a majority of readers yielded tumor with a Gleason score of 3+4 or greater in 45.9% (17 of 37), without missing any tumor with a Gleason score of 3+4 or greater.
Conclusion
Experienced radiologists achieved moderate reproducibility for PI-RADS version 2, and neither required nor benefitted from a training session. Agreement tended to be better in PZ than TZ, although was weak for DCE in PZ. The findings may help guide future PI-RADS lexicon updates.
© RSNA, 2016
Introduction
Despite a growing array of clinical applications for prostate magnetic resonance (MR) imaging, its widespread clinical adoption was historically hindered by the lack of a uniform system for reporting and interpretation, which led to pronounced variability in its implementation among radiologists (1,2). The release of the Prostate Imaging Reporting and Data System (PI-RADS) in 2012 was an important first step in addressing this limitation and encouraging the standardization of prostate MR imaging reporting (3). PI-RADS represented a major advance by providing explicit criteria for assigning scores on a scale of 1–5 to stratify the level of suspicion for clinically significant cancer for each sequence routinely included within a multiparametric prostate MR imaging examination (3). However, early usage of PI-RADS identified some weaknesses of the system (4). By taking into account initial experiences and continued evolution of the field, an international expert panel developed a revised, second version that was released in December 2014 as PI-RADS version 2 (V2) (5). PI-RADS V2 is a more comprehensive document, though with a similar overarching aim to “promote global standardization and diminish variation in the acquisition, interpretation, and reporting of prostate MR imaging examinations” (5).
PI-RADS V2 refines the criteria for deriving the scores of 1–5 for each MR imaging sequence to potentially improve the precision of the system (5) (Tables E1–E5 [online]). For example, V2 assigns scores for findings at diffusion-weighted imaging (DWI) and on the apparent diffusion coefficient (ADC) map on the basis of mild-to-moderate versus marked signal changes, rather than by simply referring to the presence or absence of abnormal signal on the high-b-value images and the ADC map, as in version 1 (V1). In addition, an expanded array of descriptors that referred to the shape and margins of the lesions was incorporated and included terms such as focal, circumscribed, encapsulated, and obscured margins. Also, explicit instructions are provided to assign a score of 3 at both T2-weighted imaging and DWI and ADC, whereas V1 reserved a score of 3 for lesions with an “intermediate appearance not in categories 1–2 or 4–5.” Furthermore, a size threshold of 15 mm was newly introduced to differentiate between scores of 4 and 5 for T2-weighted imaging and DWI and ADC. Moreover, the scoring of dynamic contrast material–enhanced (DCE) images was greatly simplified. Whereas PI-RADS V1 scored DCE images on a 1–5 scale on the basis of the enhancement kinetics of lesions by taking into account both wash-in and washout features, PI-RADS V2 considers DCE in a binary (negative vs positive) fashion. DCE findings are considered to be positive per V2 criteria in the presence of focal enhancement that is earlier than or contemporaneous with enhancement of adjacent normal tissue and that corresponds with a suspicious finding on other sequences. In light of such revised and expanded criteria for assigning scores for each sequence, PI-RADS V2 also incorporates a new lexicon as an appendix that gives definitions of numerous terms relating to shape, margins, signal characteristics, and enhancement patterns of lesions, which therefore form the basis of the scoring criteria (5).
Formal investigations of the interreader reproducibility of the PI-RADS V2 scoring system are critical to confirm that it is attaining its primary aim of standardization. To best identify potential weaknesses and to best inform future updates, such assessments would optimally evaluate the reproducibility not only of the overall suspicion scores, but also of the lexicon that underlies the assignment of such scores. In addition, such investigations would greatly benefit from a multicenter approach given the potential greater propensity for readers from a single institution to have a similar approach to image assessment, a tendency that would bias the analysis. Thus, we conducted this multicenter study to determine the interobserver reproducibility of the PI-RADS V2 lexicon.
Materials and Methods
Patients
This retrospective study was Health Insurance Portability and Accountability Act–compliant and approved by our institutional review board with a waiver of the requirement for written informed consent. All prostate MR examinations were performed at the New York University Langone Medical Center. One radiologist at this center served as the study coordinator (A.R., with 6 years of post-fellowship experience in prostate MR imaging). The study coordinator reviewed the reports of 3-T prostate MR examinations performed on one of two 3-T systems (Magnetom Skyra or Trio; Siemens Healthcare, Erlangen, Germany) between March 2013 and January 2015 in which the coordinator was the radiologist who had provided the prospective clinical interpretation. During this period, examinations were interpreted by using a Likert scale in which a suspicion score from 1 through 5 was assigned to reported lesions on the basis of the interpreting radiologist’s gestalt impression, free of any explicit criteria (6). The prospectively assigned Likert scores were used solely for identification of a broad distribution of cases for retrospective review for purposes of this multicenter study; once cases were identified, these initial scores otherwise did not factor into the present analysis.
Only a single lesion was considered per examination; in examinations with multiple lesions, the lesion with the highest suspicion score was considered. The coordinator identified 15 examinations that each received Likert score from 2 through 5 for both the peripheral zone (PZ) and transition zone (TZ) (ie, 15 lesions with Likert score of 2 in the PZ, 15 with score of 2 in TZ, 15 with score of 3 in PZ, and 15 with score of 3 in TZ). Examinations were not selected for inclusion in the analysis for a variety of reasons: Likert score of 1 (indicating absence of any reported lesion), examination performed at 1.5T, nonenhanced examination, nonstandard DCE acquisition for examination with an identified PZ lesion, marked susceptibility artifact from hip artifact, dominant lesion reported to involve both the PZ and TZ (precluding clear assignment to a single zone), prior therapy for prostate cancer, or earlier examination from the same patient already selected for inclusion. Consecutively identified examinations were included unless 15 examinations having the given combination of zone and suspicion score had already been attained.
Approximately 700 reports were reviewed to obtain the target number of 15 examinations for each combination of zone and Likert score. This process yielded a final cohort of 120 patients with 120 lesions for analysis (60 in the PZ and 60 in the TZ; 15 lesions with Likert scores 2–5 in each zone), similar to the total number of lesions evaluated in a recent investigation of the interobserver repeatability of major diagnostic features and scoring systems for hepatocellular carcinoma detection with MR imaging (7). The included patients were a mean age of 65.3 years ± 8.5 (standard deviation) (median age, 66 years; range, 43–85 years) and had mean prostate-specific antigen level of 6.9 μg/mL ± 4.8 (median, 5.5 μg/mL [range, 1.6–26.0 μg/mL]; prostate-specific antigen was unknown in two patients). At the time of the MR imaging, 55 patients had a previous prostate biopsy positive for cancer, 23 patients had a previous prostate biopsy negative for cancer, and 42 patients had no previous prostate biopsy. Patients from this study were included in numerous previous publications unrelated to this investigation (8–14).
MR Imaging Protocol
Examinations were performed at 3 T by using an anterior pelvic phased-array coil combined with a posterior spine coil array. Axial turbo spin-echo T2-weighted imaging was performed by using the following parameters: repetition time (msec)/echo time (msec), 4000–4960/105; section thickness, 3 mm; field of view, 180 × 180 mm; 256 × 256 matrix; parallel imaging factor of two; and three averages. At the time of the examinations, the technologists who performed the examinations viewed the conventional axial turbo spin-echo T2-weighted image, and, if a motion artifact was observed, they performed an additional axial T2-weighted sequence by using a BLADE acquisition scheme (125% BLADE coverage; 5010/100; field of view, 180 × 180 mm; 256 × 256 matrix; and parallel imaging factor of two) to potentially reduce motion artifact (11). Single short echo-planar imaging DWI was performed by using the following parameters: 4100/86; section thickness, 3 mm; field of view, 200 × 200; 100 × 100 matrix; parallel imaging factor of two; 10 signal averages; and b values, 50 and 1000 sec/mm2). In an inline fashion, the console constructed both an ADC map and a calculated high-b-value image set at a b value of 1500 sec/mm2 (15) by using a monoexponential approach. In addition, in examinations in which the identified lesion was in the PZ, high spatiotemporal DCE imaging was performed by using a 5 minute 38 second continuously acquired radial golden-angle acquisition (3192 radial spokes; 4.10/1.89; flip angle, 16°; section thickness, 3 mm; field of view, 240 × 240; 224 × 224 matrix) with joint parallel imaging and compressed-sensing reconstruction that combined 21 radial spokes per time-point and yielded a temporal resolution of 2.3 seconds per time-point (16), which represented the routine DCE sequence for prostate MR imaging examinations performed at the study coordinator’s institution during the time of the study. Twenty seconds after the initiation of the DCE acquisition, 0.1 mmol/kg of gadobutrol (Gadavist; Bayer Healthcare Pharmaceuticals, Berlin, Germany) was administered intravenously at a rate of 3 mL/sec via power injector, followed by a 20-mL saline bolus at the same rate.
Image Preparation
We used OsiriX (Pixmeo, Geneva, Switzerland) to prepare anonymized Digital Imaging and Communications in Medicine files of the key sequences for each examination, which were stored on DVDs that were provided to all study readers. These included an axial T2-weighted image, ADC map, and DWI set with a calculated b value of 1500 sec/mm2. For examinations in which both a turbo spin-echo T2-weighted image and BLADE T2-weighted image were acquired, the study coordinator viewed both image sets and selected the one that had less subjective motion artifact for inclusion (turbo spin-echo T2-weighted image selected in 80 patients; BLADE T2-weighted image selected in 40 patients). In addition, for lesions with an identified PZ lesion, DCE time-points that corresponded with 10, 20, 30, 40, 50, and 60 seconds after contrast agent injection were provided, in addition to a single precontrast DCE image set. Because PI-RADS V2 advises interpretation of DCE solely on the basis of a visual assessment for early enhancement, without incorporation of time-intensity kinetic curves, pharmacokinetic maps, or other measures to indicate contrast agent washout (5), the exported image sets did not include delayed DCE time-points, screen captures of kinetic curves, or pharmacokinetic maps. A stand-alone Web-based Digital Imaging and Communications in Medicine viewer (Weasis; www.dcm4che.org) was also included on each DVD.
The study coordinator also prepared a portable document format (known as a PDF) that contained a single slide for each patient that denoted the location of the single lesion to be evaluated for each examination (120 slides total). The slide presented a single axial T2-weighted image with a circle that outlined the center of the lesion. To avoid biasing interpretations on the basis of the slide content, the lesion location was always denoted on T2-weighted imaging regardless of the sequence on which the lesion was most apparent, and the placed circle was always of the same size regardless of lesion size. Given marked differences in PI-RADS V2 assessment in the PZ and TZ, whether the lesion was to be evaluated by using PZ or TZ criteria was also recorded. This measure ensured that the readers evaluated the same set of features for each lesion. A unique numeric identifier was used to link the slides to the anonymized Digital Imaging and Communications in Medicine images.
Image Review
For purposes of this study, examinations were interpreted by six fellowship-trained abdominal radiologists at six different academic medical centers (D.C., D.M., A.W., B.T., R.G., and A.F., with 9, 9, 9, 6, 6, and 4 years of post-fellowship experience, respectively), none from the same center where the examinations were performed. The radiologists had special clinical and research interest in prostate MR imaging, and each radiologist had at least one peer-reviewed publication on the topic. One of the radiologists (D.M.) was a member of the PI-RADS V2 Steering Committee and another (B.T.) was a member of a PI-RADS V2 Working Group. The six radiologists had general familiarity with PI-RADS V1, although none had adopted it for routine clinical use, instead they had used internally developed systems. However, all six radiologists adopted PI-RADS V2 for routine examination interpretation and reporting since the system’s release approximately 6 months before the start of the readings for this investigation. No radiologist who was initially invited to participate in the investigation declined.
The radiologists independently viewed all pulse sequences for each examination together, blinded to the indication for the MR imaging and the originally assigned Likert score. Readers were provided an electronic worksheet with a series of features to evaluate for each lesion, directly drawing upon the PI-RADS V2 lexicon. For all lesions, the following features on DWI and ADC map, which are identical in the PZ and TZ in PI-RADS V2, were assessed: focal versus indistinct, marked hyperintensity at high-b-value DWI, and marked hypointensity on ADC map. For all lesions, the following feature on T2-weighted images was assessed: definite extraprostatic extension or invasive behavior. For TZ lesions, the following additional features on T2-weighted images were assessed: circumscribed versus obscured margins, encapsulation, heterogeneous versus homogeneous, moderately hypointense, lenticular shape, and definite extraprostatic extension or invasive behavior. An overall score from 1 to 5 was also assigned for T2-weighted imaging and DWI for each lesion on the basis of the PI-RADS V2 criteria for application of the lexicon to score these sequences. In addition, for PZ lesions, the readers assessed the following on DCE images: presence of any early enhancement in the region of the lesion, presence of early focal enhancement, and presence of early enhancement corresponding with the finding on other sequences. The readers also provided an overall DCE score of positive or negative, on the basis of the V2 criteria for these designations Because PI-RADS V2 assessment categories do not incorporate DCE in the TZ, DCE was not assessed for TZ lesions. The maximal axial diameter of each lesion was also recorded in accordance with the strategy for lesion measurement provided in PI-RADS V2. The study coordinator used an electronic spreadsheet to apply an automated formula to derive an overall assessment category for each lesion on the basis of the readers’ assessments by using the framework within PI-RADS V2 (5); the readers did not themselves provide these overall assessment categories. To facilitate comparison of interreader agreement between features, all measures were evaluated in a binary fashion. Accordingly, lesion size was evaluated in terms of whether or not it was at least 15 mm (corresponding with the size threshold used in PI-RADS V2), and scores of 1–5 were evaluated in terms of whether or not these scores were at least 3 and at least 4 (both of which have been applied in the literature as clinically relevant thresholds [17,18]).
Interpretation Sessions
The interpretations of the 120 examinations were performed in two sessions. The first session served as a training session and was composed of 40 examinations (20 in the PZ, 20 in TZ; five lesions for each Likert score in each zone). The second session comprised 80 examinations (40 in the PZ, 40 in the TZ; 10 lesions for each Likert score in each zone). Before the start of the first session, the readers were provided with copies of the PI-RADS V2 PDF and the reader worksheet (Table E6 [online]), with an opportunity to ask questions regarding the reading format and to provide feedback regarding the worksheet.
After the first session, a training intervention was conducted to potentially improve reproducibility. This intervention consisted of the following three elements: (a) each reader received an individualized file providing the average scores across the six readers for each feature, along with their own average score for each feature, to indicate features for which the reader tended to provide higher or lower scores compared with the group; (b) each reader also received an individualized file that listed all features for all patients in which a majority of readers provided a concordant interpretation, and in which the given reader was in the minority; and (c) a catalog was created of all features for all lesions in which there was no consensus (ie, three readers who scored the feature each way [positive and negative findings]), and a cloud-based discussion forum was conducted in which the readers were invited to provide reasons for their assignments and to debate the optimal scoring. This virtual discussion forum lasted for 2 weeks, and received contributions from five of the six readers.
All second-session readings occurred after completion of the training intervention.
Pathologic Assessment
The electronic medical record was searched to identify patients with an available histologic reference standard obtained after the MR imaging. Sixty-three patients underwent subsequent targeted transrectal biopsy with real-time MR imaging and ultrasonographic (US) fusion guidance; concurrent 12-core systematic sampling was performed during the same biopsy session in 61 of these patients. Targeted biopsy was performed by using the Ei-Nav Artemis system (Eigen, Grass Valley, Calif), in conjunction with ProFuse software (Eigen) for prostate segmentation and annotation of MR imaging–derived targets (19), with at least two fusion-guided targeted cores taken from each lesion identified by using MR imaging. The biopsy results were obtained from standard pathologic reports. Given an estimated registration error of 3–4 mm by using fusion systems for targeted prostate biopsy (20–22), any tumor within the targeted cores or within the nearest adjacent systematic core was considered to correspond with the MR-imaged lesion. Radical prostatectomy was performed in 29 patients, although none of the specimens underwent whole-mount processing. Radical prostatectomy was not used as the histologic reference standard because of the limited number of such cases, the relative challenge in correlating tumor locations between the sectioned prostatectomy specimen and the MR imaging sections compared with the use of results of MR imaging–targeted biopsy for this purpose, and the selection bias inherent in the use of radical prostatectomy (exclusion of patients without cancer, and of patients with cancer on active surveillance or having advanced disease).
Statistical Assessment
Interreader agreement for each feature for each of the two sessions was evaluated by using two statistics. First, κ coefficients were computed and assessed as follows (7): 0.01–020, slight agreement; 0.21–0.40, fair agreement; 0.41–0.60, moderate agreement; 0.61–0.80, substantial agreement; and 0.81–0.99, almost perfect agreement. κ coefficients are influenced by the prevalence of the observation and could be misleadingly low in the setting of high prevalence of a given observation, even if interreader agreement is nearly perfect (23–25). Therefore, the percent agreement (defined as the fraction of all 15 possible pair-wise reader combinations with a concordant reading) was also computed for each feature (23), which provided a measure of agreement that is not directly influenced by changes in prevalence of the observation.
The percent agreement was compared between sessions by using logistic regression for correlated data, both with and without consideration for multiple comparisons on the basis of a Bonferroni-corrected P value of less than .0015 (significance level of .05 divided by 33 comparisons) that indicated significance. Specifically, generalized estimating equations on the basis of logistic regression were used to model the binary indicator of agreement as a function of session while accounting for within-patient correlation among results for the same patient. The analysis assumed results to be symmetrically correlated when derived for the same patient and independent when derived for different patients.
On the basis of a post hoc assessment, the sample sizes of the two sessions provided approximately 80% power to detect a difference in percent agreement between sessions of 10% and 7% when assessed either with or without the correction, respectively. The κ coefficients and percent agreement were compared between the two sessions to decide whether to combine results from the two sessions for a pooled analysis on the basis of the presence or absence of an apparent effect of the training period. To assess the diagnostic performance of the readers’ interpretations, biopsy yields were computed among the patients who underwent targeted biopsy by using fusion of MR imaging and US. These yields were computed as percentages of patients who demonstrated various histologic results (benign tissue, Gleason score ≥3+3 tumor, Gleason score ≥3+4 tumor) among all patients for whom a given threshold PI-RADS V2 assessment category (either ≥3 or ≥4) was assigned by a majority of readers. Sensitivity and specificity for detection of Gleason score of 3+4 or greater tumor were also computed for interpretations of PI-RADS assessment category of 3 or greater and PI-RADS assessment category of 4 or greater when assigned by a majority of readers. Statistical assessment was performed by using software (SAS version 9.3; SAS Institute, Cary, NC).
Results
Table 1 shows the percentage of positive interpretations, pooled among all six readers, for all study features. Table 2 shows the κ coefficients and interreader agreement for all features. Without correcting for multiple comparisons, six features showed an increase in percent agreement and six features showed a decrease in percent agreement between the two sessions. When corrected for multiple comparisons, only one feature showed a difference in percent agreement between sessions (DWI score in the TZ, ≥ 3; P < .001). In addition, in session 2, κ values increased for 16 parameters and decreased for 17 parameters. Therefore, the training period was considered not to have had a substantial effect, and pooled results for all 120 lesions from both sessions were considered for the remaining analyses.
Table 1.
Percentage of Interpretations Scored as Positive among the Six Readers
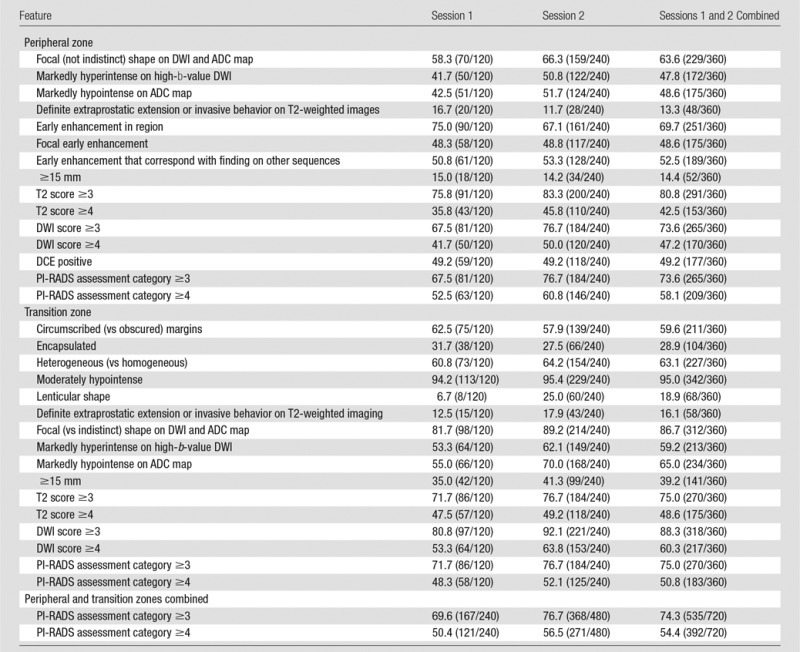
Note.—Data are percentages; data in parentheses are numerators and denominators.
Table 2.
Interreader Agreement
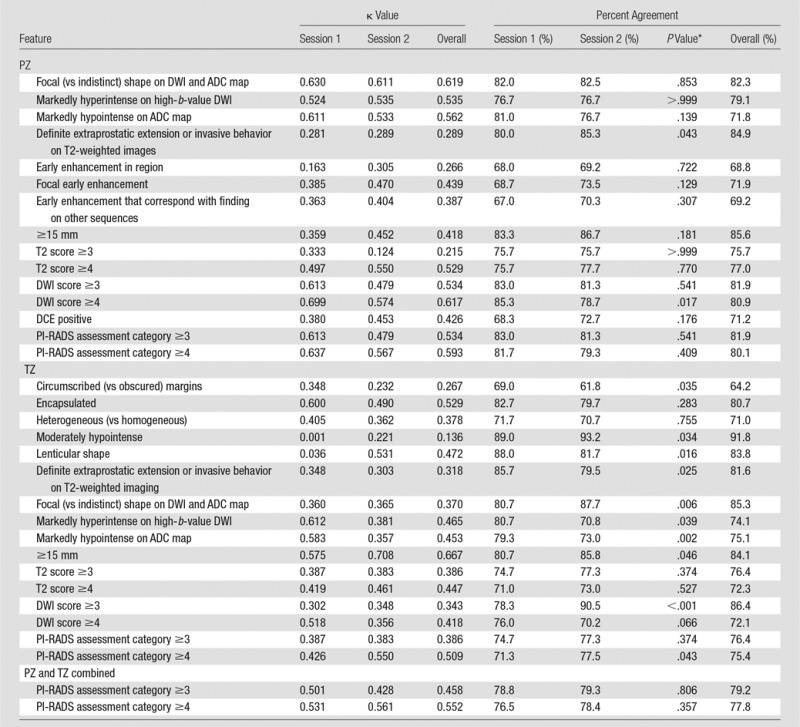
*P value for comparison of sessions 1 and 2, derived from logistic regression for correlated data. Bonferroni-corrected P values are considered statistically significant when they are less than .001.
In terms of overall assessment categories, κ was higher for PI-RADS assessment category of 4 or greater than for PI-RADS assessment category of 3 or greater whether in the PZ, TZ, or both zones combined (κ values of 0.509–0.593 vs 0.386–0.534, respectively). In addition, whether at a threshold of PI-RADS assessment category of 3 or greater or PI-RADS assessment category of 4 or greater, agreement was higher in the PZ than in the TZ (κ values of 0.534–0.593 vs 0.386–0.509, respectively). Nonetheless, at a threshold of PI-RADS assessment category of 4 or greater, the six readers reached moderate reproducibility in both the PZ (κ = 0.593) and TZ (κ = 0.509).
In the PZ, reproducibility for features related to DWI was substantial for focal shape (κ = 0.619) and moderate for those related to marked high-b-value or ADC map signal abnormality (κ = 0.535–0.562). Agreement was substantial for DWI score of 4 or greater (κ = 0.617) and moderate for DWI score of 3 or greater (κ = 0.534). Reproducibility was fair to moderate for features related to DCE (κ = 0.266–0.439). Figure 1 shows a representative PZ lesion with interreader variability.
Figure 1a:
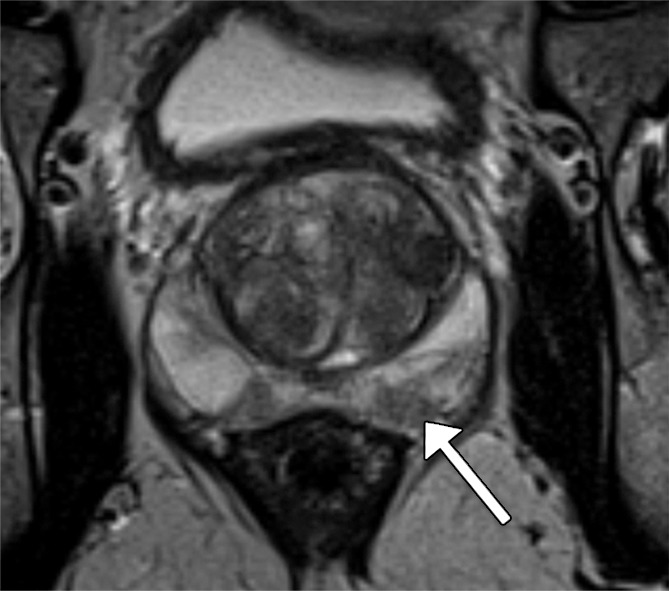
Images in a 72-year-old man who has not undergone previous prostate biopsy and with prostate-specific antigen of 6.4 μg/mL. Readers evaluated left transition zone lesion (arrow) on (a) axial T2-weighted image, (b) high-b-value DWI, and (c) ADC map. Three readers assessed the lesion as having circumscribed margins, and three readers assessed the lesion as having obscured margins. Overall PI-RADS assessment categories assigned by the six readers were 2, 2, 3, 5, 5, and 5, respectively (three readers scored PI-RADS ≥4, three scored PI-RADS <4). On subsequent MR imaging and US fusion biopsy, the lesion exhibited Gleason score 3+3 tumor.
Figure 1b:
Images in a 72-year-old man who has not undergone previous prostate biopsy and with prostate-specific antigen of 6.4 μg/mL. Readers evaluated left transition zone lesion (arrow) on (a) axial T2-weighted image, (b) high-b-value DWI, and (c) ADC map. Three readers assessed the lesion as having circumscribed margins, and three readers assessed the lesion as having obscured margins. Overall PI-RADS assessment categories assigned by the six readers were 2, 2, 3, 5, 5, and 5, respectively (three readers scored PI-RADS ≥4, three scored PI-RADS <4). On subsequent MR imaging and US fusion biopsy, the lesion exhibited Gleason score 3+3 tumor.
Figure 1c:
Images in a 72-year-old man who has not undergone previous prostate biopsy and with prostate-specific antigen of 6.4 μg/mL. Readers evaluated left transition zone lesion (arrow) on (a) axial T2-weighted image, (b) high-b-value DWI, and (c) ADC map. Three readers assessed the lesion as having circumscribed margins, and three readers assessed the lesion as having obscured margins. Overall PI-RADS assessment categories assigned by the six readers were 2, 2, 3, 5, 5, and 5, respectively (three readers scored PI-RADS ≥4, three scored PI-RADS <4). On subsequent MR imaging and US fusion biopsy, the lesion exhibited Gleason score 3+3 tumor.
In the TZ, reproducibility for features related to lesion texture and margins at T2-weighted imaging ranged from 0.136 (moderately hypointense) to 0.529 (encapsulation). Reproducibility for measures related to DWI was lower in the TZ (κ = 0.343–0.465) than in the PZ. The feature that achieved highest reproducibility in the TZ was a size of 15 mm or larger (κ = 0.667). Figure 2 shows a representative TZ lesion with interreader variability.
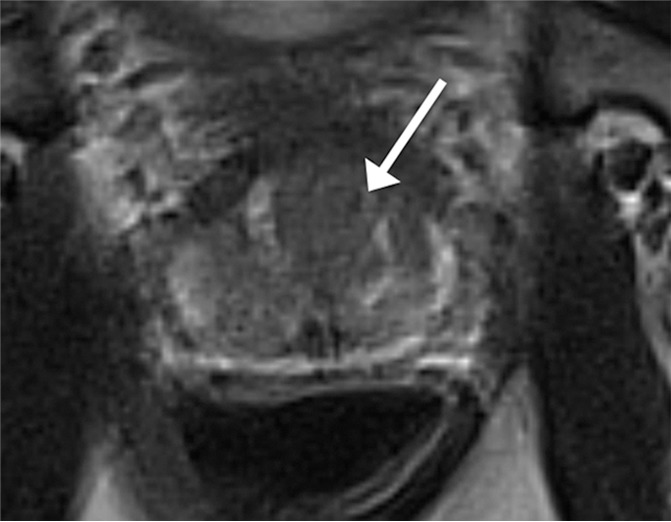
Figure 2a:
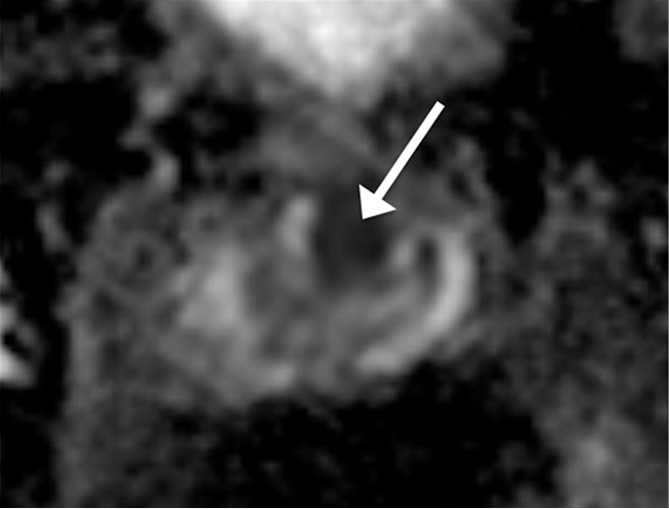
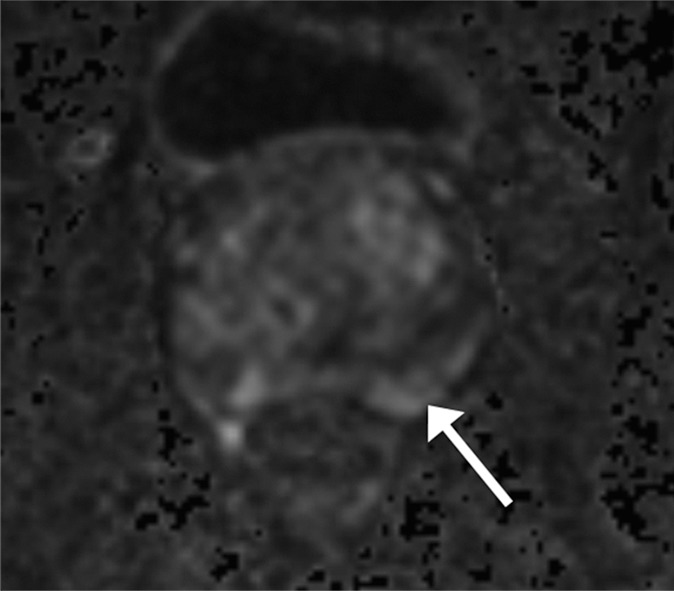
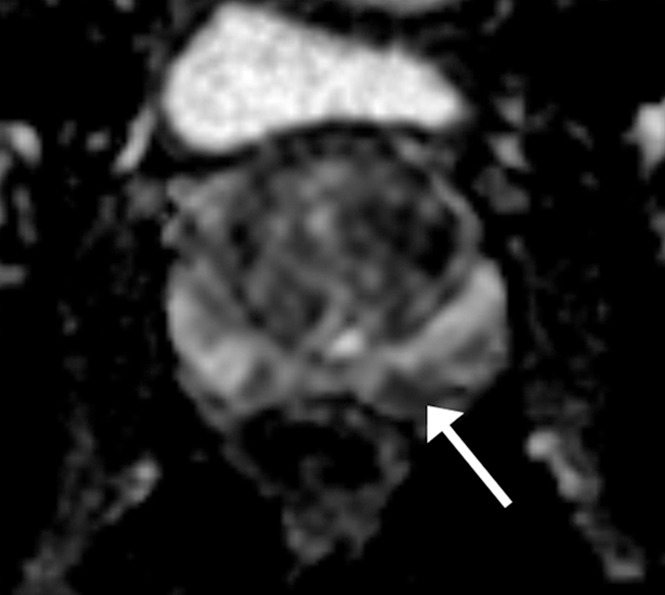
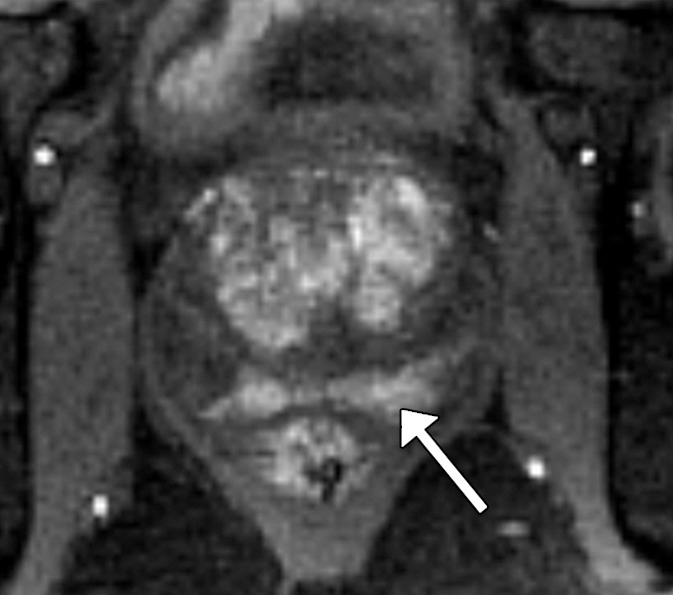
Images in a 61-year-old man who has not undergone previous prostate biopsy and with prostate-specific antigen of 7.7 μg/mL. Readers evaluated left peripheral zone lesion (arrow) on (a) axial T2-weighted image, (b) high-b-value DWI, (c) ADC map, and (d) early DCE time-point. Five of six readers assessed the lesion as showing early enhancement. However, it is equivocal whether this represents diffuse background enhancement or corresponds with the lesion on other sequences, and only two readers considered the lesion as meeting PI-RADS V2 criteria for DCE (+).Overall PI-RADS assessment category assigned by the six readers were 2, 3, 3, 4, 4, and 4 (three readers scored PI-RADS ≥4, three scored PI-RADS <4). On subsequent MR imaging and US fusion biopsy, the lesion exhibited Gleason score 3+3 tumor.
Figure 2b:
Images in a 61-year-old man who has not undergone previous prostate biopsy and with prostate-specific antigen of 7.7 μg/mL. Readers evaluated left peripheral zone lesion (arrow) on (a) axial T2-weighted image, (b) high-b-value DWI, (c) ADC map, and (d) early DCE time-point. Five of six readers assessed the lesion as showing early enhancement. However, it is equivocal whether this represents diffuse background enhancement or corresponds with the lesion on other sequences, and only two readers considered the lesion as meeting PI-RADS V2 criteria for DCE (+).Overall PI-RADS assessment category assigned by the six readers were 2, 3, 3, 4, 4, and 4 (three readers scored PI-RADS ≥4, three scored PI-RADS <4). On subsequent MR imaging and US fusion biopsy, the lesion exhibited Gleason score 3+3 tumor.
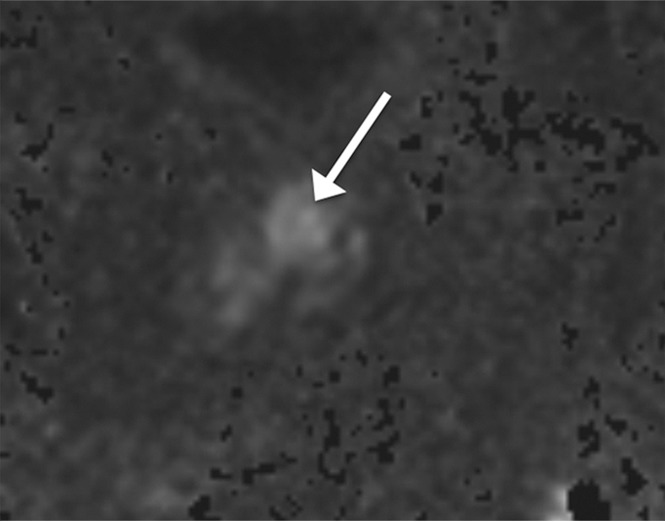
Figure 2c:
Images in a 61-year-old man who has not undergone previous prostate biopsy and with prostate-specific antigen of 7.7 μg/mL. Readers evaluated left peripheral zone lesion (arrow) on (a) axial T2-weighted image, (b) high-b-value DWI, (c) ADC map, and (d) early DCE time-point. Five of six readers assessed the lesion as showing early enhancement. However, it is equivocal whether this represents diffuse background enhancement or corresponds with the lesion on other sequences, and only two readers considered the lesion as meeting PI-RADS V2 criteria for DCE (+).Overall PI-RADS assessment category assigned by the six readers were 2, 3, 3, 4, 4, and 4 (three readers scored PI-RADS ≥4, three scored PI-RADS <4). On subsequent MR imaging and US fusion biopsy, the lesion exhibited Gleason score 3+3 tumor.
Figure 2d:
Images in a 61-year-old man who has not undergone previous prostate biopsy and with prostate-specific antigen of 7.7 μg/mL. Readers evaluated left peripheral zone lesion (arrow) on (a) axial T2-weighted image, (b) high-b-value DWI, (c) ADC map, and (d) early DCE time-point. Five of six readers assessed the lesion as showing early enhancement. However, it is equivocal whether this represents diffuse background enhancement or corresponds with the lesion on other sequences, and only two readers considered the lesion as meeting PI-RADS V2 criteria for DCE (+).Overall PI-RADS assessment category assigned by the six readers were 2, 3, 3, 4, 4, and 4 (three readers scored PI-RADS ≥4, three scored PI-RADS <4). On subsequent MR imaging and US fusion biopsy, the lesion exhibited Gleason score 3+3 tumor.
Definite extraprostatic extension or invasive behavior on T2-weighted images had fair agreement in both zones (κ = 0.289–0.318).
On the basis of the pathologic results in the 63 patients who underwent subsequent MR imaging and US fusion-guided biopsy (Table 3), the lesions observed on MR images were classified as positive for tumor in 47.6% (30 of 63) and positive for tumor with a Gleason score of 3+4 in 27.0% (17 of 63). The distribution of Gleason score in positive lesions was 3+3 (n = 13), 3+4 (n = 8), 4+3 (n = 5), 4+4 (n = 1), and 4+5 (n = 3). All lesions with a Gleason score of 3+4 or greater were classified as PI-RADS assessment category of 4 or greater by a majority of the six readers (classified as PI-RADS ≥4 by four readers in 5.9% [one of 17], by five readers in 17.6% [three of 17], and by all six readers in 76.5% [13 of 17]). Among lesions classified as PI-RADS assessment category of 4 or greater by a majority of readers, 67.6% (25 of 37) were Gleason score of 3+3 or greater and 45.9% (17 of 37) were Gleason score of 3+4 or greater. Among lesions not classified as PI-RADS assessment category of 4 or greater by a majority of readers, 84.6% were benign, 15.4% were Gleason score of 3+3, and none were Gleason score greater than 3+3. For detection of tumor with a Gleason score of 3+4 or greater among the selected lesions, interpretations of PI-RADS assessment category of 3 or greater and of PI-RADS assessment category of 4 or greater by a majority of readers both had sensitivity of 100%, as well as specificity of 39.1% and 56.5%, respectively.
Table 3.
Association of Reader Assessments and Pathologic Results from Combined Systematic and MR Imaging and US Fusion Targeted Biopsy
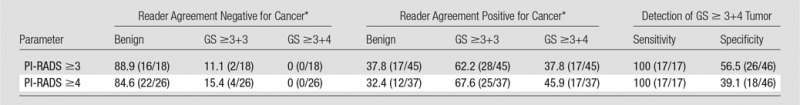
Note.—Concurrent systematic sampling performed in 61 of 63 patients who underwent MR imaging and US fusion-targeted biopsy. Data are percentages. Data in parentheses are numerator and denominator. GS = Gleason score.
*Reader agreement required that a majority (at least four) of the six readers assigned a lesion a PI-RADS assessment category meeting the specified threshold (3 or 4).
Discussion
We observed overall moderate reproducibility in the use of PI-RADS V2 among six experienced prostate radiologists from different academic centers (κ = 0.552 for PI-RADS ≥4 when pooling PZ and TZ lesions in both sessions combined). This level of reproducibility compares favorably with that reported for the Breast Imaging Reporting and Data System (BI-RADS) on which PI-RADS was modeled (5). For example, κ values for overall BI-RADS categories reported within the peer-reviewed literature have included 0.45 for mammography (26), and κ values of 0.21–0.28 for breast US (27,28). In addition, one study reported a κ value of 0.45 among expert readers by using the Liver Imaging Reporting and Data System (known as LI-RADS) (7), while another investigation reported a κ value of 0.61 for use of the Thyroid Imaging Reporting and Data System (known as TI-RADS) (29). Therefore, while our data show considerable interreader variation by using PI-RADS V2, the system appears to achieve reasonable consistency in view of published data regarding reporting systems for other cancer imaging examinations that are currently in clinical usage.
Past investigations also explored the reproducibility of PI-RADS. In one additional study that evaluated PI-RADS V2, Muller et al (30) reported a κ value of 0.46. In studies that evaluated the PI-RADS V1 sum score (on a 3–15 scale), Renard-Penna et al (31), Vaché et al (32), and Rosenkrantz et al (6) reported κ values of 0.73, 0.38–0.44, and 0.56, respectively. In addition, Schimmöller et al (33) reported κ values that ranged from 0.63 to 0.80 for the individual sequence scores by using PI-RADS V1. However, these other studies evaluated agreement among readers from a single center. Readers from a single center may have a heightened tendency to approach cases similarly, whether through individual adoption of the predominant local interpretation schemes, internal consultations for equivocal cases, peer review of one another’s reports, or other factors. In addition, readers from a single center have greater familiarity with the local imaging protocol and may be able to apply insights from histologic correlations performed by using the local protocol to influence their interpretations. Thus, single-center studies may suggest greater interreader agreement, if not greater agreement with a histologic reference, than is actually encountered across multiple centers in clinical practice. Ultimately, it is agreement among radiologists across centers that is critical for enabling consistent management decisions among treating physicians on the basis of the reported suspicion levels. In this regard, the moderate reproducibility that we observed among radiologists at six different centers is reassuring in terms of the potential ability of PI-RADS V2 to be applied consistently across practices.
The training period, which incorporated individualized feedback and group discussion, did not yield a noticeable improvement in reproducibility. Past studies showed improved diagnostic accuracy in prostate MR imaging interpretation after an educational intervention among radiology fellows (34,35). An additional study (26) showed an improvement in κ value from 0.31 to 0.45 in the interpretation of mammography among practicing physicians after a training intervention. The similar reproducibility that occurred before and after the training period can be interpreted in different ways: The readers failed to benefit from the intervention, which suggested a potential limit to the degree of reproducibility that may be achieved for qualitative imaging-based descriptors, despite measures taken to aim to identify and improve upon areas of disagreement. However, experienced readers did not require an extensive training period to achieve moderate reproducibility. The PI-RADS V2 lexicon can be directly applied with reasonable consistency by radiologists familiar with prostate MR imaging simply on the basis of an awareness of the lexicon descriptions provided in the source document. Intuitively, the radiologists’ pre-existing expertise in prostate MR imaging contributed to the lack of effect of the training session. Therefore, further studies are required to evaluate the potential impact of a training intervention on the reproducibility of PI-RADS V2 among inexperienced observers.
In the PZ, findings that involved the interpretation of DCE images had the lowest reproducibility, whether relating to the mere presence of early enhancement, or to the extent to which such early enhancement was focal or matched findings on other sequence. Visual evaluation of DCE images is confounded by the combination of the need to review multiple dynamic time-points (compared with review of a single image set for other qualitative features), the frequent nature of nonspecific background enhancement in the PZ, and the lack of a clear temporal definition for what constitutes early enhancement. The occasional presence of hemorrhage after biopsy compounds these challenges regarding consistent interpretation of DCE images. PI-RADS V2 aims to simplify the assessment of DCE images compared with PI-RADS V1 by removing consideration of signal intensity kinetic curves, pharmacokinetic maps, or delayed time-points for washout. However, we speculate that these sophisticated assessments may be useful to more reliably determine the presence of an abnormal enhancement pattern, in part because such assessments may distill multiple postcontrast time-points to a single image set for review. While the DCE imaging score only influences whether to assign an overall PI-RADS assessment category of 3 or 4 in the PZ, the distinction between these two categories represents a potential threshold in decisions regarding whether to perform targeted biopsy (17). Therefore, consideration of approaches to improve the reproducibility of the interpretation of DCE images is warranted.
The TZ traditionally was considered to provide a greater challenge than the PZ, even when formal interpretation systems were used. This was largely related to the presence of nodules of benign prostatic hyperplasia throughout the TZ. For instance, one study that used the PI-RADS V1 sum score reported a κ value of 0.59 in the PZ compared with 0.45 in the TZ (6). Another study that used PI-RADS V1 reported a concordance coefficient among experienced readers of 0.677 in the PZ, compared with 0.376 in the TZ (36). In light of these earlier findings, our observed moderate agreement for PI-RADS score of 4 or greater in the TZ of 0.509, albeit somewhat lower than that in the PZ, is encouraging regarding a potential improvement achieved by PI-RADS V2 in TZ assessment. This potential benefit of PI-RADS V2 may relate to its provision of a more nuanced lexicon to guide determination of levels of suspicion in TZ lesions.
κ coefficients were higher, at a threshold of 4 or greater versus 3 or greater, regardless of zone or assessment of T2-weighted imaging, DWI, or overall PI-RADS category. This observation is of particular relevance because past literature (8,17,18) variably suggested suspicion levels of both 3 and 4 to serve as thresholds for performing targeted biopsy. In order for a given threshold to be broadly accepted and integrated into routine clinical practice, radiologists must be able to evaluate examinations at that threshold in a reproducible fashion. Not only did a threshold of PI-RADS assessment category of 4 or greater achieve greater reproducibility, it also had a substantial yield of clinically significant (Gleason score ≥3+4) cancer of approximately 45%, while not missing any tumors with a Gleason scores of 3+4 or greater within a limited cohort of patients for whom a pathologic reference standard was available. While decisions to perform targeted biopsy of MR imaging findings will continue to be influenced by a range of clinical factors (37), including prostate-specific antigen, ancillary biomarkers, previous biopsy results, and patient preference, our observations may support clinical paradigms that use a threshold of PI-RADS assessment category of 4 or greater to select MR imaging lesions for targeted biopsy.
We anticipate that our findings may be useful for guiding future updates of the PI-RADS lexicon. Specifically, continued revisions may contain adjustments to reflect our observations regarding the features that have greatest reproducibility. For example, in the PZ, subjective features relating to DWI and ADC, which largely drive the overall assessment category in this zone, had moderate-to-substantial agreement. On the other hand, features that had an incremental effect relative to DWI and ADC, such as definitive extraprostatic extension, size of 15 mm or greater, and DCE characteristics, all had poorer reproducibility. In the TZ, the individual features that contributed to the overall assessment category varied considerably in terms of their reproducibility, and encapsulation was the most reproducible among the subjective features. These findings may help inform selection of features to receive greater or lesser emphasis in potential revisions to the PI-RADS, particularly in the TZ. Potential exclusion of less reproducible features (ie, moderate hypointensity in the TZ) would also serve to further simplify the interpretation system.
Our study has a number of limitations. The primary limitation may be that the readers only evaluated features for a single a priori specified lesion for each examination. Thus, variability that resulted from differences in selection of a dominant lesion was not considered. This method was chosen because of an emphasis on the PI-RADS V2 lexicon and to ensure that all readers assessed the components of this lexicon for the same abnormality. In addition, all examinations were performed at a single center by using a single MR imaging protocol. It is possible that reproducibility may be different if some of the technical aspects of the acquisition varied (ie, if examinations were acquired at 1.5 T or used an endorectal coil, if there were different b values for DWI and ADC, or if a different temporal resolution was used for DCE). Also, the extent of correlative pathologic data available for the lesions is limited in view of the study’s primary aim and design to evaluate interreader agreement. Further studies with different methodologic designs are required to more reliably evaluate the cancer detection rates associated with the PI-RADS assessment category. Finally, as previously noted, this study only included experienced readers of prostate MR imaging. This approach removes reader inexperience as a potential source of variability and better probes the potential maximal attainable reproducibility that may be anticipated in an optimal reader setting. Nonetheless, we acknowledge that additional studies with inexperienced readers would be informative.
In conclusion, experienced radiologists from different academic centers achieved moderate reproducibility by using the PI-RADS V2 lexicon, and they neither required nor benefitted from a training session. Agreement in terms of the overall PI-RADS assessment category was somewhat higher in the PZ than the TZ. In the PZ, agreement was weakest for DCE imaging. Among subjective features in the TZ, agreement was highest for encapsulation and weakest for moderate hypointensity. Agreement, as indicated by κ coefficients, was better at an overall PI-RADS assessment category of 4 or greater than of 3 or greater, and an interpretation by a majority of readers of PI-RADS assessment category of 4 or greater did not miss any tumors with a Gleason score of 3+4 or greater within our cohort. The findings may be useful in guiding future PI-RADS lexicon updates.
Advances in Knowledge
■ Interreader agreement among six experienced prostate radiologists by using Prostate Imaging Reporting and Data System (PI-RADS) version 2 (V2) for assessment category 4 or greater was moderate (peripheral zone [PZ] κ = 0.593, transition zone [TZ] κ = 0.509, and κ = 0.552 in both zones combined].
■ In the PZ, reproducibility was moderate to substantial for features related to diffusion-weighted imaging (DWI) (κ = 0.535–0.619), fair to moderate for features relating to dynamic contrast–enhanced imaging (κ = 0.266–0.439), and fair for definite extraprostatic extension on T2-weighted images (κ = 0.289).
■ In the TZ, reproducibility for features related to lesion texture and margins on T2-weighted imaging were variable reflected by κ values that ranged from 0.136 (moderately hypointense) to 0.529 (encapsulation).
■ A training period that combined individualized feedback and group discussion did not substantially improve interreader reproducibility for the evaluated features; only one feature (DWI score in the TZ of ≥3) showed an improvement in percent agreement among readers once corrected for multiple comparisons (P < .001).
■ Among lesions that underwent targeted biopsy, classification as PI-RADS score of 4 or greater by a majority of readers yielded a tumor with a Gleason score of 3+4 or greater in 45.9% (17 of 37), without missing any tumor with a Gleason score of 3+4 or greater.
Implication for Patient Care
■ Despite considerable variation in reproducibility for individual features within the PI-RADS version 2 lexicon, the system achieved reasonable interreader reproducibility among experienced radiologists for PI-RADS score of 4 or greater in both the PZ and TZ; further studies are needed to evaluate reproducibility and the influence of training interventions among less experienced radiologists.
SUPPLEMENTAL TABLES
Received November 18, 2015; revision requested December 22; revision received January 8, 2016; accepted January 19; final version accepted January 28.
B.T. is an employee of the National Institutes of Health.
Current address: Tairawhiti District Health, Gisborne, New Zealand.
Disclosures of Conflicts of Interest: A.B.R. disclosed no relevant relationships. L.A.G. disclosed no relevant relationships. D.C. disclosed no relevant relationships. A.T.F. disclosed no relevant relationships. R.T.G. Activities related to the present article: disclosed no relevant relationships. Activities not related to the present article: disclosed a consultancy for Invivo. Other relationships: disclosed no relevant relationships. B.T. disclosed no relevant relationships. A.C.W. Activities related to the present article: disclosed no relevant relationships. Activities not related to the present article: disclosed money paid by 3D Biopsy for membership on a scientific advisory board. Other relationships: disclosed no relevant relationships. J.S.B. disclosed no relevant relationships. D.J.M. Activities related to the present article: disclosed no relevant relationships. Activities not related to the present article: disclosed an institutional grant without salary support from Siemens Medical Systems. Other relationships: disclosed no relevant relationships.
Abbreviations:
- ADC
- apparent diffusion coefficient
- DCE
- dynamic contrast material enhanced
- DWI
- diffusion-weighted imaging
- PI-RADS
- Prostate Imaging Reporting and Data System
- PZ
- peripheral zone
- TZ
- transition zone
- V1
- version 1
- V2
- version 2
References
- 1.Barentsz JO, Weinreb JC, Verma S, et al. Synopsis of the PI-RADS v2 Guidelines for Multiparametric Prostate Magnetic Resonance Imaging and Recommendations for Use. Eur Urol 2016;69(1):41–49. [DOI] [PMC free article] [PubMed] [Google Scholar]
- 2.Heidenreich A. Consensus criteria for the use of magnetic resonance imaging in the diagnosis and staging of prostate cancer: not ready for routine use. Eur Urol 2011;59(4):495–497. [DOI] [PubMed] [Google Scholar]
- 3.Barentsz JO, Richenberg J, Clements R, et al. ESUR prostate MR guidelines 2012. Eur Radiol 2012;22(4):746–757. [DOI] [PMC free article] [PubMed] [Google Scholar]
- 4.Barrett T, Turkbey B, Choyke PL. PI-RADS version 2: what you need to know. Clin Radiol 2015;70(11):1165–1176. [DOI] [PMC free article] [PubMed] [Google Scholar]
- 5.American College of Radiology . MR Prostate Imaging Reporting and Data System version 2.0. http://www.acr.org/Quality-Safety/Resources/PIRADS/. Accessed December 23, 2015.
- 6.Rosenkrantz AB, Kim S, Lim RP, et al. Prostate cancer localization using multiparametric MR imaging: comparison of Prostate Imaging Reporting and Data System (PI-RADS) and Likert scales. Radiology 2013;269(2):482–492. [DOI] [PubMed] [Google Scholar]
- 7.Davenport MS, Khalatbari S, Liu PS, et al. Repeatability of diagnostic features and scoring systems for hepatocellular carcinoma by using MR imaging. Radiology 2014;272(1):132–142. [DOI] [PMC free article] [PubMed] [Google Scholar]
- 8.Mendhiratta N, Meng X, Rosenkrantz AB, et al. Prebiopsy MRI and MRI-ultrasound fusion-targeted prostate biopsy in men with previous negative biopsies: impact on repeat biopsy strategies. Urology 2015;86(6):1192–1199. [DOI] [PMC free article] [PubMed] [Google Scholar]
- 9.Mendhiratta N, Rosenkrantz AB, Meng X, et al. Magnetic resonance imaging-ultrasound fusion targeted prostate biopsy in a consecutive cohort of men with no previous biopsy: reduction of over detection through improved risk stratification. J Urol 2015;194(6):1601–1606. [DOI] [PubMed] [Google Scholar]
- 10.Meng X, Rosenkrantz AB, Mendhiratta N, et al. Relationship between prebiopsy multiparametric magnetic resonance imaging (MRI), biopsy indication, and MRI-ultrasound fusion-targeted prostate biopsy outcomes. Eur Urol 2016;69(3):512–517. [DOI] [PMC free article] [PubMed] [Google Scholar]
- 11.Rosenkrantz AB, Bennett GL, Doshi A, Deng FM, Babb JS, Taneja SS. T2-weighted imaging of the prostate: Impact of the BLADE technique on image quality and tumor assessment. Abdom Imaging 2015;40(3):552–559. [DOI] [PubMed] [Google Scholar]
- 12.Rosenkrantz AB, Khalef V, Xu W, Babb JS, Taneja SS, Doshi AM. Does normalisation improve the diagnostic performance of apparent diffusion coefficient values for prostate cancer assessment? A blinded independent-observer evaluation. Clin Radiol 2015;70(9):1032–1037. [DOI] [PubMed] [Google Scholar]
- 13.Rosenkrantz AB, Meng X, Ream JM, et al. Likert score 3 prostate lesions: Association between whole-lesion ADC metrics and pathologic findings at MRI/ultrasound fusion targeted biopsy. J Magn Reson Imaging 2016;43(2):325–332. [DOI] [PubMed] [Google Scholar]
- 14.Rosenkrantz AB, Shanbhogue AK, Wang A, Kong MX, Babb JS, Taneja SS. Length of capsular contact for diagnosing extraprostatic extension on prostate MRI: Assessment at an optimal threshold. J Magn Reson Imaging 2015 Sep 23. [Epub ahead of print] [DOI] [PubMed] [Google Scholar]
- 15.Rosenkrantz AB, Chandarana H, Hindman N, et al. Computed diffusion-weighted imaging of the prostate at 3 T: impact on image quality and tumour detection. Eur Radiol 2013;23(11):3170–3177. [DOI] [PubMed] [Google Scholar]
- 16.Rosenkrantz AB, Geppert C, Grimm R, et al. Dynamic contrast-enhanced MRI of the prostate with high spatiotemporal resolution using compressed sensing, parallel imaging, and continuous golden-angle radial sampling: preliminary experience. J Magn Reson Imaging 2015;41(5):1365–1373. [DOI] [PMC free article] [PubMed] [Google Scholar]
- 17.Hoeks CM, Somford DM, van Oort IM, et al. Value of 3-T multiparametric magnetic resonance imaging and magnetic resonance-guided biopsy for early risk restratification in active surveillance of low-risk prostate cancer: a prospective multicenter cohort study. Invest Radiol 2014;49(3):165–172. [DOI] [PubMed] [Google Scholar]
- 18.Harada T, Abe T, Kato F, et al. Five-point Likert scaling on MRI predicts clinically significant prostate carcinoma. BMC Urol 2015;15:91. [DOI] [PMC free article] [PubMed] [Google Scholar]
- 19.Wysock JS, Rosenkrantz AB, Huang WC, et al. A prospective, blinded comparison of magnetic resonance (MR) imaging-ultrasound fusion and visual estimation in the performance of MR-targeted prostate biopsy: the PROFUS trial. Eur Urol 2014;66(2):343–351. [DOI] [PubMed] [Google Scholar]
- 20.Martin PR, Cool DW, Romagnoli C, Fenster A, Ward AD. Magnetic resonance imaging-targeted, 3D transrectal ultrasound-guided fusion biopsy for prostate cancer: Quantifying the impact of needle delivery error on diagnosis. Med Phys 2014;41(7):073504. [DOI] [PubMed] [Google Scholar]
- 21.Sparks R, Bloch BN, Feleppa E, et al. Multiattribute probabilistic prostate elastic registration (MAPPER): application to fusion of ultrasound and magnetic resonance imaging. Med Phys 2015;42(3):1153–1163. [DOI] [PMC free article] [PubMed] [Google Scholar]
- 22.Fedorov A, Khallaghi S, Sánchez CA, et al. Open-source image registration for MRI-TRUS fusion-guided prostate interventions. Int J CARS 2015;10(6):925–934. [DOI] [PMC free article] [PubMed] [Google Scholar]
- 23.Feinstein AR, Cicchetti DV. High agreement but low kappa: I. The problems of two paradoxes. J Clin Epidemiol 1990;43(6):543–549. [DOI] [PubMed] [Google Scholar]
- 24.Lantz CA, Nebenzahl E. Behavior and interpretation of the kappa statistic: resolution of the two paradoxes. J Clin Epidemiol 1996;49(4):431–434. [DOI] [PubMed] [Google Scholar]
- 25.Shankar V, Bangdiwala SI. Observer agreement paradoxes in 2x2 tables: comparison of agreement measures. BMC Med Res Methodol 2014;14:100. [DOI] [PMC free article] [PubMed] [Google Scholar]
- 26.Berg WA, D’Orsi CJ, Jackson VP, et al. Does training in the Breast Imaging Reporting and Data System (BI-RADS) improve biopsy recommendations or feature analysis agreement with experienced breast imagers at mammography? Radiology 2002;224(3):871–880. [DOI] [PubMed] [Google Scholar]
- 27.Lazarus E, Mainiero MB, Schepps B, Koelliker SL, Livingston LS. BI-RADS lexicon for US and mammography: interobserver variability and positive predictive value. Radiology 2006;239(2):385–391. [DOI] [PubMed] [Google Scholar]
- 28.Abdullah N, Mesurolle B, El-Khoury M, Kao E. Breast imaging reporting and data system lexicon for US: interobserver agreement for assessment of breast masses. Radiology 2009;252(3):665–672. [DOI] [PubMed] [Google Scholar]
- 29.Cheng SP, Lee JJ, Lin JL, Chuang SM, Chien MN, Liu CL. Characterization of thyroid nodules using the proposed thyroid imaging reporting and data system (TI-RADS). Head Neck 2013;35(4):541–547. [DOI] [PubMed] [Google Scholar]
- 30.Muller BG, Shih JH, Sankineni S, et al. Prostate cancer: interobserver agreement and accuracy with the revised prostate imaging reporting and data system at multiparametric MR imaging. Radiology 2015;277(3):741–750. [DOI] [PMC free article] [PubMed] [Google Scholar]
- 31.Renard-Penna R, Mozer P, Cornud F, et al. Prostate imaging reporting and data system and Likert scoring system: multiparametric MR imaging validation study to screen patients for initial biopsy. Radiology 2015;275(2):458–468. [DOI] [PubMed] [Google Scholar]
- 32.Vaché T, Bratan F, Mège-Lechevallier F, Roche S, Rabilloud M, Rouvière O. Characterization of prostate lesions as benign or malignant at multiparametric MR imaging: comparison of three scoring systems in patients treated with radical prostatectomy. Radiology 2014;272(2):446–455. [DOI] [PubMed] [Google Scholar]
- 33.Schimmöller L, Quentin M, Arsov C, et al. Inter-reader agreement of the ESUR score for prostate MRI using in-bore MRI-guided biopsies as the reference standard. Eur Radiol 2013;23(11):3185–3190. [DOI] [PubMed] [Google Scholar]
- 34.Akin O, Riedl CC, Ishill NM, Moskowitz CS, Zhang J, Hricak H. Interactive dedicated training curriculum improves accuracy in the interpretation of MR imaging of prostate cancer. Eur Radiol 2010;20(4):995–1002. [DOI] [PMC free article] [PubMed] [Google Scholar]
- 35.Garcia-Reyes K, Passoni NM, Palmeri ML, et al. Detection of prostate cancer with multiparametric MRI (mpMRI): effect of dedicated reader education on accuracy and confidence of index and anterior cancer diagnosis. Abdom Imaging 2015;40(1):134–142. [DOI] [PMC free article] [PubMed] [Google Scholar]
- 36.Rosenkrantz AB, Lim RP, Haghighi M, Somberg MB, Babb JS, Taneja SS. Comparison of interreader reproducibility of the prostate imaging reporting and data system and likert scales for evaluation of multiparametric prostate MRI. AJR Am J Roentgenol 2013;201(4):W612–W618. [DOI] [PubMed] [Google Scholar]
- 37.Mendhiratta N, Meng X, Taneja SS. Using multiparametric MRI to ‘personalize’ biopsy for men. Curr Opin Urol 2015;25(6):498–503. [DOI] [PubMed] [Google Scholar]
Associated Data
This section collects any data citations, data availability statements, or supplementary materials included in this article.