ABSTRACT
Purpose
To evaluate the reliability and validity of the 15-item Visual, Musculoskeletal, and Balance Complaints Questionnaire (VMB) for people with visual impairments, using confirmatory factor analysis (CFA) and with Rasch analysis for use as an outcome measure.
Methods
Two studies evaluated the VMB. In Study 1, VMB data were collected from 1249 out of 3063 individuals between 18 and 104 years old who were registered at a low vision center. CFA evaluated VMB factor structure and Rasch analysis evaluated VMB scale properties. In Study 2, a subsample of 52 individuals between 27 and 67 years old with visual impairments underwent further measurements. Visual clinical assessments, neck/scapular pain, and balance assessments were collected to evaluate the convergent validity of the VMB (i.e. the domain relationship with other, theoretically predicted measures).
Results
CFA supported the a priori three-factor structure of the VMB. The factor loadings of the items on their respective domains were all statistically significant. Rasch analysis indicated disordered categories and the original 10-point scale was subsequently replaced with a 5-point scale. Each VMB domain fitted the Rasch model, showing good metric properties, including unidimensionality (explained variances ≥66% and eigenvalues <1.9), person separation (1.86 to 2.29), reliability (0.87 to 0.94), item fit (infit MnSq’s >0.72 and outfit MnSq’s <1.47), targeting (0.30 to 0.50 logits), and insignificant differential item functioning (all DIFs but one <0.50 logits) from gender, age, and visual status. The three VMB domains correlated significantly with relevant visual, musculoskeletal, and balance assessments, demonstrating adequate convergent validity of the VMB.
Conclusions
The VMB is a simple, inexpensive, and quick yet reliable and valid way to screen and evaluate concurrent visual, musculoskeletal, and balance complaints, with contribution to epidemiological and intervention research and potential clinical implications for the field of health services and low vision rehabilitation.
Key Words: visual complaints, musculoskeletal complaints, balance complaints, reliability, validity, confirmatory factor analysis, Rasch analysis, ergonomy
Visual impairment is a major health issue,1 and people with visual impairments are at higher risk for visually related complaints, pain in the neck/scapular area, poor postural control, and accompanying fear of moving and risk for falls compared to people with normal vision.2–5 These problems may limit participation in work, leisure, and social activities, which can result in increased isolation and decreased quality of life. In addition, the costs of these problems to the individuals, as well as to the health services and social insurance providers, are substantial.6 The prevalence of these problems has clinical implications, such as management and treatment of people with visual impairments, often requiring highly specialized services. Consequently, it is important to develop and improve treatment and prevention programs aimed at reducing these problems. In this endeavor, high quality screening instruments are a prerequisite for successful research and clinical practice.7–9
Studies report effects of vision on neck/scapular muscle activity10,11 and prehension12 as well as on postural sway,13 demonstrating the importance of vision on the musculoskeletal and balance systems. Furthermore, distant and near visual impairments are found to be independently associated with poor quality of life (QoL), with poorer QoL for near vision activities (e.g. reading) than distant vision activities (e.g. mobility) among those with severe visual impairments.14 During near visual activities, accommodation/vergence overload may adversely impact on trapezius muscle activity.15,16 Deficient near work may also contribute to non-neutral and/or static work postures. These and other mechanisms give rise to an unfavorable load on the eye-neck/scapular area muscles, which over time may result in musculoskeletal discomfort and pain.17 Consequently, a focus on near visual activities in studying visual, musculoskeletal, and balance complaints is highly warranted.
A variety of self-report questionnaires directed at the functional level in the visual, musculoskeletal, and balance areas are available. Among the most notable is the National Eye Institute Visual Functioning Questionnaire 25 (VFQ-25)18 in the visual area, the Neck Disability Index (NDI)19 in the neck/scapular area, and the Activities-specific Balance Confidence (ABC) scale20 in the balance area. However, psychometrically evaluated questionnaires measuring the complaints per se that people with visual impairment experience in these areas are few. In the area of visual complaints, the questionnaires are predominantly directed at dry eye21 or sets of diverse eye symptoms.22,23
With regard to musculoskeletal and balance complaints, there is as yet no psychometrically evaluated questionnaire specifically developed for the visually impaired. Most importantly, there is no questionnaire measuring these complaints in a similar way (i.e. similar in terms of wording, number of items, and response scale) that is sufficiently short for people with low vision to complete, and consequently suitable for large-scale screening and epidemiological studies. Therefore, the aim of the present study was to evaluate the reliability and validity of a newly developed instrument, the Visual, Musculoskeletal, and Balance Complaints Questionnaire (VMB) for people with visual impairments.
The VMB was developed from clinical practice in consultation with patients and a review of the literature on visual and musculoskeletal complaints during near work and the relationship between visuomotor coordination and balance. Items were refined after patient and expert reviews to achieve face validity. From a pool of items, 15 were deemed representative by the research group and were tested on patients with age-related macular degeneration.24 Principal component analysis (PCA) resulted in a three-factor solution comprising visual, musculoskeletal, and balance complaints. All three domains showed adequate internal consistency; Cronbach’s alpha varied between 0.81 and 0.88. However, subsequent exploratory factor analysis (EFA) showed that some of the items designed to measure balance cross-loaded on other domains. These items were replaced with new ones in the revised version.
Rather than an exploratory approach, as used in the previous study,24 the present study validated the revised VMB using a confirmatory process following the notion that unless the instruments can be converted to interval scales, the summing of patient ratings does not yield true measurements.7 The main objectives of this study were, therefore, to (1) assess the dimensions of the 15-item VMB using confirmatory factor analysis (CFA) and Rasch analysis to validate the factors of the best-fitting model as viable traits for measuring visual, musculoskeletal, and balance complaints in people with visual impairments, and (2) evaluate the VMB domain relationships with other theoretically predicted measures. The evaluation was conducted in two studies. In Study 1, the VMB was distributed to all individuals with visual impairments in a geographical region. In Study 2, a sample of individuals with visual impairments underwent visual function, neck/scapular pain, and balance assessments. In the following, the two studies are presented separately, followed by a concluding discussion.
STUDY 1—CONSTRUCT VALIDITY, RELIABILITY, AND SCALE PROPERTIES OF THE VISUAL, MUSCULOSKELETAL, AND BALANCE COMPLAINTS QUESTIONNAIRE METHODS
Target Population
All individuals ≥18 years of age who were registered at the Low Vision Center at Örebro County Council and lived in the county of Örebro in Sweden were sent an invitation to participate in the study. Altogether, 3063 individuals between 18 and 104 years old were registered at the center. This is approximately 1.4% of the population in Örebro County in this age range.
The study adhered to the tenets of the Declaration of Helsinki and was approved by the Regional Ethics Review Board in Uppsala, Sweden.
Measures
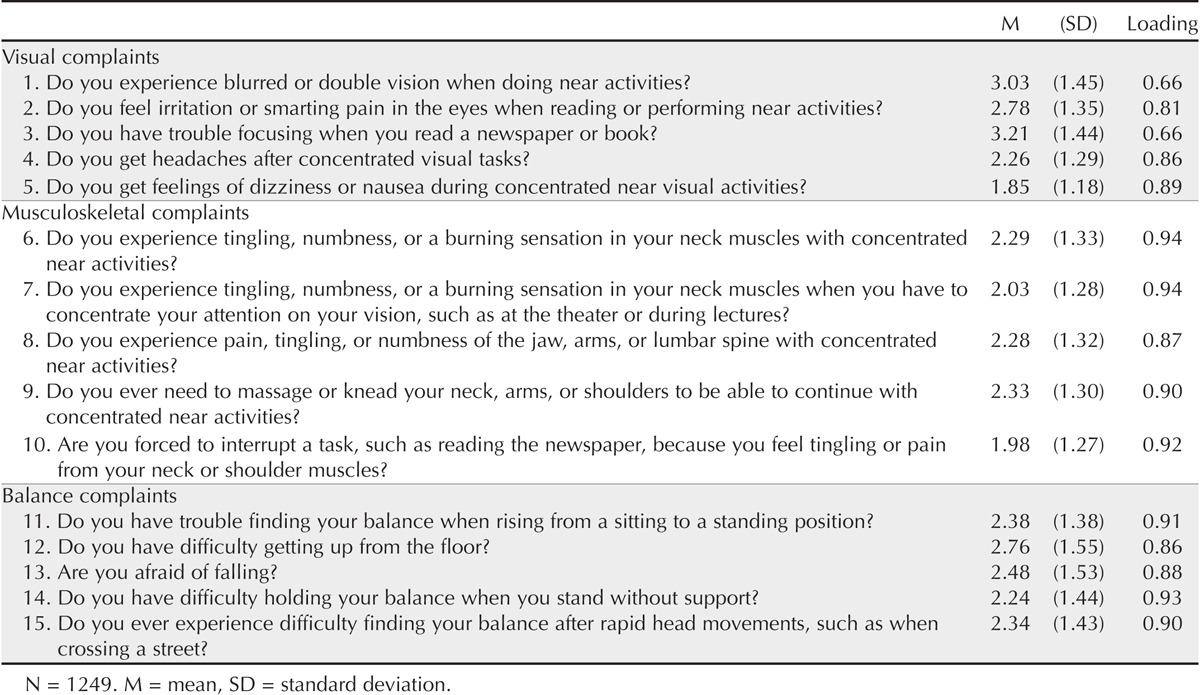
The VMB consists of 15 items, with 5 questions each for the visual (VMB-V), musculoskeletal (VMB-M), and balance (VMB-B) complaint domains. Items are rated on Likert-type scales from 1 (“no problem at all”) to 10 (“always a problem”). The original Swedish version was used in this study. The Swedish version was translated into English by a professional translator and then back translated into Swedish independently by two other professional translators. The translations were compared and the few differences that emerged consisted mainly of synonymous words or different sentence structure. Hence, the English translation, shown in Table 1, was deemed adequate.
TABLE 1.
Summary statistics of confirmatory factor analysis (CFA) of the Visual, Musculoskeletal, and Balance Complaints Questionnaire (VMB)
Procedures
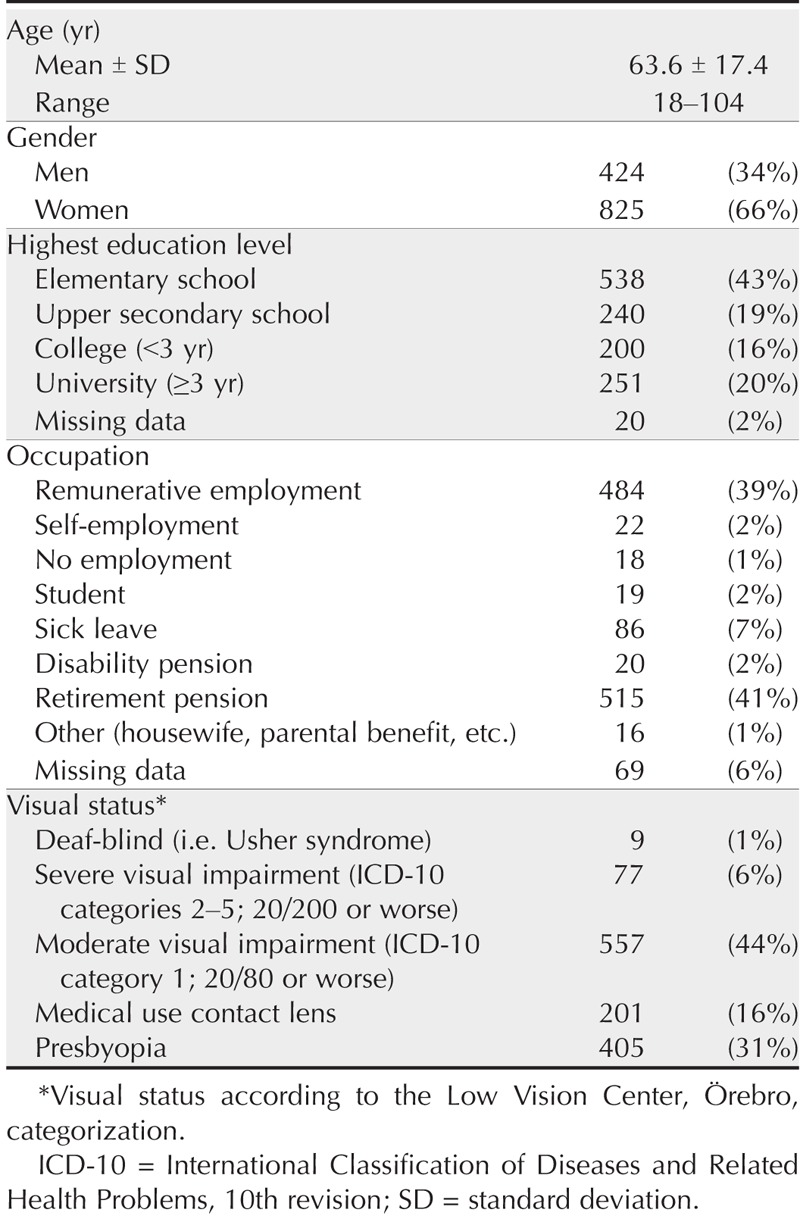
Among the 3063 registered individuals at the Low Vision Center, 1467 (47.9%) agreed to participate in Study 1. The VMB was sent to the participants’ home addresses and subsequently returned by mail. Of the 1467 returned questionnaires, 1143 had no missing items. For 106 who had a maximum of one missing item per subscale, we imputed missing data (see below). The remaining 218 questionnaires, with more than one missing item per subscale, were deleted from the analysis. The final sample consisted of 1249 individuals between 18 and 104 years old (424 men [M = 63.4 years, SD = 18.07] and 825 women [M = 63.8 years, SD = 17.07]). The proportion of men/women in the final sample was similar to that in the total population (χ2 = 1.7, p > 0.20). The proportion of those older than 80 years in the final sample, however, was lower compared to that in the total population (29 and 37%, respectively; χ2 = 89.45, p < 0.001). Characteristics of the study group are shown in Table 2.
TABLE 2.
Study 1 sample characteristics (N = 1249)
Data and Statistical Analysis
Before the analysis, imputation was performed by replacing missing data points with the participants’ mean item value for the subscale concerned. Descriptive statistics were conducted using SPSS 21 (SPSS Inc., Chicago, IL, USA).
Confirmatory factor analysis tested the tenability of the a priori three-factor structure model of the VMB. Items 1 to 5, items 6 to 10, and items 11 to 15 were assumed to represent visual, musculoskeletal, and balance complaints, respectively. The CFA was conducted using LISREL 8.8.25 As data were ordinal, weighted least squares were used on the asymptotic covariance matrices and the polychoric and polyserial correlation matrix, which were obtained using the PRELIS program.26 The adequacy of the models was evaluated using the Satorra-Bentler scaled chi-squared test in addition to the comparative fit index (CFI), the standardized root mean square residual (SRMR), and the root mean square of approximation (RMSEA). Values equal to, or greater than, 0.90 and 0.95 for the CFI, and equal to, or lower than, 0.10 and 0.08 for the SRMR, and lower than 0.08 and 0.05 for the RMSEA constituted an adequate and excellent level of goodness of fit, respectively.27–29
The polytomous Rasch rating scale model30 with Winsteps 3.81.031 was used to test each of the VMB domains. Rasch analysis has been explained in detail elsewhere.32 Briefly, Rasch analysis converts rank-ordered data into interval logit measures and generates item measures that represent the item difficulties, and person measures that represent the person abilities. The analysis enables identification of items that may be misunderstood or used in unintended ways. The model started with calibrating person measures and item measures. A person measure represents the degree of visual, musculoskeletal, or balance discomfort any person may perceive. An item measure represents the degree of discomfort any item may measure. Equivalence across gender (men/women), age (<80 years/≥80 years), and visual impairment (deaf-blind/severe visual impairment/moderate visual impairment/medical use contact lens/presbyopia) was tested using differential item functioning (DIF). The quality of the VMB was evaluated using the criteria recommended for assessment of ophthalmic questionnaires.8
RESULTS
Descriptive
Of the 1249 participants, 768 (61.5%) reported complaints in all three subscales. In the VMB-V, 1153 (92.3%) individuals reported some complaints; in the VMB-M, 905 (72.5%) individuals reported some complaints; and in the VMB-B, 1018 (81.5%) individuals reported some complaints. Only 43 (3.4%) individuals reported no complaints at all.
Factor Structure of the Visual, Musculoskeletal, and Balance Complaints Questionnaire
The CFA of the a priori model showed a significant chi-square value (S-B χ2 = 1009.73, df = 87, p < 0.001), a CFI = 0.98, an RMSEA = 0.092 (95% CI = 0.087–0.097), and an SRMR = 0.070, indicating an excellent goodness of fit, except for the S-B χ2 and the RMSEA result. Inspection of the modification indices indicated a large error covariance among items 1 and 3 in the visual complaints subscale. It should be noted that correlated error variance terms are common in empirical research; however, there remains controversy in the CFA literature regarding interpretability and cause. For example, Bentler and Chou33 commented that model specification, which forces all error terms to be uncorrelated, is rarely appropriate with real data. Hence, incorporation of these correlated error terms into CFA models does not weaken the factorial validity. Rather, it provides a more realistic factorial representation of the observed data structure. Consequently, a reanalysis of a revised model, including correlating errors between items 1 and 3, was performed. This resulted in a significant chi-square value (χ2 = 677.67, df = 86, p < 0.001), a CFI = 0.99, an RMSEA = 0.074 (95% CI = 0.069–0.079), and an SRMR = 0.068. Hence, with only 1 degree of freedom less compared to the initial model, the revised model was a significant improvement; the chi-square decreased by 33% and all other indices showed excellent fit except RMSEA, which showed an adequate fit. Consequently, the revised three-factor model was regarded as an adequate representation of the factor structure of the VMB.
Rasch Analysis
The Rasch analysis was first performed on all 15 items of the VMB. The data converged with the Rasch model in a few iterations and, as expected, the PCA of the residuals suggested that a unidimensional solution would be inappropriate for the data. The PCA of the residuals showed a variance explained by the measures of 55.7% and an eigenvalue of the first contrast of 4.1. Therefore, the result supported the CFA and, consequently, the three domains of VMB were analyzed separately.
All categories of all items were selected by at least 10 persons. Each item within each VMB domain fulfilled the criteria of the rating scale, except that some thresholds were disordered, although average measures for all items increased monotonically. Hence, respondents were somewhat unable to reliably discriminate between the different levels of response options, which was not unexpected given the 10-point response scale. We therefore evaluated the threshold locations and identified the response categories that were not behaving as expected. We collapsed two or more of the offending categories as appropriate and reevaluated the model fit. Tests of 3- and 4-point scales showed larger threshold differences but worse measurement precision, item fit, and targeting compared to a 5-point scale. The 5-point scale structure was deemed to be an optimal solution and appropriate for the VMB domains although some of the threshold differences were below the recommended logit of 1 for 5-point scales.34 Therefore, scoring option 1 was left unchanged. Options 2 and 3 were collapsed into 2; options 4, 5, and 6 into 3; and options 7, 8, and 9 into 4. Option 10 was recoded into 5.
The reanalysis of the recoded VMB showed threshold differences (1 vs. 2, 2 vs. 3, and 3 vs. 4) of 0.90, 0.72, and 1.70 for VMB-V; 1.40, 1.35, and 3.70 for VMB-M; and 1.22, 0.77, and 1.31 for VMB-B. The probability curves of the VMB domains are shown in Figs. 1 to 3. The PCA of the residuals showed a variance explained by the measures and an eigenvalue of the first contrast of 66.2% and 1.9 for VMB-V, 68.6% and 1.6 for VMB-M, and 67.3% and 1.6 for the VMB-B, respectively, demonstrating that each subscale was unidimensional.
FIGURE 1.
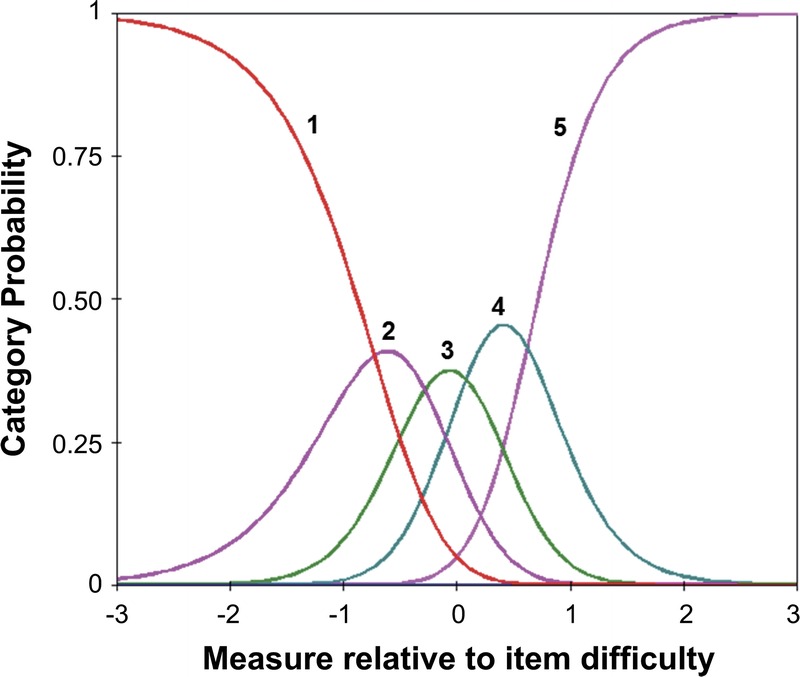
Category probability curves of five response categories for the visual complaints domain of the VMB.
FIGURE 3.
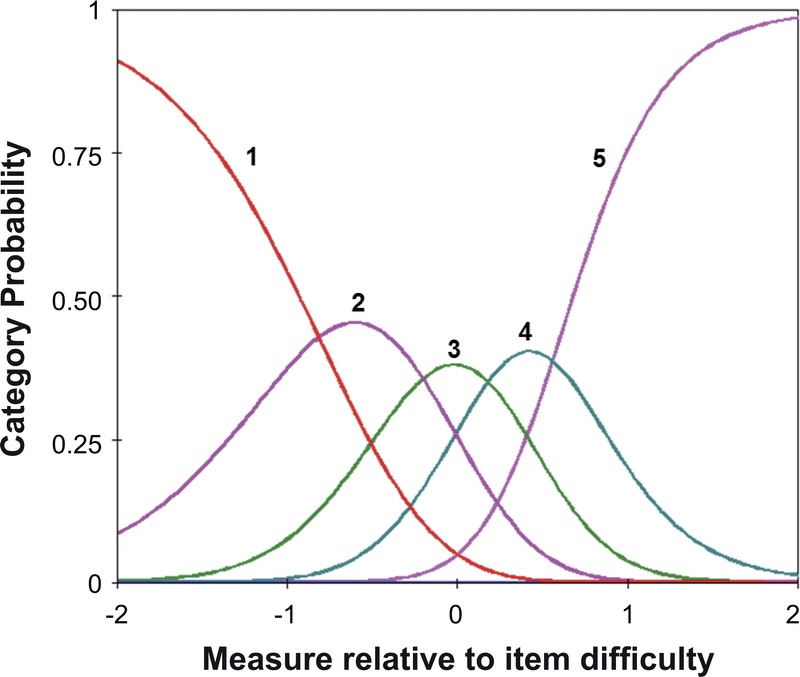
Category probability curves of five response categories for the balance complaints domain of the VMB.
FIGURE 2.
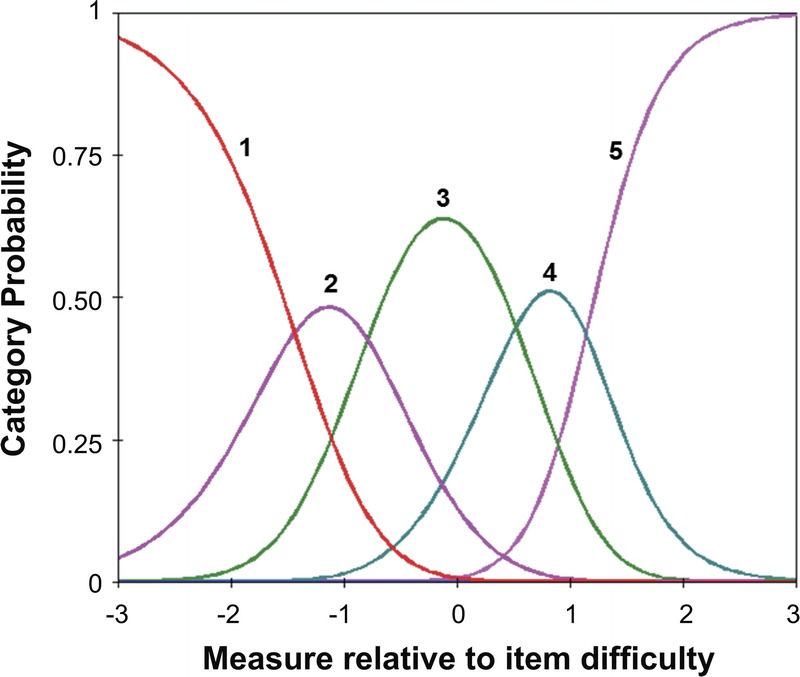
Category probability curves of five response categories for the musculoskeletal, complaints domain of the VMB.
Person separation indices and α reliability were 1.86 and 0.87 for the VMB-V, −2.29 and 0.94 for the VMB-M, and 2.04 and 0.93 for the VMB-B domain. All item infit mean square (MnSq) and outfit MnSq values were within the prescribed 0.50 to 1.50 range. The infit MnSq values for the VMB-V, VMB-M, and VMB-B varied between 0.75 and 1.30, 0.72 and 1.47, and 0.77 and 1.31, respectively. The corresponding outfit MnSq values varied between 0.82 and 1.22, 0.83 and 1.43, and 0.81 and 1.22, respectively.
The items were relatively closely grouped, with few gaps. The item distribution of each domain was relatively well balanced around the mean. The targeting was within the recommended ±1 logit range (8) for all items in all VMB domains. The targeting was −0.25 logits, −0.57 logits, and −0.30 logits for the VMB-V, VMB-M, and VMB-B, respectively. Person-item maps are shown in Figs. 4 to 6.
FIGURE 4.

Person-item map for the visual domain in the VMB instrument.
FIGURE 6.

Person-item map for the balance domain in the VMB instrument.
FIGURE 5.

Person-item map for the musculoskeletal domain in the VMB instrument.
The three VMB domains showed no DIF (<0.5 logits) from sex, age, or visibility status, except for a minimal DIF in that participants with severe visual impairment rated the VMB-M item 4, “Do you ever need to massage or knead your neck, arms, or shoulders to be able to continue with concentrated near activities?,” 0.55 logits easier relative to other VMB-M items, compared to those with presbyopia. Hence, by all practical means, the VMB items function the same way across sex, age, and visual status.
Test–Retest Reliability of the Visual, Musculoskeletal, and Balance Complaints Questionnaire
Forty-two of the participants were retested and the results demonstrated adequate test–retest reliability of the VMB-V, VMB-M, and VMB-B, as indicated by an intraclass correlation coefficient (ICC) of 0.85 (95% CI = 0.78–0.91), 0.84 (95% CI = 0.87–0.95), and 0.87 (95% CI = 0.81–0.92), respectively.
STUDY 2—CONVERGENT VALIDITY OF THE VISUAL, MUSCULOSKELETAL, AND BALANCE COMPLAINTS QUESTIONNAIRE METHODS
Participants
Fifty-two patients (10 men and 42 women) with a mean age of 52.9 years (SD = 10.4) and a body mass index (BMI) ranging from 19.6 to 38.6 (M = 25.9, SD = 3.85) participated in the study. They were recruited among patients who were registered at the Low Vision Center at the Örebro County Council, Örebro, Sweden. Each participant had one to four (Md = 3) different ophthalmic diagnoses. The most prevalent (>10%) were presbyopia (N = 22), myopia (N = 9), retinopathy (N = 9), cataract (N = 7), keratoconus (N = 6), and optic atrophy (N = 5). None of the participants had binocular blindness, whereas nine had monocular blindness (i.e. worse than 20/2000 on one eye). Best-corrected visual acuity ranged from 20/2000 to 20/12.5. All but one participant were right handed.
The study adhered to the tenets of the Declaration of Helsinki. All participants provided written informed consent. The study was approved by the Regional Ethics Review Board in Uppsala.
Measurement and Procedure
Visual, Musculoskeletal, and Balance Complaints
Given the results of Study 1, the VMB questionnaire was regarded as an adequate measure of visual, musculoskeletal, and balance complaints in people with visual impairments. Mean logits based on the 5-point scale was used in Study 2.
Visual Assessments
Visual clinical assessments: Visual acuity was assessed under normal luminance by an optometrist using an illuminated Early Treatment of Diabetic Retinopathy Study (ETDRS) chart or the four-letter Low Vision Acuity Chart (Lågvisustavlan)35 with Hedin and Olsson36 optotypes for those with a visual acuity worse than 20/400. Best-corrected visual acuity was converted to the logarithm of the minimum angle of resolution (logMAR). In addition, preferred reading distance (cm) using best correction and minimal readable font size (pt), as used in previous research,24 was recorded. Minimal readable font size was ln transformed due to a large right-skewed distribution.
Visual function: We used the National Eye Institute’s Visual Function Questionnaire-Near Activities Subscale (NEI-VFQ-NAS) to assess the participants’ self-rated visual quality.18 The NEI-VFQ-NAS is a valid and reliable tool for assessing visual function37–39 consisting of six items dealing with near activities. Each item is rated on a 5-point scale from 0 to 100 in equal steps (i.e. 0, 25, 50, 75, and 100). The mean scores from the six items were used to represent a total near activity score. In addition, there is a sixth alternative to mark if the item is not relevant. This alternative does not contribute to the total score.
Musculoskeletal Pain Assessments
The Neck Disability Index (NDI)19 is a 10-item, condition-specific, self-report measure that pertains to pain intensity, personal care, lifting, reading, headaches, concentration, work, driving, sleeping, and recreation, with the aim of illustrating the impact on the activities of daily living and social life. Due to the participants’ visual impairments, items concerning driving a car were provided with an additional alternative: “not applicable.” Each item is rated on a 6-point scale (0–5); thus, total NDI scores can vary from 0 to 50.
The SF-36 Bodily Pain Scale (SF36-BPS) is based on two pain related items in the SF-3640 with a score range of 0 to 100. Higher scores represent greater functionality and wellbeing; therefore, higher scores represent less severe and debilitating pain. Previous research on the SF36-BPS showed good reliability in the general population in the USA41 and Sweden.42
Perceived pain intensity was measured using a visual analog scale (VAS)43 where 0 = no pain and 100 = unbearable pain. The pain measurements were taken during palpation of the left and right occipital muscle, trapezius muscle, and levator scapulae muscle locations performed by a trained physiotherapist who was blinded to the participants’ self-reported pain symptoms (i.e. VMB, SF-36, and NDI). Test–retest reliability of the VAS score in 46 of the present participants, who were retested on a later occasion, was excellent, as indicated by an ICC of 0.92 (95% CI = 0.87–0.95).
Balance Assessments
Postural sway. Center of pressure (COP) path length (mm) was measured using a Wii Balance Board (WBB) (Nintendo, Kyoto, Japan) interfaced with a laptop computer using custom-written software. The WBB exhibited high concurrent validity for COP assessment with laboratory grade force platforms.44 Participants were tested while standing with eyes open. The task was performed by participants for 3 minutes with their feet together, placed at the center of the WBB and arms crossed over the chest. Because the trials were registered for a fixed time interval, the path length parameter is analogous to average COP velocity.45
Functional balance assessments: Five functional balance tasks were chosen based on their varying difficulty and common use in clinical practice. All tasks were performed with eyes open.
The 10 meter timed walk test (10MTWT):46 The average time, number of steps, and number of steps outside the line were recorded while participants walked on a 10-m-long and 5-cm-wide strip placed on the floor, trying to place each step on the strip, and when reaching the end, turned around and walked back to the starting point.
Timed Up and Go (TUG):47 The participants were timed while rising from an armchair, walking 3 m, turning, walking back, and sitting down again.
One Limb Standing Test (OLST):48 The time standing on the left and right leg, respectively, for up to 30 seconds was recorded.
Timed Lying Down and Rising (TLDR): The participants lay down in a supine position on a mattress and rose to a standing position. The time from lying down to standing up was recorded.
Functional Reach (FR):49 Participants reached forward with their hands and arms extended, parallel to a yardstick mounted on the wall at shoulder height. They were instructed to “reach as far as you can without taking a step.” The difference (cm) between the starting and end position was recorded.
Statistical Analyses
Descriptive statistics were conducted using the statistical software package SPSS 21 (SPSS Inc., Chicago, IL, USA). To examine convergent validity, the relationship between the VMB domain subscales and each of the visual, musculoskeletal pain, and balance assessments was analyzed. Univariate association of variables was tested by Pearson correlation coefficients (r). The level of significance was 0.05.
RESULTS
Visual Complaints
The mean score of the VMB-V correlated with visual clinical assessment data and VFQ-NAS (Table 3). Greater visual acuity loss (monocular and binocular) and more difficulties performing near visual activities resulted in greater visual complaints.
TABLE 3.
Descriptive visual assessment statistics and their correlation with the Visual, Musculoskeletal, and Balance Complaints Questionnaire (VMB), visual complaints subscale (VMB-V)

Musculoskeletal Complaints
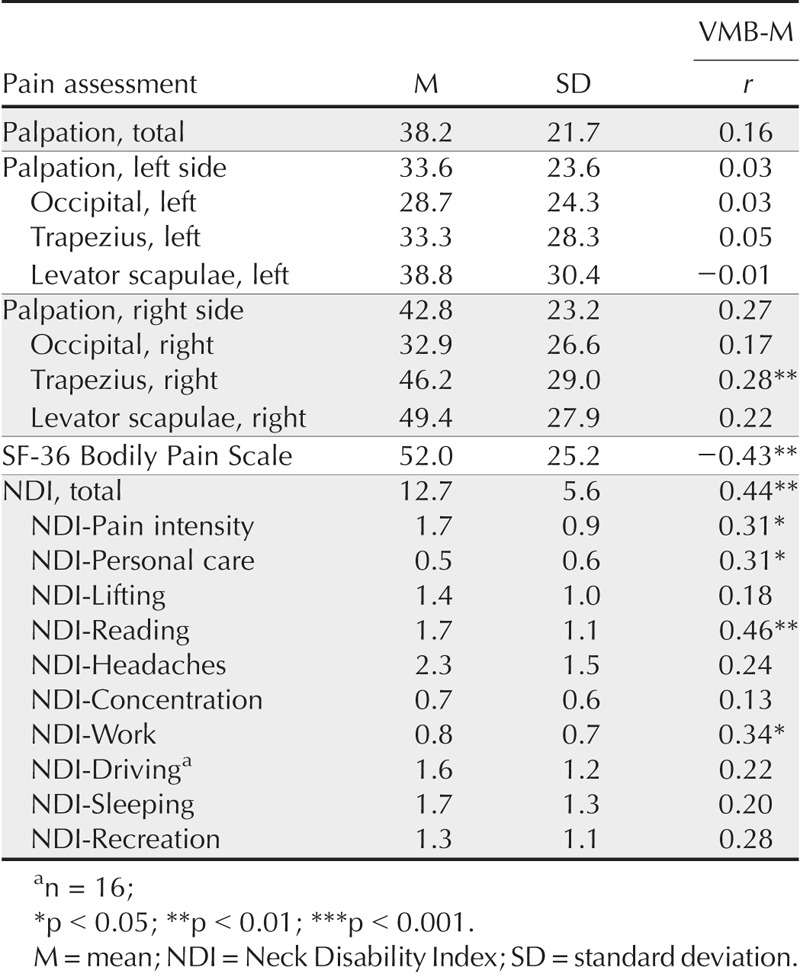
The mean scores of the VMB-M correlated with perceived pain during palpation of muscular areas on the right, but not the left, side (Table 4). The correlation was most pronounced at the trapezius area and to some extent at the levator scapulae, but least in the occipital area. It should be noted that all but one participant were right handed. Moreover, VMB-M correlated with the SF36-BPS and the NDI. Hence, the greater the VMB-M score, the more pain was perceived during palpation of muscles in the neck/scapular area, the lower the SF36-BPS scores (i.e. indicating more pain), and the greater the scores on the NDI (i.e. indicating more pain).
TABLE 4.
Descriptive pain assessment statistics and their correlation with the Visual, Musculoskeletal, and Balance Complaints Questionnaire (VMB), musculoskeletal complaint subscale (VMB-M)
To compare the VMB-M ability to predict palpated pain to the ability of the SF36-BPS and NDI, additional correlation analyses on these variables were performed. There were no significant correlations between the SF36-BPS and palpated pain for any of the muscles (r varied from −0.23 to −0.03, all p-values >0.10). Total NDI (r = 0.38, p = 0.014), as well as specific NDI items, such as NDI-Recreation (r = 0.40, p = 0.011), NDI-Concentration (r = 0.37, p = 0.017), and NDI-Reading (r = 0.36, p = 0.024), correlated with level of pain from the right occipital area. Surprisingly, the NDI-Work item correlated negatively with level of pain from the left levator scapulae area (r = −0.33, p = 0.036), indicating that the less pain the participants perceived from the levator scapulae area, the more the ability to work was affected by pain. There were no significant correlations between any of the NDI items and perceived pain at palpation of the trapezius areas.
Balance Complaints
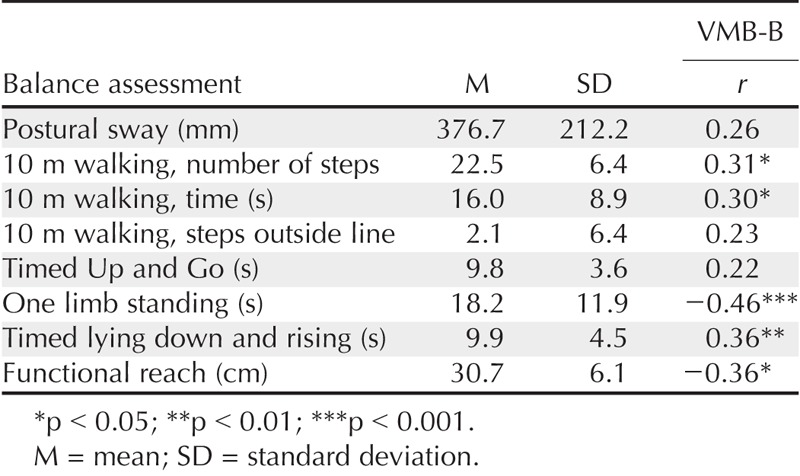
The mean VMB-B correlated significantly with most static and dynamic balance assessment parameters (Table 5). The greater the number of steps and time walking 10 meters, the time to perform TLDR, shorter functional reach, and shorter time in one limb standing, the greater the reported VMB-B were reported.
TABLE 5.
Descriptive static and dynamic balance assessment statistics and their correlation with the Visual, Musculoskeletal, and Balance Complaints Questionnaire (VMB), balance complaints subscale (VMB-B)
DISCUSSION
The VMB has been designed to capture visual, musculoskeletal, and balance complaints relevant to individuals with visual impairments. Using CFA, the results strongly supported the a priori proposed three-factor structure of the VMB. The Rasch analysis provided further evidence that the VMB questionnaire is a reliable measure and that the three domains possess viable measurement characteristics to assess specific aspects of visual, musculoskeletal, and balance complaints for people with visual impairments. The three VMB domains correlated moderately to highly with relevant visual, musculoskeletal, and balance assessments, demonstrating adequate concurrent and convergent validity of the VMB.
In our initial study,24 we used exploratory methods whereas the present study used a confirmatory approach and a much larger sample. It is likely that the larger sample provided a better capacity to perform a CFA, as small datasets do tend to generalize less well. A case to item ratio of 5:1 is regarded adequate.50 In the current study, the ratio was 83:1 compared to the 3:1 in the original study.24 The use of Rasch analysis in the present study enabled a detailed examination of the operation of each VMB domain, corresponding with the notion that Rasch analysis is an important tool in instrument development in vision science.51 With regard to criteria recommended for assessment of ophthalmic questionnaires,8,9 the VMB met the highest dimensionality requirements, measurement precision (reliability), item fit, DIF, and targeting. The only criterion not met was the low person separation (<2.0) found for the VMB-V. This implies that the VMB-V may be less sensitive in distinguishing more than two groups, i.e. those perceiving high and low degree of visual complaints, and that more items may be needed,52 although a longer questionnaire would be less desirable for people with large impairments. Alternatively, person separation could probably be improved by changing some of the items to more difficult and easier ones.34
In Study 2, all VMB domains showed good concurrent and convergent validity. The VMB-V subscale was related to visual acuity and near visual activities including a moderate relationship with the VFQ-NAS total score. This was expected, considering both questionnaires concern everyday activities. However, the VFQ-NAS addresses the impact on vision-related functioning, whereas the VMB-V addresses the experiential aspects (i.e. expressed as complaints) of having impaired visual function, indicating that the VMB-V subscale captures aspects not addressed by the VFQ-NAS.
The VMB-M and NDI showed a similar magnitude of correlation with palpated pain, but in different muscular areas. An unexpected negative correlation between the NDI-Work item and pain from the left levator scapulae area was observed, which may indicate some problem with this NDI item in the current sample or just be an effect of chance alone. Further research may shed some light on this inconsistency in the NDI. Apart from that, the result is consistent with the fact that the NDI specifically addresses complaints in the neck area, whereas the VMB-M addresses complaints in the scapular area as well. This suggests that the VMB-M is in level with the NDI regarding convergent validity. Despite distinct positive correlations between the VMB-M and the SF36-BPS, the latter did not significantly correlate with palpated pain.
The VMB-B showed moderate correlations with both static and dynamic balance assessments (moderate correlations being typically observed correlation magnitudes among balance assessments),53 in line with those observed for the VMB-V and VMB-M and their corresponding validity scales.
Overall, expressions of complaints may not solely be a direct consequence of low functional ability. Other factors, such as personality, physical and mental health, and socioeconomic factors, can mediate or moderate the relationship. The present study was not aimed to investigate this, but the VMB is highly suitable to be used in such studies both epidemiologically and clinically.
The test–retest reliability was adequate, demonstrating stability of the measure. With regard to VMB factor structure evaluation, an error covariance was observed, which was likely due to similarity of wording. Even if error covariance is expected in empirical research,33 replacing one of the questions should be considered in future revisions.
Despite the strength of using a total population approach, some limitations in data collection should be noted. The proportion of participants older than 80 was lower than expected based on their distribution in the study population. Although a telephone interview was an option, many among the very old had pronounced hearing or cognitive problems (e.g. dementia) and were unable to complete the VMB. Hence, invitees with the largest impairments could not complete the questionnaire. However, there was no DIF between those older and younger than 80 years, suggesting a negligible age-related attrition bias in the measurement of visual, musculoskeletal, and balance complaints.
In conclusion, the VMB is a simple, inexpensive, and quick yet highly reliable and valid way to screen and evaluate visual, musculoskeletal, and balance complaints in people with visual impairments. The VMB is suitable for large-scale assessments in epidemiological research as well as in clinical situations, thus potentially contributing to health care improvement in the field of health services and low vision rehabilitation.
Lars-Olov Lundqvist
University Health Care Research Center
Box 1613
SE-701 16 Örebro
Sweden
e-mail: lars-olov.lundqvist@regionorebrolan.se
ACKNOWLEDGMENTS
This study was supported by grants to Lars-Olov Lundqvist from the REHSAM Research Program at the Swedish Social Insurance Agency, #99368-2009/RS11, and by grants to Hans O. Richter from the Swedish Council for Working Life & Social Research, grant 2009-1761.
The authors would like to thank physiotherapist Abraham Bilge for collecting data and research engineer Nils-Göran Larson for Matlab and engineering assistance.
Disclosure: Lars-Olov Lundqvist, none; Hans O. Richter, none; and Christina Zetterlund, none.
REFERENCES
- 1.Pascolini D, Mariotti SP. Global estimates of visual impairment: 2010. Br J Ophthalmol 2012;96:614–8. [DOI] [PubMed] [Google Scholar]
- 2.Schwesig R, Goldich Y, Hahn A, Müller A, Kohen-Raz R, Kluttig A, Morad Y. Postural control in subjects with visual impairment. Eur J Ophthalmol 2011;21:303–9. [DOI] [PubMed] [Google Scholar]
- 3.Legood R, Scuffham P, Cryer C. Are we blind to injuries in the visually impaired? A review of the literature. Inj Prev 2002;8:155–60. [DOI] [PMC free article] [PubMed] [Google Scholar]
- 4.Gordon GE, Chronicle EP, Rolan P. Why do we still not know whether refractive error causes headaches? Towards a framework for evidence based practice. Ophthalmic Physiol Opt 2001;21:45–50. [PubMed] [Google Scholar]
- 5.Ray CT, Horvat M, Croce R, Mason RC, Wolf SL. The impact of vision loss on postural stability and balance strategies in individuals with profound vision loss. Gait Posture 2008;28:58–61. [DOI] [PubMed] [Google Scholar]
- 6.Köberlein J, Beifus K, Schaffert C, Finger RP. The economic burden of visual impairment and blindness: a systematic review. BMJ Open 2013;3:e003471. [DOI] [PMC free article] [PubMed] [Google Scholar]
- 7.Massof RW, Rubin GS. Visual function assessment questionnaires. Surv Ophthalmol 2001;45:531–48. [DOI] [PubMed] [Google Scholar]
- 8.Khadka J, McAlinden C, Pesudovs K. Quality assessment of ophthalmic questionnaires: review and recommendations. Optom Vis Sci 2013;90:720–44. [DOI] [PubMed] [Google Scholar]
- 9.Pesudovs K, Burr JM, Harley C, Elliott DB. The development, assessment, and selection of questionnaires. Optom Vis Sci 2007;84:663–74. [DOI] [PubMed] [Google Scholar]
- 10.Richter HO, Zetterlund C, Lundqvist LO. Eye-neck interactions triggered by visually deficient computer work. Work 2011;39:67–78. [DOI] [PubMed] [Google Scholar]
- 11.Zetterberg C, Forsman M, Richter HO. Effects of visually demanding near work on trapezius muscle activity. J Electromyogr Kinesiol 2013;23:1190–8. [DOI] [PubMed] [Google Scholar]
- 12.Grant S, Melmoth DR, Morgan MJ, Finlay AL. Prehension deficits in amblyopia. Invest Ophthalmol Vis Sci 2007;48:1139–48. [DOI] [PubMed] [Google Scholar]
- 13.Black AA, Wood JM, Lovie-Kitchin JE, Newman BM. Visual impairment and postural sway among older adults with glaucoma. Optom Vis Sci 2008;85:489–97. [DOI] [PubMed] [Google Scholar]
- 14.Lamoureux EL, Fenwick E, Moore K, Klaic M, Borschmann K, Hill K. Impact of the severity of distance and near-vision impairment on depression and vision-specific quality of life in older people living in residential care. Invest Ophthalmol Vis Sci 2009;50:4103–9. [DOI] [PubMed] [Google Scholar]
- 15.Richter HO, Bänziger T, Forsman M. Eye-lens accommodation load and static trapezius muscle activity. Eur J Appl Physiol 2011;111:29–36. [DOI] [PubMed] [Google Scholar]
- 16.Richter HO, Zetterberg C, Forsman M. Trapezius muscle activity increases during near work activity regardless of accommodation/vergence demand level. Eur J Appl Physiol 2015;115:1501–12. [DOI] [PMC free article] [PubMed] [Google Scholar]
- 17.Richter HO. Neck pain brought into focus. Work 2014;47:413–8. [DOI] [PubMed] [Google Scholar]
- 18.Mangione CM, Lee PP, Gutierrez PR, Spritzer K, Berry S, Hays RD. Development of the 25-item National Eye Institute Visual Function Questionnaire. Arch Ophthalmol 2001;119:1050–8. [DOI] [PubMed] [Google Scholar]
- 19.Vernon H, Mior S. The Neck Disability Index: a study of reliability and validity. J Manipulative Physiol Ther 1991;14:409–15. [PubMed] [Google Scholar]
- 20.Powell LE, Myers AM. The Activities-specific Balance Confidence (ABC) Scale. J Gerontol A Biol Sci Med Sci 1995;50:28–34. [DOI] [PubMed] [Google Scholar]
- 21.Guillemin I, Begley C, Chalmers R, Baudouin C, Arnould B. Appraisal of patient-reported outcome instruments available for randomized clinical trials in dry eye: revisiting the standards. Ocul Surf 2012;10:84–99. [DOI] [PubMed] [Google Scholar]
- 22.McAlinden C, Pesudovs K, Moore JE. The development of an instrument to measure quality of vision: the Quality of Vision (QoV) questionnaire. Invest Ophthalmol Vis Sci 2010;51:5537–45. [DOI] [PubMed] [Google Scholar]
- 23.Steenstra IA, Sluiter JK, Frings-Dresen MH. The eye-complaint questionnaire in a visual display unit work environment: internal consistency and test-retest reliability. Ergonomics 2009;52:334–44. [DOI] [PubMed] [Google Scholar]
- 24.Zetterlund C, Lundqvist LO, Richter HO. The relationship between low vision and musculoskeletal complaints. A case control study between age related macular degeneration patients and age-matched controls with normal vision. J Optom 2009;2:127–33. [Google Scholar]
- 25.Jöreskog KG, Sörbom D. LISREL 8: User’s Reference Guide, 2nd ed Chicago: Scientific Software International; 1996. [Google Scholar]
- 26.Jöreskog KG, Sörbom D. PRELIS—A Program for Multivariate Data Screening and Data Summarization. A Preprocessor for LISREL, 2nd ed Chicago: Scientific Software Inc.; 1988. [Google Scholar]
- 27.Bentler PM. Comparative fit indexes in structural models. Psychol Bull 1990;107:238–46. [DOI] [PubMed] [Google Scholar]
- 28.Browne MW, Cudeck R. Alternative ways of assessing model fit. In: Bollen KA, Long JS, eds. Testing Structural Equation Models. Newbury Park: Sage Publications; 1993;136–62. [Google Scholar]
- 29.Vandenberg RJ, Lance CE. A review and synthesis of the measurement invariance literature: suggestions, practices, and recommendations for organizational research. Organ Res Methods 2000;3:4–70. [Google Scholar]
- 30.Andrich D. A rating formulation for ordered response categories. Psychometrika 1978;43:561–73. [Google Scholar]
- 31.Linacre JM. Winsteps® Rasch measurement computer program. Winsteps.com: Beaverton, OR; 2014. [Google Scholar]
- 32.Engelhard G., Jr Invariant Measurement: Using Rasch Models in the Social, Behavioral, and Health Sciences. New York: Routledge; 2013. [Google Scholar]
- 33.Bentler PM, Chou C. Practical issues in structural modeling. Sociol Methods Res 1987;16:78–117. [Google Scholar]
- 34.Linacre JM. Optimizing rating scale category effectiveness. J Appl Meas 2002;3:85–106. [PubMed] [Google Scholar]
- 35.Ortho KM. [Low Vision Acuity Chart]. Available at: http://www.syntavlor.se/LAGVISUSTAVLAN.html. Accessed November 20, 2015.
- 36.Hedin A, Olsson K. Letter legibility and the construction of a new visual acuity chart. Ophthalmologica 1984;189:147–56. [DOI] [PubMed] [Google Scholar]
- 37.Pesudovs K, Gothwal VK, Wright T, Lamoureux EL. Remediating serious flaws in the National Eye Institute Visual Function Questionnaire. J Cataract Refract Surg 2010;36:718–32. [DOI] [PubMed] [Google Scholar]
- 38.Revicki DA, Rentz AM, Harnam N, Thomas VS, Lanzetta P. Reliability and validity of the National Eye Institute Visual Function Questionnaire-25 in patients with age-related macular degeneration. Invest Ophthalmol Vis Sci 2010;51:712–7. [DOI] [PubMed] [Google Scholar]
- 39.Langelaan M, van Nispen RM, Knol DL, Moll AC, de Boer MR, Wouters B, Van Rens GH. Visual Functioning Questionnaire: reevaluation of psychometric properties for a group of working-age adults. Optom Vis Sci 2007;84:775–84. [DOI] [PubMed] [Google Scholar]
- 40.Ware JE, Jr., Snow KK, Kosinski M, Gandek B. SF-36 Health Survey Manual and Interpretation Guide. Boston: The Health Institute, New England Medical Center; 1993. [Google Scholar]
- 41.Ware JE, Gandek B, the IQOLA Project Group. The SF-36 Health Survey: development and use in mental health research and the IQOLA Project. Int J Ment Health 1994;23:49–73. [Google Scholar]
- 42.Sullivan M, Karlsson J, Ware JE., Jr The Swedish SF-36 Health Survey—I. Evaluation of data quality, scaling assumptions, reliability and construct validity across general populations in Sweden. Soc Sci Med 1995;41:1349–58. [DOI] [PubMed] [Google Scholar]
- 43.Scott J, Huskisson EC. Graphic representation of pain. Pain 1976;2:175–84. [PubMed] [Google Scholar]
- 44.Clark RA, Bryant AL, Pua Y, McCrory P, Bennell K, Hunt M. Validity and reliability of the Nintendo Wii Balance Board for assessment of standing balance. Gait Posture 2010;31:307–10. [DOI] [PubMed] [Google Scholar]
- 45.Baratto L, Morasso PG, Re C, Spada G. A new look at posturographic analysis in the clinical context: sway-density versus other parameterization techniques. Motor Control 2002;6:246–70. [DOI] [PubMed] [Google Scholar]
- 46.Wade DT, Wood VA, Heller A, Maggs J, Langton Hewer R. Walking after stroke. Measurement and recovery over the first 3 months. Scand J Rehabil Med 1987;19:25–30. [PubMed] [Google Scholar]
- 47.Podsiadlo D, Richardson S. The timed “Up & Go”: a test of basic functional mobility for frail elderly persons. J Am Geriatr Soc 1991;39:142–8. [DOI] [PubMed] [Google Scholar]
- 48.Briggs RC, Gossman MR, Birch R, Drews JE, Shaddeau SA. Balance performance among noninstitutionalized elderly women. Phys Ther 1989;69:748–56. [DOI] [PubMed] [Google Scholar]
- 49.Duncan PW, Weiner DK, Chandler J, Studenski S. Functional reach: a new clinical measure of balance. J Gerontol 1990;45:M192–7. [DOI] [PubMed] [Google Scholar]
- 50.Hair JF, Jr., Black WC, Babin BJ, Anderson RE, Tatham RL. Multivariate Data Analysis. Pearson Prentice Hall: Upper Saddle River, NJ; 2006. [Google Scholar]
- 51.Mallinson T. Why measurement matters for measuring patient vision outcomes. Optom Vis Sci 2007;84:675–82. [DOI] [PubMed] [Google Scholar]
- 52.Wright BD. Reliability and separation. Rasch Meas Trans 1996;9:472 Available at: http://www.rasch.org/rmt/rmt94n.htm. Accessed November 20, 2015. [Google Scholar]
- 53.Langley FA, Mackintosh SFH. Functional balance assessment of older community dwelling adults: a systematic review of the literature. Internet J Allied Health Sci Practice 2007;5:1–11. [Google Scholar]


