
Figure 1.
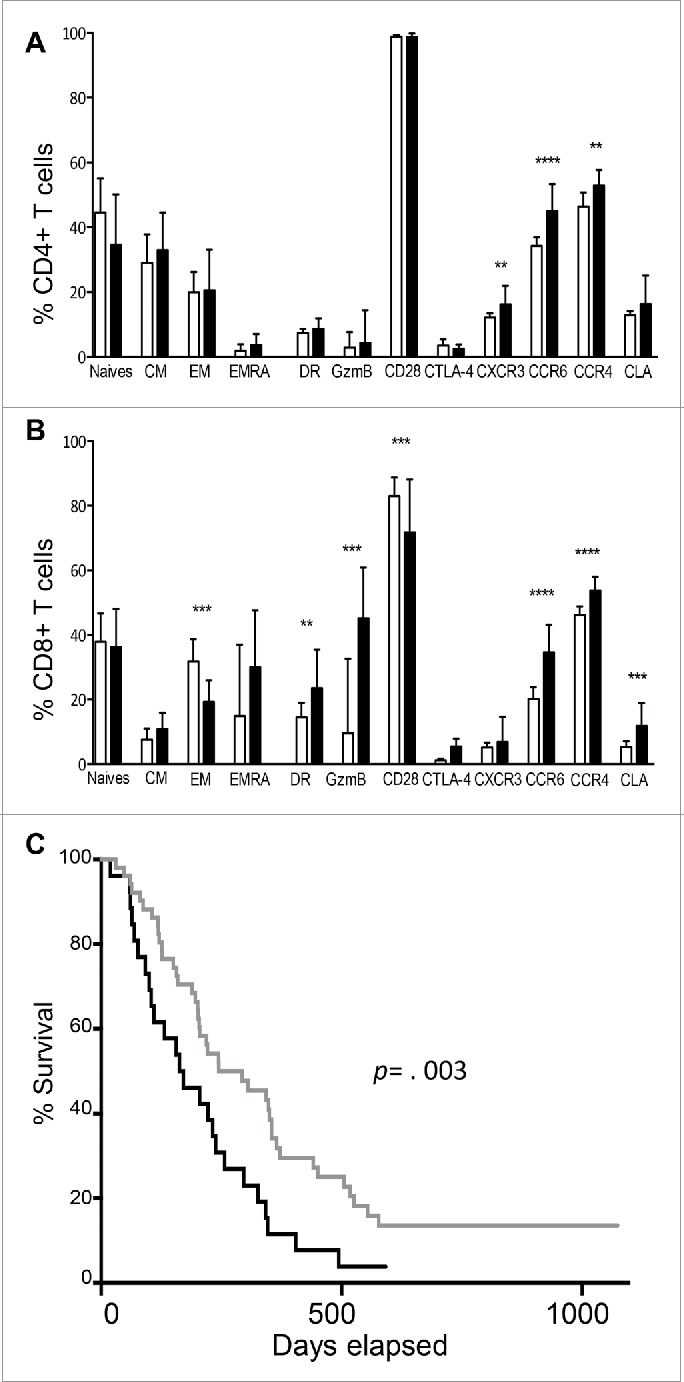
Patients immunological status at the baseline. Percentages of CD4+ (A) and CD8+ (B) T cell subsets (CM for central memory, EM for effector memory, EMRA for terminally effector memory, GzmB for Granzyme B). Results from HD and patients are shown as open bars and black bars respectively. *for p < 0.05, ** for p < 0.01, *** for p < 0.001 and **** for p < 0.0001. (C) Kaplan–Meier survival curves from patients with ALC ≥ 1 × 10⁹/L (gray line, n = 43) or < 1 × 10⁹/L (black line, n = 26) at the baseline.