

Overexpression of ribosomal proteins in yeast is prevented by ubiquitination of unassembled ribosomal proteins in the nucleus and/or nucleolus followed by proteasome-dependent degradation. Brief inhibition of proteasome causes strong accumulation of multiple ribosomal proteins in an insoluble fraction, suggesting that this is a general phenomenon.
Abstract
Ribosome assembly is an essential process that consumes prodigious quantities of cellular resources. Ribosomal proteins cannot be overproduced in Saccharomyces cerevisiae because the excess proteins are rapidly degraded. However, the responsible quality control (QC) mechanisms remain poorly characterized. Here we demonstrate that overexpression of multiple proteins of the small and large yeast ribosomal subunits is suppressed. Rpl26 overexpressed from a plasmid can be detected in the nucleolus and nucleoplasm, but it largely fails to assemble into ribosomes and is rapidly degraded. However, if the endogenous RPL26 loci are deleted, plasmid-encoded Rpl26 assembles into ribosomes and localizes to the cytosol. Chemical and genetic perturbation studies indicate that overexpressed ribosomal proteins are degraded by the ubiquitin–proteasome system and not by autophagy. Inhibition of the proteasome led to accumulation of multiple endogenous ribosomal proteins in insoluble aggregates, consistent with the operation of this QC mechanism in the absence of ribosomal protein overexpression. Our studies reveal that ribosomal proteins that fail to assemble into ribosomes are rapidly distinguished from their assembled counterparts and ubiquitinated and degraded within the nuclear compartment.
INTRODUCTION
Protein quality control (PQC) is critical for maintenance of protein homeostasis in eukaryotic cells. PQC pathways specific for multiple cellular compartments have been identified, including ones dedicated to misfolded proteins in the cytosol (Eisele and Wolf, 2008; Heck et al., 2010; Nillegoda et al., 2010), nucleus (Gardner et al., 2005), plasma membrane (Zhao et al., 2013), and endoplasmic reticulum membrane (Vembar and Brodsky, 2008). Indeed, there even exist PQC pathways that attack defective translation products as they emerge from the ribosome (Bengtson and Joazeiro, 2010; Brandman et al., 2012; Defenouillere et al., 2013; Verma et al., 2013). However, given the enormous diversity of protein structure and localization, it is likely that our understanding of PQC is far from complete.
In surveying the landscape of challenges facing protein biogenesis, we alighted on the ribosome as an interesting target for the mechanistic investigation of PQC. Ribosome formation in yeast is a complicated process that requires transcription of 35S and 5S rRNAs, processing of 35S primary rRNA, translation and nuclear import of 79 different ribosomal proteins, and assembly of processed rRNAs and ribosomal proteins in the nucleolus (Kressler et al., 2010). Ribosome assembly is not only complex, but it also monopolizes an impressive fraction of biogenic capacity. In rapidly growing yeast cells, 60% of total transcription is devoted to rRNA, and 50% of RNA polymerase II transcription and 90% of mRNA splicing are devoted to ribosomal proteins (Warner, 1999). This tremendous flux places a premium on efficient PQC mechanisms to minimize formation and accumulation of unusable components. However, despite a rapid expansion in our understanding of homeostatic regulatory mechanisms for assembled ribosomes, the homeostatic mechanisms that monitor ribosome assembly and help cells cope with errors or imbalances in the assembly process remain poorly understood.
One simple but profound question about ribosome assembly concerns how the cell controls ribosomal gene expression to ensure stoichiometric production of all proteins. Several studies have suggested that some ribosomal proteins may be made in excess, and the cell maintains an appropriate level of these proteins by degrading the unassembled ones. The existence of such a mechanism is supported by several lines of evidence. For example, newly synthesized ribosomal proteins are rapidly degraded when rRNA processing is impaired (Gorenstein and Warner, 1977; Warner, 1977). In addition, in cells harboring extra copies of a ribosomal protein gene, overproduction of the corresponding protein cannot be detected unless extremely short pulse labeling (∼45 s) is performed (Abovich et al., 1985). Based on these observations, it was proposed that some ribosomal proteins are normally synthesized at levels beyond what cells require, but the excess amounts are degraded rapidly, such that they do not detectably accumulate. However, the mechanism by which the overproduced ribosomal proteins are degraded was not explored. This hypothesis is supported by two more recent studies. Experiments with pulsed stable isotope labeling with amino acids in cell culture demonstrate that newly synthesized human ribosomal proteins are rapidly imported into the nucleolus for assembly with rRNA and the excess is degraded by the proteasome (Lam et al., 2007). Furthermore, whereas acquisition of an extra chromosome in yeast leads to proportional increases in mRNA and protein levels for most of the genes on the extra chromosome (Torres et al., 2007, 2010), most ribosomal proteins do not increase proportionally with copy number but are attenuated posttranslationally by an unidentified mechanism (Dephoure et al., 2014). Multiple mechanisms could potentially mediate degradation of excess ribosomal proteins. Whereas the human studies implicate the proteasome, it was not determined whether the degradation of ribosomal subunits observed by Lam et al. (2007) was related to assembly status or dependent on ubiquitination. In yeast cells, two other mechanisms have been connected to ribosome metabolism. Yeast cells starved of amino acids encapsulate existing mature ribosomes in autophagosomes in a process referred to as ribophagy (Kraft et al., 2008). In addition, yeast cells subject to heat shock form stress granules that contain 40S subunits, and these are also eliminated by autophagy (Grousl et al., 2009).
In this study, we investigate the fate of ribosomal proteins that are made in stoichiometric excess over other ribosomal subunits. We demonstrate that overproduced ribosomal proteins largely fail to assemble into ribosomes and instead are rapidly ubiquitinated and degraded in the nucleus in a proteasome-dependent manner.
RESULTS
Ribosomal proteins produced in excess do not accumulate and are degraded by the ubiquitin–proteasome system
To investigate how unassembled ribosomal proteins are regulated, we first confirmed that overexpressed ribosomal proteins accumulate poorly, by measuring steady-state levels of several ribosomal proteins marked with a compound hexahistidine-hemagglutinin (HA)-protein A ZZ domain (hereafter referred as HHZ) epitope tag and transiently expressed from the GAL1 promoter in wild-type (WT) cells after a short induction with galactose (Figure 1A). For this and other experiments, we grew cells carrying a GAL-driven construct on a 2-μm plasmid in raffinose-containing medium and induced expression from the GAL promoter with 2% galactose for 60–90 min before we harvested cells for analysis. Accumulation of ectopically overexpressed ribosomal proteins was lower than of the nonribosomal protein Hog1 even though all proteins were expressed from the same GAL1 promoter (Figure 1, B, quantified and shown as black bars in C). This result extends support for the hypothesis that although ribosomal proteins are generally believed to be stable, those made in excess are culled by an unknown QC mechanism.
FIGURE 1:
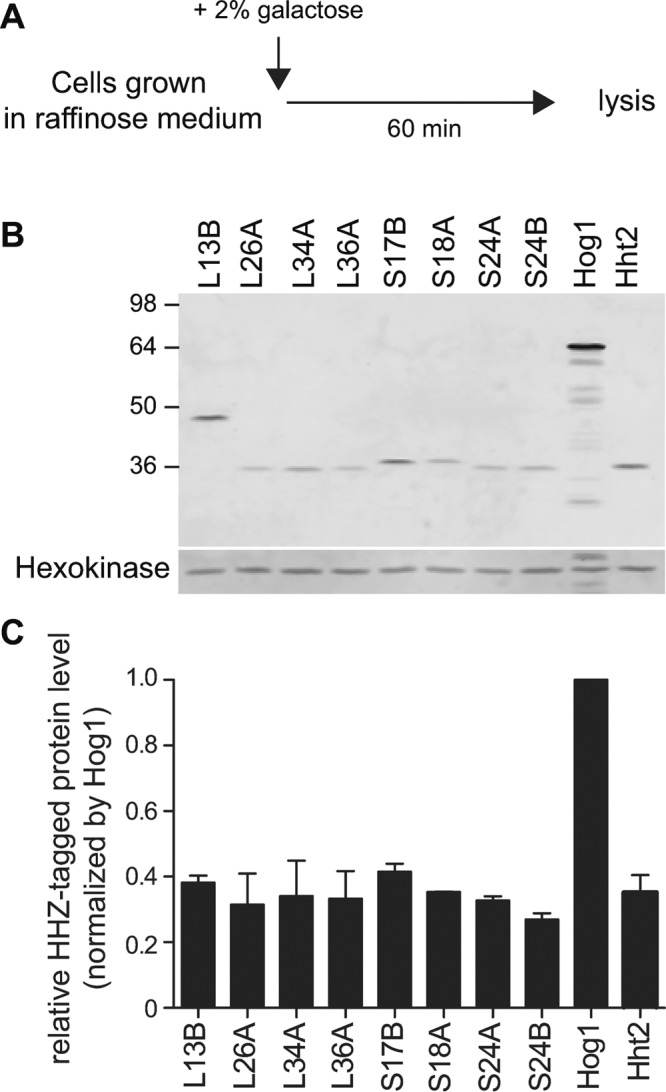
Overexpression of ribosomal proteins is inefficient. (A) Experimental scheme to evaluate overexpression of HHZ-tagged ribosomal proteins. (B) Steady-state levels of ribosomal proteins are lower than that of the nonribosomal protein Hog1 when all proteins are transiently overexpressed from the GAL promoter. Total cell lysates were fractionated by SDS–PAGE and immunoblotted with HA antibody. Hexokinase was used as an internal control. (C) Quantification of HHZ-tagged proteins in B. Relative HHZ-tagged protein levels were normalized to Hog1 using Odyssey software. Values are the mean of two independent experiments, and error bars indicate SDs.
If the foregoing hypothesis is correct, we predicted that disruption of the chromosomal copies of a plasmid-borne ribosomal gene would restore stoichiometric balance and allow accumulation of the induced, plasmid-encoded protein (Figure 2A). To test this prediction and more generally to study the fate of excess ribosomal proteins, we focused on Rpl26 because 1) the steady-state level of ectopically expressed Rpl26a-HHZ in WT was low (Figure 1, B and C), 2) rpl26a∆rpl26b∆ double mutants are viable (Babiano et al., 2012; Supplemental Figure S1A) and exhibited only a modest defect in polysome formation (Supplemental Figure S1B), and 3) interactions of Rpl26 with 5.8S and 25S rRNAs are characterized (Ben-Shem et al., 2011; Supplemental Figure S1C). Consistent with the QC hypothesis, Rpl26a–green fluorescent protein (GFP; Figure 2B) or Rpl26a-FLAG (Figure 2C) expressed from the GAL10 promoter accumulated poorly upon transient induction in WT cells but exhibited robust accumulation in rpl26a∆rpl26b∆ cells. Moreover, the accumulation of GAL10-driven Rpl26a-Flag was inversely proportional to the level of Rpl26-GFP constitutively expressed from a chromosomal locus (Figure 2D). Finally, the striking difference in GAL10-driven Rpl26a-GFP accumulation in WT versus rpl26a∆rpl26b∆ cells was not due to differences in mRNA expression (Figure 2E).
FIGURE 2:

Overexpressed Rpl26a does not accumulate. (A) Experimental design. Ribosomal proteins synthesized in the cytoplasm are imported into the nucleolus for assembly with rRNA. In WT cells, excessive ribosomal protein transiently expressed from a plasmid (black circle) assembles poorly with rRNA because of competition from its preexisting endogenous counterpart (blue circle) and consequently becomes a substrate of a quality control mechanism. In mutant cells lacking chromosomal ribosomal protein genes corresponding to the plasmid-borne gene, plasmid-encoded ribosomal protein (black circle) is successfully assembled with rRNA and is thereby stabilized and accumulates. (B, C) Endogenous Rpl26 restricts accumulation of induced Rpl26a. WT or rpl26a∆rpl26b∆ cells were induced with galactose for 1 h to express Rpl26a-GFP (B) or Rpl26a-FLAG (C), and cell lysates were fractionated by SDS–PAGE. Immunoblotting was performed using an antibody against GFP or FLAG. Hexokinase was used as an internal control. (D) Overexpressed Rpl26a-FLAG accumulation is reciprocal to the level of endogenous Rpl26-GFP. Cells of the indicated genotypes were induced with galactose for 1 h to express Rpl26a-FLAG. Cell lysate was fractionated by SDS–PAGE and immunoblotted with GFP and FLAG antibodies. Hexokinase was used as an internal control. (E) Poor induction of Rpl26a-GFP in WT is not due to reduced mRNA level. Total RNA was extracted from WT and rpl26a∆rpl26b∆ cells induced or not with galactose for 1 h, and RPL26A-GFP mRNA was measured by qPCR. ACT1 mRNA was used for normalization. Values are the mean of three independent experiments, and error bars indicate SDs.
We next sought to identify the mechanism by which accumulation of excess ribosomal protein was repressed. We first examined whether degradation of excess ribosomal proteins was regulated by ribosome autophagy (ribophagy), based on the observation that selective degradation of ribosomal proteins upon starvation is mediated by autophagy (Kraft et al., 2008). Suppression of Rpl26a-FLAG overexpression remained intact in mutants defective in autophagy (atg7∆) or in degradation of proteins that enter the vacuole (pep4∆; Figure 3A). On the basis of this result, we next sought to test whether the UPS was involved. Addition of the proteasome inhibitor bortezomib (btz) to cells overexpressing ribosomal proteins from the GAL10 promoter resulted in stronger accumulation for Rpl26a-FLAG (Figure 3A) and seven of eight other ribosomal proteins tested (Figure 3, B–D). To test whether inhibition of the proteasome caused the overexpressed Rpl26a-FLAG to accumulate as ubiquitin-conjugated species, we affinity-purified total cellular ubiquitin conjugated proteins from galactose-induced cells on ubiquitin-binding UBA domain resin and immunoblotted them with anti-FLAG antibody, which revealed that high–molecular weight (MW) forms of Rpl26a-FLAG accumulated in the presence of proteasome inhibitor (Figure 4A) and in a pre9∆ mutant lacking the nonessential α3 subunit of the 20S proteasome (Figure 4B) but not in pre9∆ cells that also lacked the endogenous RPL26A and RPL26B (Figure 4C). To establish unambiguously that the accumulated high-MW species were ubiquitin conjugates, we digested UBA resin eluates with deubiquitinating enzyme Usp2 before immunoblotting, which caused progressive, time-dependent loss of the high-MW species and an increase in unmodified Rpl26a-FLAG (Figure 4D). Finally, we showed that Rpl26a-FLAG immunoprecipitated from btz-treated cells under denaturing conditions reacted with anti-ubiquitin antibody (Figure 4E). Taken together, our results demonstrate that excess ribosomal proteins are ubiquitinated and then degraded by proteasome.
FIGURE 3:

Excess ribosomal proteins are degraded by the proteasome. (A) Degradation of excess Rpl26a is not mediated by autophagy but by UPS. Cells were induced with galactose for 1 h to express Rpl26a-FLAG. For proteasome inhibition, cells induced 30 min with galactose to express Rpl26a-FLAG were treated with 50 μM btz for an additional 30 min. Left, cell lysate was fractionated by SDS–PAGE and immunoblotted with FLAG antibody. Hexokinase was used as an internal control. Right, relative protein levels were normalized to –btz using Odyssey software. Values are the mean of two independent experiments, and error bars indicate SDs. (B) Experimental scheme to evaluate accumulation of HHZ-tagged ribosomal proteins upon proteasome inhibition. (C) Degradation of transiently overexpressed ribosomal proteins is mediated by proteasome. Cells were treated as depicted in B, and cell lysates were fractionated by SDS–PAGE and immunoblotted with HA antibody. Hexokinase was used as an internal control. (D) Quantification of HHZ-tagged proteins in C. The relative btz-treated, HHZ-tagged protein levels were normalized to mock-treated ones using Odyssey software. Values are the mean of two independent experiments, and error bars indicate SDs.
FIGURE 4:

Excess Rpl26a is ubiquitinated and then degraded by the proteasome. (A) Excess Rpl26a accumulates in polyubiquitinated forms after treatment with proteasome inhibitor. Cells induced 45 min with galactose to express Rpl26a-FLAG were treated with 50 μM btz for an additional 45 min. Total cell extract was adsorbed to UBA resin to enrich ubiquitin conjugates, and the bound fraction was separated by SDS–PAGE and immunoblotted with antibodies against FLAG and ubiquitin. Hexokinase was used as an internal control. (B) Excess Rpl26a is polyubiquitinated in a mutant lacking the α3 subunit of the 20S proteasome (pre9∆). Same as A except that pre9∆ cells were used and btz was omitted. (C) Rpl26a induced in pre9∆rpl26a∆rpl26b∆ is not polyubiquitinated. Same as B except that cells of different genotypes were used as indicated. (D) Usp2 deconjugates ubiquitin from Rpl26a. Cells induced for 45 min with galactose to express Rpl26a-FLAG were treated with 50 μM btz for an additional 45 min. Total cell extract was adsorbed to UBA resin, and then ubiquitin conjugates collected by UBA resin were treated with or without Usp2 (1 μM) for indicated times and immunoblotted with antibodies against FLAG and ubiquitin. (E) Cells with or without the Rpl26a-FLAG plasmid and deleted for the multidrug exporter PDR5 were supplemented with 50 μM btz after 45 min of galactose induction. After an additional 45 min, total cell extract prepared under denaturing conditions was incubated with FLAG resin. The bound fraction was separated by SDS–PAGE and immunoblotted with an antibody against ubiquitin. Hexokinase was used as an internal control.
Rpl26 produced in excess largely does not assemble into ribosomes but is ubiquitinated and then degraded by the proteasome
In general, ribosomal proteins are stable. For instance, a proteome-wide study of protein degradation rates in Saccharomyces cerevisiae revealed that the median t1/2 for 85 TAP-tagged ribosomal proteins is 144 min, which is longer than the doubling time (Belle et al., 2006). However, an overproduced ribosomal protein would be in excess over its rRNA and protein partners and thus presumably would fail to assemble and be subject to degradation. To test this prediction, we used sucrose gradients to monitor the assembly of transiently overexpressed Rpl26a into ribosomes in WT and rpl26a∆rpl26b∆ cells. Transiently overexpressed Rpl26a-FLAG (Figure 5A), Rpl26a-GFP (Figure 5B), or Rpl26a-HHZ (Figure 5C) efficiently assembled into ribosomes in rpl26a∆rpl26b∆ cells but not in cells that constitutively expressed endogenous Rpl26. Of note, a substantial fraction of the induced FLAG- and GFP-tagged Rpl26a that was detectable was found in the low-MW unassembled fraction in WT but not rpl26a∆rpl26b∆ cells (Figure 5, A and B). The Rpl26a detected in the low-MW region of the gradients migrated more rapidly than the input and assembled Rpl26a upon SDS–PAGE, suggesting that it was processed. We do not know the nature of this modification, but presumably the C-terminus remains intact because the processed protein reacts with antibodies to the C-terminal tags. Presumably, this processing occurs in vitro, because we did not observe substantial amount of processed protein in total cell lysates prepared under denaturing conditions (Figure 2, B–D). Of importance, when cells transiently overexpressed Rpl26a-FLAG in the presence of bortezomib, there was a tremendous increase in the unassembled pool but only a very modest increase in the amount incorporated into ribosomes (Figure 5D). To determine which population of molecules was modified with ubiquitin, lysate from cells overexpressing Rpl26a-FLAG in the presence of bortezomib were fractionated on a sucrose gradient, and the unassembled, 40S/60S/80S, and polysome fractions were pooled separately and adsorbed to a UBA resin that binds polyubiquitin conjugates. The same procedure was also carried out in parallel with cells containing empty vector. Bound proteins were then evaluated by immunoblotting with FLAG antibody. Strikingly, the ubiquitin-conjugated species of Rpl26a-FLAG were exclusively found in the unassembled fraction (Figure 5E). Taken together, these data indicate that the ubiquitination and degradation pathways are exquisitely specific for unassembled forms of Rpl26a.
FIGURE 5:

Rpl26 produced in excess largely does not assemble into ribosomes but is ubiquitinated and then degraded by the proteasome. (A, B) Rpl26a produced in excess poorly assembles into ribosomes. WT and rpl26a∆rpl26b∆ cells were induced with galactose for 1 h to express Rpl26a-FLAG (A) or Rpl26a-GFP (B) and then treated with cycloheximide for 15 min before cell lysis to stabilize polysomes. Cell lysate was fractionated on a sucrose gradient, and fractions were analyzed by SDS–PAGE and immunoblotting with FLAG or GFP antibody. T, total extract. (C) Rpl26a-HHZ produced in excess poorly assembles into ribosomes. Same as A except that a different genotype was used. Cells lacked both natural RPL26 loci and contained an integrated copy of constitutively expressed RPL26A-GFP as well as an inducible, plasmid-encoded copy of RPL26A-HHZ. Immunoblotting was performed using antibodies against GFP and HA. T, total extract. Black circle indicates constitutively expressed Rpl26a-GFP, and open circle indicates transiently induced Rpl26a-HHZ. Some of the bands have a light-colored center that indicates regions where the signal has saturated the detector. (D) Unassembled Rpl26a accumulates in the nonribosomal fractions upon proteasome inhibition. Same as A, except that 50 μM btz was added after the first 30 min of galactose induction. (E) Polyubiquitinated Rpl26a accumulates in nonribosomal fractions upon proteasome inhibition. WT cells were treated as in D. Sucrose gradient fractions were pooled as shown and incubated with UBA resin to enrich ubiquitin conjugates, and the bound fractions were separated by SDS–PAGE and immunoblotted with FLAG antibody. Hexokinase was used as an internal control. L.E and S.E, long and short exposure, respectively.
The small steady-state pool of excess Rpl26 resides primarily in the nucleus and nucleolus
The observed ubiquitination and degradation of unassembled Rpl26a raised the question of where this process occurred. In proteasome-deficient pre9∆ cells, the majority of transiently overexpressed Rpl26a-GFP accumulated in the nucleus, as judged by subcellular fractionation (Figure 6A). Both unmodified and ubiquitin-conjugated species were readily detected in the nuclear fraction, indicating that ubiquitination of excess unassembled Rpl26a occurred in the nuclear compartment. A similar result was obtained when degradation of excess Rpl26a-GFP was blocked by addition of the proteasome inhibitor MG132 (Figure 6B). Further, fluorescence microscopy revealed that Rpl26a-GFP fluorescence was confined to the nucleus in both WT and pre9∆ cells but was more intense and more frequently detected in the mutant cells (Figure 6C), consistent with the subcellular fractionation data in Figure 5, A and B. Of interest, the most intense focus of GFP staining in WT cells coincided with the nucleolar marker Nop56–monomeric red fluorescent protein (mRFP; Figure 6, C and D). Given this evidence that overproduced Rpl26a was most likely degraded in the nucleus, we tested whether its degradation depended on the nuclear quality control ubiquitin ligase San1. However, overproduced Rpl26a-FLAG did not accumulate in san1∆ (Supplemental Figure S2), suggesting that some other PQC pathway is involved. Of note, in some pre9∆ cells, the focus of GFP staining was distinct from the nucleolus (Figure 6C, bottom right, white arrow). This suggests that if degradation of Rpl26a-GFP is blocked by the pre9∆ mutation, some of the protein begins to aggregate in the nucleoplasm. These structures may correspond to the recently described intranuclear quality control compartment (Miller et al., 2015). In contrast with WT cells, GAL10-driven Rpl26a-GFP was primarily cytosolic in rpl26a∆rpl26b∆ cells (Figure 6D), in agreement with the observation that it efficiently assembled into ribosomes in this genotype (Figure 5B). Taken together, our data suggest that upon overexpression, Rpl26 translocates to the nucleus and nucleolus, where a small fraction of the overproduced protein outcompetes its endogenous, constitutively expressed counterpart to assemble into ribosomes. However, the great majority remains unassembled and is conjugated with ubiquitin and then degraded by the proteasome, most likely within the nucleolar and/or nuclear compartments.
FIGURE 6:

The small steady-state pool of excess Rpl26 resides primarily in the nucleus and nucleolus. (A) Induced Rpl26a is enriched in the nucleus. WT and pre9∆ cells were induced with galactose for 1 h to express Rpl26a-GFP. Whole cell extract (WCE) was fractionated into cytosolic (Cy) and nuclear (Nu) fractions, which were analyzed by SDS–PAGE and immunoblotting with an antibody against GFP. Histone H3 and hexokinase were used as nuclear and cytoplasmic markers, respectively. (B) Induced Rpl26a accumulates in the nucleus upon treatment with proteasome inhibitor. Same as A, except that 50 μM MG132 was added to WT cells after 30 min of galactose induction. L.E and S.E, long and short exposure, respectively. (C) Induced Rpl26a in pre9∆ cells localizes in the nucleus/nucleolus. WT and pre9∆ cells harboring a NOP56-RFP allele to mark nucleoli were induced with galactose for 1 h to express Rpl26a-GFP and analyzed by fluorescence microscopy. Arrow indicates the accumulation of Rpl26a in a nonnucleolar region. Right, percentage of GFP-positive cells. (D) Induced Rpl26a localizes in the nucleus/nucleolus of WT but in the cytoplasm of rpl26a∆rpl26b∆ cells. WT cells harboring a NOP56-RFP allele to mark nucleoli and rpl26a∆rpl26b∆ cells were induced with galactose for 1 h to express Rpl26a-GFP and analyzed by fluorescence microscopy. Right, percentage of GFP-positive cells.
Newly synthesized endogenous ribosomal proteins aggregate in proteasome inhibitor–treated cells
Our observations showing UPS-mediated degradation of overexpressed ribosomal proteins raised the question of whether a similar mechanism operates on endogenous ribosomal proteins that fail to assemble. To address it, we treated cells with a proteasome inhibitor to block degradation of any ribosomal proteins that fail to assemble, prepared soluble and insoluble cell lysate fractions, and evaluated them for their content of ribosomal proteins. Immunoblotting with several antibodies against ribosomal proteins (Rpl3 and Rps2) revealed that inhibition of proteasome does not affect the level of ribosomal proteins in total and soluble fractions (Figure 7A, shown in total and soluble). In contrast, the insoluble fraction from btz-treated cells contained significantly increased amounts of ubiquitin conjugates and ribosomal proteins compared with that of nontreated cells (Figure 7A, shown in pellet). We also observed that insoluble proteins accumulated in pre9∆- and MG132-treated cells (Supplemental Figure S3A), suggesting that this is a general response to proteasome inhibition and not an off-target effect of btz.
FIGURE 7:

Newly synthesized endogenous ribosomal proteins aggregate in proteasome inhibitor–treated cells. (A) Unassembled endogenous ribosomal proteins aggregate in cells treated with proteasome inhibitor. Cells were treated with 50 μM btz for 1 h. Whole-cell extract (WCE) was fractionated into soluble and pellet fractions, which were analyzed by SDS–PAGE followed by Coomassie blue staining (left) or immunoblotting with antibodies against ubiquitin and the indicated ribosomal proteins (right). Hexokinase was used as an internal control. (B) Scatter plot representing ∆iBAQ of biological replicate B vs. A for aggregated proteins in btz-treated cells. Proteins are color-coded as indicated. Ribosomal proteins with the largest increase in the pellet fraction upon proteasome inhibition and Rpl3 and Rps2 are annotated. Pearson’s r is indicated on the top of the plot. BTZ, btz-treated cells; NC, nontreated cells. (C) Gene ontology analysis of aggregated proteins upon proteasome inhibition. Violin plot representing the distribution of ∆iBAQ for all proteins (blue) and the two most strongly affected categories: proteins related to mitochondrion (green) and ribosomal proteins (red). The number in parentheses below each category refers to the disproportionate enrichment for the category in the top 10% of identifications. This is the Benjamini–Hochberg corrected p value from a Fisher exact test. (D) The 20 proteins with the largest increase in the pellet fraction upon proteasome inhibition. Values are the average difference of iBAQ between btz-treated and nontreated samples, with error bars indicating SEM. Blue, red, and gray bars correspond to 60S, 40S, and nonribosomal proteins, respectively. (E) Newly synthesized endogenous ribosomal proteins aggregate in cells treated with proteasome inhibitor. Same as A except that cells were pretreated with 50 μg/ml cycloheximide (CHX) for 30 min before addition of btz.
On the basis of the foregoing results, we sought to investigate more globally the effect of proteasome inhibition on accumulation of insoluble ribosomal proteins. To do this, we identified proteins recovered from pellet fractions by mass spectrometry (MS) and estimated their abundances by label-free absolute quantification with intensity-based absolute quantification (iBAQ) as previously described (Geiger et al., 2012). Comparison of three biological replicates confirmed excellent reproducibility (Figure 7B and Supplemental Figure S3B). For all three biological replicates, a general trend of increasing protein accumulation in the insoluble fraction was observed upon proteasome inhibition, consistent with Coomassie blue staining (Figure 7A). Of note, the insoluble proteins with the largest increase in btz-treated cells over nontreated cells (NC) were ribosomal proteins of the large and small subunits including Rpl3 and Rps2 (Figure 7B, Supplemental Figure S3C, and Supplemental Table S3). Gene ontology analysis of the MS data confirmed that ribosomal proteins from both subunits comprise the major class of aggregators upon proteasome inhibition (Figure 7C and Supplemental Figure S3D). This is clearly evident from a table of ∆iBAQ values for ribosomal proteins versus nonribosomal proteins (Supplemental Table S4) and a plot of the top 20 aggregate-prone proteins in the presence of proteasome inhibitor (Figure 7D).
To further explore whether aggregated ribosomal proteins were produced from existing mature ribosomal proteins or were newly synthesized, we analyzed pellet fractions from cells treated with btz in the presence or absence of the protein synthesis inhibitor cycloheximide. Coomassie blue staining revealed that cycloheximide treatment significantly suppressed accumulation of insoluble proteins in btz-treated cells (Figure 7E). Of importance, btz-dependent accumulation of insoluble forms of the endogenous ribosomal proteins Rpl3 was clearly impaired when cells were cotreated with cycloheximide (Figure 7E), suggesting that the major source of aggregated ribosomal proteins was derived from newly synthesized proteins and not preexisting ribosomes.
DISCUSSION
Nearly 40 years ago, it was shown that when expression of rRNA is extinguished in either yeast or HeLa cells, synthesis of ribosomal proteins continues, but the unassembled proteins are rapidly degraded (Gorenstein and Warner, 1977; Warner, 1977). Subsequent work indicated that single ribosomal proteins cannot be stably overexpressed in yeast because the excess protein is degraded with exceptional speed after its synthesis (Abovich et al., 1985; Warner et al., 1985). However, pathways responsible for degradation of ribosomal proteins were not identified and largely escaped attention until several years ago, when it was shown that ribosomal proteins are among the most prominent ubiquitin-conjugated species that accumulate upon inhibition of the proteasome (Mayor et al., 2005, 2007) and that newly synthesized ribosomal proteins are rapidly turned over by the proteasome in the nucleolus of human cells (Lam et al., 2007). Other important clues have emerged more recently, including the observation that an unknown posttranslational compensatory mechanism restricts accumulation of ribosomal proteins encoded on supernumerary chromosomes in aneuploid yeast cells (Dephoure et al., 2014).
Given the extraordinary level of resources that eukaryotic cells commit to ribosome production (Warner, 1999), we reasoned that the pathway that degrades unassembled or misassembled ribosomal proteins could be one of the most important QC pathways in eukaryotes. Accordingly, we set out to characterize the basic features of this pathway. We show here that overexpressed ribosomal proteins of both the large and small subunits are degraded by the UPS and not by the autophagy pathway that degrades ribosomes in starved cells. Our data indicate that unassembled ribosomal proteins are largely confined to the nucleus, where they accumulate as ubiquitin-conjugated species upon chemical or genetic inhibition of the proteasome. This distinguishes the ubiquitination pathway involved in marking excess ribosomal proteins from a recently described pathway that ubiquitinates ribosomal proteins in response to endoplasmic reticulum stress (Higgins et al., 2015). In that case, ubiquitination selectively occurs in the cytoplasm on proteins that are assembled into 40S subunits.
We propose that degradation of unassembled ribosomal proteins is constantly occurring in wild-type cells. It seems inescapable that there will be modest stoichiometric imbalances in the production of ribosomal proteins because there is no known mechanism in eukaryotic cells that could enable the production of exactly the same number of all 79 ribosomal proteins. In addition, synthesis of defective, assembly-incompetent proteins (e.g., due to misincorporation events in transcription or translation) and errors in the assembly process should yield additional QC substrates. These QC events are normally not detected because the unassembled proteins are almost instantly degraded. However, upon inhibition of the proteasome, we observed robust accumulation of many ribosomal proteins in an insoluble fraction, and this was suppressed by coinhibition of protein synthesis. Taken together, these observations suggest that newly synthesized ribosomal proteins that fail to assemble form insoluble aggregates. Of interest, microscopic analysis of overexpressed Rpl26-GFP in pre9∆ cells typically revealed a focal signal overlaid on a diffuse background of nuclear staining. This suggests that if an unassembled ribosomal protein escapes degradation, it assembles into a sedimentable aggregate, possibly the recently described intranuclear quality control compartment (Miller et al., 2015). Although we cannot exclude the possibility that bortezomib itself induces ribosome misassembly, we note that ribosomal proteins are among the most prominent ubiquitin-conjugated proteins in log-phase yeast cells (Mayor et al., 2005, 2007). Similarly, ribosomal proteins contain a substantial fraction of the ubiquitination sites identified in K-ε-GG profiling experiments in both yeast (Porras-Yakushi et al., 2015) and human (Higgins et al., 2015) cells.
A number of questions remain to be addressed in future work. Specifically, are excess ribosomal proteins ubiquitinated in the nucleolus and then exported to the nucleoplasm for degradation, or are they first released to the nucleoplasm and then ubiquitinated? Does one ubiquitination pathway process all excess ribosomal subunits, or are there multiple, possibly even redundant pathways? How is it possible that the quality control mechanism can correctly identify virtually any unassembled ribosomal protein and yet maintain a high degree of specificity by ignoring the very same proteins when they are correctly assembled? The answers to these questions will lift the veil on what may be one of the most important, highest-flux quality control pathways in the cell.
MATERIALS AND METHODS
Yeast strains and growth conditions
All yeast strains used in this study (Supplemental Table S1) were derived from BY4741 (MATa his3∆1 leu2∆0 met15∆0 ura3∆0). Yeast transformation was performed by the lithium acetate method (Gietz and Schiestl, 2007). All transformants were verified by auxotrophic selection or genomic PCR. Yeast was grown at 30°C in yeast extract/peptone/dextrose or appropriate synthetic complete (SC) drop-out medium. For ectopic expression of proteins from the GAL1 or GAL10 promoter, cells grown in raffinose-containing medium were treated with 2% galactose for 60–90 min. Note that experiments were initiated with cells at OD600 = 3.0 because the QC pathway for unassembled ribosomal proteins was more prominent in cells at mid log phase (OD600 ≈ 3.0) then with early log phase (OD600 ≈ 1.0) (unpublished data).
Plasmid construction
All plasmids used in this study are listed in Supplemental Table S2. To construct pESC(HIS)-PGAL10-RPL26A-FLAG (RDB 3124), the ∼825–base pair PCR product obtained using genomic DNA as a template, forward primer 5′-CAG TCG AAT TCA TGG CTA AAC AAT CAT TAG GTA TGT GCA CAA ATG CTA AAT-3′, and reverse primer 5′-GTC AGC GGC CGC TTC CAA CTT ACC GCC CTT TCT TTG GAT CAA AGC TTT TCT G-3′ was digested with EcoRI and NotI and ligated into EcoRI–NotI-digested pESC(HIS) (Agilent Technologies, Santa Clara, CA), thus generating pESC(HIS)-PGAL10-RPL26A-FLAG.
To construct pESC(HIS)-PGAL10-RPL26A-GFP (RDB 3125), the ∼715–base pair PCR product obtained using pFA6a-GFP-His3MX6 (Longtine et al., 1998) as a template, forward primer 5′-ATT CAT GAT CGA TCA GTA AAG GAG AAG AAC TTT-3′, and reverse primer 5′-CAG TCT TAA TTA ACT ATT TGT ATA GTT CAT CCA-3′ was digested with ClaI and PacI and ligated into ClaI–PacI-digested pESC(HIS)-PGAL10-RPL26A-FLAG, generating pESC(HIS)-PGAL10-RPL26A-GFP by replacing the FLAG tag with the GFP coding sequence.
Subcellular fractionation of yeast cells
Subcellular fractionation was performed as described (Keogh et al., 2006). One hundred OD600 units of cells grown in rich medium (OD600 ≤ 1.0) were collected by centrifugation and then treated with 200 U of Zymolyase for 1 h at 30°C in 1 ml of SB buffer (1 M sorbitol, 20 mM Tris-HCl, pH 7.5, 10 mM β-mercaptoethanol). Spheroplasts collected by centrifugation (2000 rpm for 5 min at 4°C) were washed twice with SB buffer and then resuspended in 500 μl of EBX buffer (20 mM Tris-HCl, pH 7.5, 100 mM NaCl, 0.25% Triton X-100, 15 mM β-mercaptoethanol, and protease inhibitor cocktail [EDTA-free; Roche, Basel, Switzerland]). An aliquot was taken and used as a total cell extract, and the remainder of the lysate was layered over 1 ml of NIB buffer (20 mM Tris-HCl, pH 7.5, 100 mM NaCl, 1.2 M sucrose, 15 mM β-mercaptoethanol, and protease inhibitor cocktail [EDTA-free; Roche]) and centrifuged (12,000 rpm for 15 min at 4°C in an Eppendorf Centrifuge 5430R). A sample of the upper soluble fraction was taken and used as cytosol and the rest of the supernatant discarded. The glassy white nuclear pellet was suspended in 500 μl of EBX buffer and kept on ice for 10 min with gentle mixing, and an aliquot was taken and used as the nuclear fraction. A 2× SDS–PAGE loading buffer was added to each fraction, and samples were incubated at 95°C for 5 min and then subjected to SDS–PAGE and Western analyses.
Microscopic analysis
Yeast cells grown in raffinose-containing SC medium at 30°C (OD600 ≤ 1.0) were induced with galactose for 1 h to express Rpl26a-GFP and placed in 384-well glass-bottom microplates (Whatman, Maidstone, UK) pretreated with concanavalin A (L7647; Sigma-Aldrich, St. Louis, MO) to ensure cell adhesion. Fluorescence images were taken using a Zeiss Axiovert 200M Inverted Microscope with a fluorescein isothiocyanate filter set (excitation band pass filter, 450–490 nm; beam splitter, 510 nm; emission band pass filter, 515–565 nm) and a rhodamine filter set (excitation band pass filter, 546 nm; beam splitter, 580 nm; emission long pass filter, 590 nm). We analyzed at least 50 cells and reconfirmed subcellular localization of GFP-fused proteins by colocalization assay as described previously (Huh et al., 2003).
Preparation of samples for immunoblotting
For denatured samples, yeast cells were harvested, washed two times with phosphate-buffered saline, and boiled in 2× SDS-containing sample buffer for 5 min, followed by brief bead beating. For nondenatured samples, yeast cells were harvested and disrupted by bead beating in lysis buffer (50 mM Tris-HCl, pH 7.5, 150 mM NaCl, 1% Triton X-100, and protease inhibitor cocktail [EDTA-free; Roche]). Cell debris was removed by centrifuging at 3000 rpm for 5 min, and the remaining cell extract was centrifuged at 12,000 rpm for 10 min in an Eppendorf Centrifuge 5430R. After centrifugation, the supernatant was transferred to a new tube and mixed with SDS–PAGE sample buffer.
Antibodies
Anti-Rpl3 and anti-Rpl30/Rps2 were generous gifts from Jonathan Warner (Albert Einstein College of Medicine). Anti-GFP (632375; 1:10,000 dilution) was from Clontech (Mountain View, CA), anti-FLAG (F1804; 1:10,000 dilution) was from Sigma-Aldrich, anti-hexokinase (H2035-02; 1:10,000 dilution) was from USBiological (Salem, MA), anti–histone H3 (ab1791; 1:5000 dilution) was from Abcam (Cambridge, UK), anti-HA (SC-7392; 1:5000 dilution) was from Santa Cruz Biotechnology (Dallas, TX), and anti-ubiquitin (05-944; 1:5000 dilution) was from EMD Millipore (Temecula, CA). For secondary antibody, horseradish peroxidase (HRP)–conjugated anti-rabbit immunoglobulin G (IgG; A6154; 1:10,000 dilution) and HRP-conjugated anti-mouse IgG (M8770; 1:10,000 dilution) were from Sigma-Aldrich, and IR680RD-conjugated anti-rabbit (926-68071; 1:10,000 dilution) and IR800CW-conjugated anti-mouse (926-32210; 1:10,000 dilution) were from LI-COR Biotechnology (Lincoln, NE).
Quantification of RPL26A mRNA
Total RNA was isolated from yeast cells using TRIzol (15596-026; Invitrogen, Carlsbad, CA). cDNA for reverse transcription (RT)-PCR was generated using the Reverse Transcription System (A3500; Promega, Madison, WI). The amounts of RPL26A and ACT1 mRNA were analyzed by quantitative real-time RT-PCR using the Applied Biosystems StepOnePlus Real-Time PCR System. Amplification efficiencies were validated and normalized against ACT1, and fold increases were calculated using the 2−ΔΔCT method (Livak and Schmittgen, 2001). The primers used for the amplification of RPL26A were 5′-TCC AAG AAG GGT CAA GAA GG-3′ and 5′-GGA TCA AAG CTT TTC TGT CC-3′, and those used for ACT1 were 5′ TGA CTG ACT ACT TGA TGA AG-3′ and 5′-TGC ATT TCT TGT TCG AAG TC-3′. All reactions were carried out in triplicate.
Sucrose gradient and polysome profiling
Sucrose gradient and polysome profiling were performed as described (Verma et al., 2013). Yeast cells were grown to logarithmic phase in rich medium supplemented with glucose or raffinose at 30°C and treated with cycloheximide (100 μg/ml) for 15 min before cell lysis to stabilize polysomes. One hundred OD600 units of cells were harvested and disrupted by bead beating in lysis buffer (0.5 mM dithiothreitol [DTT], 100 μg/ml cycloheximide, 200 μg/ml heparin, 20 mM Tris-HCl, pH 7.5, 140 mM KCl, 5 mM MgCl2, and protease inhibitor cocktail [EDTA-free; Roche]). Cell debris was removed by centrifuging at 3000 rpm for 5 min, and the remaining cell extract was centrifuged at 12,000 rpm for 10 min in an Eppendorf Centrifuge 5430R. Twenty-five A260 units of cell lysate layered on 7–47% discontinuous sucrose gradient prepared in buffer (1 mM DTT, 140 mM KCl, 20 mM Tris-HCl, pH 7.5, and 5 mM MgCl2) were centrifuged in SW55Ti rotor for 90 min at 50,000 rpm. For polysome profiling analysis, we fractionated samples while continuously recording the absorbance at 254 nm with an ultraviolet detector (ISCO, Lincoln, NE). For Western blot, 0.2-ml fractions collected from the top were treated with 0.02% sodium deoxycholate for 30 min on ice and then precipitated by adding trichloroacetic acid to 10% final concentration for 1 h. Pellets were washed with ice-cold acetone and then resuspended in 2× SDS-containing sample buffer.
Isolation of protein aggregates
Isolation of protein aggregates from yeast cells was performed as described previously (Koplin et al., 2010) with slight modifications. One hundred OD600 units of exponentially growing cells in an appropriate medium were harvested, and cell pellets were frozen in liquid N2. The cell pellets were resuspended in 1 ml lysis buffer (20 mM Na phosphate, pH 6.8, 10 mM DTT, 1 mM EDTA, 0.1% Tween, 1 mM phenylmethylsulfonyl fluoride [PMSF], protease inhibitor cocktail, and 100 U/ml Zymolyase) and incubated at 30°C for 30 min. Chilled samples were treated by tip sonication (20%, 10 s, twice) and centrifuged for 20 min at 600 × g at 4°C. Supernatants were adjusted to identical protein concentrations, and aggregated proteins were pelleted at 16,000 × g for 20 min at 4°C. After removal of supernatants, aggregated proteins were washed once with wash I buffer (20 mM Na phosphate, pH 6.8, 500 mM NaCl, 5 mM EDTA, 2% NP-40, 1 mM PMSF, and protease inhibitor cocktail) and centrifuged at 16,000 × g for 20 min at 4°C. Aggregated proteins were washed twice with wash II buffer (20 mM Na phosphate, pH 6.8) and sonicated (10%, 10 s, twice) in 40 μl of wash II buffer. A 10-μl amount of SDS sample buffer was added to aggregate samples, and proteins are separated by SDS–PAGE (4–20%), and analyzed by Coomassie blue staining and immunoblotting.
Binding to UBA columns and Usp2 treatment
Immunoprecipitation of ubiquitin conjugates was performed as described, with some modifications (Verma et al., 2013). TUBE2-UBA resin (AM-130; Boston Biochem, Cambridge, MA) was used to bind polyubiquitinated substrates. One hundred OD600 units of cells were harvested and disrupted by bead beating in 500 μl of lysis buffer (20 mM Tris-HCl, pH 7.5, 150 mM NaCl, 1 mM EDTA, 10% glycerol, 5 mM N-ethylmaleimide [NEM], 1% Triton X-100, and protease inhibitor cocktail [EDTA-free; Roche]). Cell debris was removed by centrifuging at 3000 rpm for 5 min, and the remaining cell extract was centrifuged at 12,000 rpm for 10 min in an Eppendorf Centrifuge 5430R. A 30-μl amount of TUBE2-UBA resin incubated overnight was washed three times with buffer (20 mM Tris-HCl, pH 8.0, 150 mM NaCl, 0.5% Triton X-100). A 50-μl 2× SDS-containing sample buffer was added to the resin and boiled for 5 min. Note that unmodified proteins can also potentially bind due to indirect interactions with ubiquitinated proteins. For Usp2 treatment, TUBE2-UBA resin prepared as described was washed twice with 1× ubiquitin reaction buffer (50 mM Tris-HCl, pH 8.0, 10 mM MgCl2, 0.2 mM CaCl2, and 1 mM DTT) and mixed with 1 μM Usp2 (E-504; BostonBiochem) at 30°C for 1 h.
Mass spectrometry analyses of protein aggregates
Insoluble protein pellets were solubilized in an 8 M urea buffer (40 mM Tris, 65 mM DTT, 100 mM ammonium bicarbonate) containing cOmplete Protease Inhibitor Cocktail (Roche) and sonicated for 10 s at 10% of maximum amplitude using a Branson Digital Sonifier. Samples were digested and prepared for mass spectrometry as described in Pierce et al. (2013). A 150-ng amount of digested peptides from btz-treated cells and an equal volume of peptides from untreated cells were analyzed using an EASY-nLC 1000 coupled to an Orbitrap Fusion. Spectra were analyzed by MaxQuant (version 1.5.3.30). Digested peptides were loaded onto a 26-cm analytical HPLC column (75 μm inner diameter) packed in-house with ReproSil-Pur C18AQ 1.9-μm resin (120-Å pore size; Dr. Maisch, Ammerbuch, Germany). After loading, the peptides were separated with a 120-min gradient at a flow rate of 350 nl/min at 50°C (column heater) using the following gradient: 2–6% solvent B (7.5 min), 6–25% B (82.5 min), 25–40% B (30 min), 40–100% B (1 min), and 100% B (9 min), where solvent A was 97.8% H2O, 2% ACN, and 0.2% formic acid, and solvent B was 19.8% H2O, 80% ACN, and 0.2% formic acid. The Orbitrap Fusion was operated in data-dependent acquisition mode to automatically switch between a full scan (m/z = 350–1500) in the Orbitrap at 120,000 resolving power and an MS/MS scan of higher-energy collisional dissociation fragmentation detected in the ion trap (using TopSpeed). The automatic gain control (AGC) targets of the Orbitrap and ion trap were 400,000 and 10,000, respectively.
Data analysis
Raw data were searched using MaxQuant (version 1.5.3.30; Cox and Mann, 2008; Wagner et al., 2011) against the Saccharomyces Genome Database (SGD) (5911 entries) and a contaminant database (259 entries). Precursor mass tolerance was 4.5 ppm after automatic recalibration. Fragment ion tolerance was 0.5 Da. Trypsin was specified as the digestion enzyme with up to two missed cleavages allowed. Oxidation of methionine and protein N-terminal acetylation were specified as variable modifications, and carbamidomethylation of cysteine was specified as a fixed modification. iBAQ protein quantitation and “match between runs” were enabled. Protein and peptide false discovery rates were estimated to be <1% using a target-decoy approach.
For each pair of btz-treated and nontreated (NC) samples, the difference between iBAQ abundances (ΔiBAQ) was used to identify the proteins that were most accumulated in the insoluble fraction after treatment with btz. The average difference between btz-treated and NC samples across the three replicates was then used to identify the top 10% of proteins most accumulating. This set of 127 proteins was checked for annotation enrichment against all proteins identified in the sample using DAVID (Huang et al., 2009a, b). The most enriched terms included GO FAT cellular component annotations “ribosome” (p < 2E-9) and “mitochondrion” (p < 2E-5). The distribution of average ΔiBAQ values for all proteins and for proteins with those annotations is given in Figure 7C. The individual ribosomal protein ΔiBAQ values are displayed in Supplemental Figure S3C, with error bars indicating SEM. Distributions of average ΔiBAQ values for large and small ribosomal subunits are compared with nonribosomal proteins in Supplemental Figure S3D.
Supplementary Material
Acknowledgments
We are grateful to members of the Deshaies laboratory for helpful advice and Rati Verma for critical reading of the manuscript and numerous helpful suggestions regarding biochemical experiments. We thank Jonathan Warner for generously providing reagents and helpful discussions. This work was supported by the Gordon and Betty Moore Foundation through Grant GBMF775 and the Beckman Institute (to S.H.) and National Institutes of Health Grant F32 GM112308 (to J.R.). R.J.D. is an Investigator of the Howard Hughes Medical Institute, which supported this work.
Abbreviations used:
- AGC
automatic gain control
- BTZ
bortezomib
- GFP
green fluorescent protein
- HHZ
hexahistidine-hemagglutinin protein A ZZ domain
- iBAQ
intensity-based absolute quantification
- mRFP
monomeric red fluorescent protein
- MS
mass spectrometry
- MW
molecular weight
- NC
non treated cells
- PQC
protein quality control
- QC
quality control
- SC
synthetic complete
- SGD
Saccharomyces Genome Database
- WT
wild type.
Footnotes
This article was published online ahead of print in MBoC in Press (http://www.molbiolcell.org/cgi/doi/10.1091/mbc.E16-05-0290) on July 6, 2016.
REFERENCES
- Abovich N, Gritz L, Tung L, Rosbash M. Effect of Rp51 gene dosage alterations on ribosome synthesis in Saccharomyces-cerevisiae. Mol Cell Biol. 1985;5:3429–3435. doi: 10.1128/mcb.5.12.3429. [DOI] [PMC free article] [PubMed] [Google Scholar]
- Babiano R, Gamalinda M, Woolford JL, Jr, de la Cruz J. Saccharomyces cerevisiae ribosomal protein L26 is not essential for ribosome assembly and function. Mol Cell Biol. 2012;32:3228–3241. doi: 10.1128/MCB.00539-12. [DOI] [PMC free article] [PubMed] [Google Scholar]
- Belle A, Tanay A, Bitincka L, Shamir R, O’Shea EK. Quantification of protein half-lives in the budding yeast proteome. Proc Natl Acad Sci USA. 2006;103:13004–13009. doi: 10.1073/pnas.0605420103. [DOI] [PMC free article] [PubMed] [Google Scholar]
- Bengtson MH, Joazeiro CA. Role of a ribosome-associated E3 ubiquitin ligase in protein quality control. Nature. 2010;467:470–473. doi: 10.1038/nature09371. [DOI] [PMC free article] [PubMed] [Google Scholar]
- Ben-Shem A, de Loubresse NG, Melnikov S, Jenner L, Yusupova G, Yusupov M. The structure of the eukaryotic ribosome at 3.0 angstrom resolution. Science. 2011;334:1524–1529. doi: 10.1126/science.1212642. [DOI] [PubMed] [Google Scholar]
- Brandman O, Stewart-Ornstein J, Wong D, Larson A, Williams CC, Li GW, Zhou S, King D, Shen PS, Weibezahn J, et al. A ribosome-bound quality control complex triggers degradation of nascent peptides and signals translation stress. Cell. 2012;151:1042–1054. doi: 10.1016/j.cell.2012.10.044. [DOI] [PMC free article] [PubMed] [Google Scholar]
- Cox J, Mann M. MaxQuant enables high peptide identification rates, individualized p.p.b.-range mass accuracies and proteome-wide protein quantification. Nat Biotechnol. 2008;26:1367–1372. doi: 10.1038/nbt.1511. [DOI] [PubMed] [Google Scholar]
- Defenouillere Q, Yao Y, Mouaikel J, Namane A, Galopier A, Decourty L, Doyen A, Malabat C, Saveanu C, Jacquier A, et al. Cdc48-associated complex bound to 60S particles is required for the clearance of aberrant translation products. Proc Natl Acad Sci USA. 2013;110:5046–5051. doi: 10.1073/pnas.1221724110. [DOI] [PMC free article] [PubMed] [Google Scholar]
- Dephoure N, Hwang S, O’Sullivan C, Dodgson SE, Gygi SP, Amon A, Torres EM. Quantitative proteomic analysis reveals posttranslational responses to aneuploidy in yeast. eLife. 2014;3:e03023. doi: 10.7554/eLife.03023. [DOI] [PMC free article] [PubMed] [Google Scholar]
- Eisele F, Wolf DH. Degradation of misfolded protein in the cytoplasm is mediated by the ubiquitin ligase Ubr1. FEBS Lett. 2008;582:4143–4146. doi: 10.1016/j.febslet.2008.11.015. [DOI] [PubMed] [Google Scholar]
- Gardner RG, Nelson ZW, Gottschling DE. Degradation-mediated protein quality control in the nucleus. Cell. 2005;120:803–815. doi: 10.1016/j.cell.2005.01.016. [DOI] [PubMed] [Google Scholar]
- Geiger T, Wehner A, Schaab C, Cox J, Mann M. Comparative proteomic analysis of eleven common cell lines reveals ubiquitous but varying expression of most proteins. Mol Cell Proteomics. 2012;11:M111.014050. doi: 10.1074/mcp.M111.014050. [DOI] [PMC free article] [PubMed] [Google Scholar]
- Gietz RD, Schiestl RH. High-efficiency yeast transformation using the LiAc/SS carrier DNA/PEG method. Nat Protoc. 2007;2:31–34. doi: 10.1038/nprot.2007.13. [DOI] [PubMed] [Google Scholar]
- Gorenstein C, Warner JR. Synthesis and turnover of ribosomal-proteins in absence of 60s subunit assembly in Saccharomyces cerevisiae. Mol Gen Genet. 1977;157:327–332. doi: 10.1007/BF00268670. [DOI] [PubMed] [Google Scholar]
- Grousl T, Ivanov P, Frydlova I, Vasicova P, Janda F, Vojtova J, Malinska K, Malcova I, Novakova L, Janoskova D, et al. Robust heat shock induces eIF2alpha-phosphorylation-independent assembly of stress granules containing eIF3 and 40S ribosomal subunits in budding yeast, Saccharomyces cerevisiae. J Cell Sci. 2009;122:2078–2088. doi: 10.1242/jcs.045104. [DOI] [PubMed] [Google Scholar]
- Heck JW, Cheung SK, Hampton RY. Cytoplasmic protein quality control degradation mediated by parallel actions of the E3 ubiquitin ligases Ubr1 and San1. Proc Natl Acad Sci USA. 2010;107:1106–1111. doi: 10.1073/pnas.0910591107. [DOI] [PMC free article] [PubMed] [Google Scholar]
- Higgins R, Gendron JM, Rising L, Mak R, Webb K, Kaiser SE, Zuzow N, Riviere P, Yang B, Fenech E, et al. The unfolded protein response triggers site-specific regulatory ubiquitylation of 40s ribosomal proteins. Mol Cell. 2015;59:35–49. doi: 10.1016/j.molcel.2015.04.026. [DOI] [PMC free article] [PubMed] [Google Scholar]
- Huang DW, Sherman BT, Lempicki RA. Bioinformatics enrichment tools: paths toward the comprehensive functional analysis of large gene lists. Nucleic Acids Res. 2009a;37:1–13. doi: 10.1093/nar/gkn923. [DOI] [PMC free article] [PubMed] [Google Scholar]
- Huang DW, Sherman BT, Lempicki RA. Systematic and integrative analysis of large gene lists using DAVID bioinformatics resources. Nat Protoc. 2009b;4:44–57. doi: 10.1038/nprot.2008.211. [DOI] [PubMed] [Google Scholar]
- Huh WK, Falvo JV, Gerke LC, Carroll AS, Howson RW, Weissman JS, O’Shea EK. Global analysis of protein localization in budding yeast. Nature. 2003;425:686–691. doi: 10.1038/nature02026. [DOI] [PubMed] [Google Scholar]
- Keogh MC, Kim JA, Downey M, Fillingham J, Chowdhury D, Harrison JC, Onishi M, Datta N, Galicia S, Emili A, et al. A phosphatase complex that dephosphorylates gamma H2AX regulates DNA damage checkpoint recovery. Nature. 2006;439:497–501. doi: 10.1038/nature04384. [DOI] [PubMed] [Google Scholar]
- Koplin A, Preissler S, Ilina Y, Koch M, Scior A, Erhardt M, Deuerling E. A dual function for chaperones SSB-RAC and the NAC nascent polypeptide-associated complex on ribosomes. J Cell Biol. 2010;189:57–68. doi: 10.1083/jcb.200910074. [DOI] [PMC free article] [PubMed] [Google Scholar]
- Kraft C, Deplazes A, Sohrmann M, Peter M. Mature ribosomes are selectively degraded upon starvation by an autophagy pathway requiring the Ubp3p/Bre5p ubiquitin protease. Nat Cell Biol. 2008;10:602–610. doi: 10.1038/ncb1723. [DOI] [PubMed] [Google Scholar]
- Kressler D, Hurt E, Bassler J. Driving ribosome assembly. Biochim Biophys Acta. 2010;1803:673–683. doi: 10.1016/j.bbamcr.2009.10.009. [DOI] [PubMed] [Google Scholar]
- Lam YW, Lamond AI, Mann M, Andersen JS. Analysis of nucleolar protein dynamics reveals the nuclear degradation of ribosomal proteins. Curr Biol. 2007;17:749–760. doi: 10.1016/j.cub.2007.03.064. [DOI] [PMC free article] [PubMed] [Google Scholar]
- Livak KJ, Schmittgen TD. Analysis of relative gene expression data using real-time quantitative PCR and the 2(-Delta Delta C(T)) method. Methods. 2001;25:402–408. doi: 10.1006/meth.2001.1262. [DOI] [PubMed] [Google Scholar]
- Longtine MS, McKenzie A, Demarini DJ, Shah NG, Wach A, Brachat A, Philippsen P, Pringle JR. Additional modules for versatile and economical PCR-based gene deletion and modification in Saccharomyces cerevisiae. Yeast. 1998;14:953–961. doi: 10.1002/(SICI)1097-0061(199807)14:10<953::AID-YEA293>3.0.CO;2-U. [DOI] [PubMed] [Google Scholar]
- Mayor T, Graumann J, Bryan J, MacCoss MJ, Deshaies RJ. Quantitative profiling of ubiquitylated proteins reveals proteasome substrates and the substrate repertoire influenced by the Rpn10 receptor pathway. Mol Cell Proteomics. 2007;6:1885–1895. doi: 10.1074/mcp.M700264-MCP200. [DOI] [PubMed] [Google Scholar]
- Mayor T, Lipford JR, Graumann J, Smith GT, Deshaies RJ. Analysis of polyubiquitin conjugates reveals that the Rpn10 substrate receptor contributes to the turnover of multiple proteasome targets. Mol Cell Proteomics. 2005;4:741–751. doi: 10.1074/mcp.M400220-MCP200. [DOI] [PubMed] [Google Scholar]
- Miller SB, Ho CT, Winkler J, Khokhrina M, Neuner A, Mohamed MY, Guilbride DL, Richter K, Lisby M, Schiebel E, et al. Compartment-specific aggregases direct distinct nuclear and cytoplasmic aggregate deposition. EMBO J. 2015;34:778–797. doi: 10.15252/embj.201489524. [DOI] [PMC free article] [PubMed] [Google Scholar]
- Nillegoda NB, Theodoraki MA, Mandal AK, Mayo KJ, Ren HY, Sultana R, Wu K, Johnson J, Cyr DM, Caplan AJ. Ubr1 and Ubr2 function in a quality control pathway for degradation of unfolded cytosolic proteins. Mol Biol Cell. 2010;21:2102–2116. doi: 10.1091/mbc.E10-02-0098. [DOI] [PMC free article] [PubMed] [Google Scholar]
- Pierce NW, Lee JE, Liu X, Sweredoski MJ, Graham RLJ, Larimore EA, Rome M, Zheng N, Clurman BE, Hess S, et al. Cand1 promotes assembly of new SCF complexes through dynamic exchange of F box proteins. Cell. 2013;153:206–215. doi: 10.1016/j.cell.2013.02.024. [DOI] [PMC free article] [PubMed] [Google Scholar]
- Porras-Yakushi TR, Sweredoski MJ, Hess S. ETD outperforms CID and HCD in the analysis of the ubiquitylated proteome. J Am Soc Mass Spectrom. 2015;26:1580–1587. doi: 10.1007/s13361-015-1168-0. [DOI] [PMC free article] [PubMed] [Google Scholar]
- Torres EM, Dephoure N, Panneerselvam A, Tucker CM, Whittaker CA, Gygi SP, Dunham MJ, Amon A. Identification of aneuploidy-tolerating mutations. Cell. 2010;143:71–83. doi: 10.1016/j.cell.2010.08.038. [DOI] [PMC free article] [PubMed] [Google Scholar]
- Torres EM, Sokolsky T, Tucker CM, Chan LY, Boselli M, Dunham MJ, Amon A. Effects of aneuploidy on cellular physiology and cell division in haploid yeast. Science. 2007;317:916–924. doi: 10.1126/science.1142210. [DOI] [PubMed] [Google Scholar]
- Vembar SS, Brodsky JL. One step at a time: endoplasmic reticulum-associated degradation. Nat Rev Mol Cell Biol. 2008;9:944–957. doi: 10.1038/nrm2546. [DOI] [PMC free article] [PubMed] [Google Scholar]
- Verma R, Oania RS, Kolawa NJ, Deshaies RJ. Cdc48/p97 promotes degradation of aberrant nascent polypeptides bound to the ribosome. eLife. 2013;2:e00308. doi: 10.7554/eLife.00308. [DOI] [PMC free article] [PubMed] [Google Scholar]
- Wagner SA, Beli P, Weinert BT, Nielsen ML, Cox J, Mann M, Choudhary C. A proteome-wide, quantitative survey of in vivo ubiquitylation sites reveals widespread regulatory roles. Mol Cell Proteomics. 2011;10:M111 013284. doi: 10.1074/mcp.M111.013284. [DOI] [PMC free article] [PubMed] [Google Scholar]
- Warner JR. In the absence of ribosomal RNA synthesis, the ribosomal proteins of HeLa cells are synthesized normally and degraded rapidly. J Mol Biol. 1977;115:315–333. doi: 10.1016/0022-2836(77)90157-7. [DOI] [PubMed] [Google Scholar]
- Warner JR. The economics of ribosome biosynthesis in yeast. Trends Biochem Sci. 1999;24:437–440. doi: 10.1016/s0968-0004(99)01460-7. [DOI] [PubMed] [Google Scholar]
- Warner JR, Mitra G, Schwindinger WF, Studeny M, Fried HM. Saccharomyces cerevisiae coordinates accumulation of yeast ribosomal proteins by modulating mRNA splicing, translational initiation, and protein turnover. Mol Cell Biol. 1985;5:1512–1521. doi: 10.1128/mcb.5.6.1512. [DOI] [PMC free article] [PubMed] [Google Scholar]
- Zhao Y, Macgurn JA, Liu M, Emr S. The ART-Rsp5 ubiquitin ligase network comprises a plasma membrane quality control system that protects yeast cells from proteotoxic stress. eLife. 2013;2:e00459. doi: 10.7554/eLife.00459. [DOI] [PMC free article] [PubMed] [Google Scholar]
Associated Data
This section collects any data citations, data availability statements, or supplementary materials included in this article.