

Abstract
Some de novo human mutations arise at frequencies far exceeding the genome average mutation rate. Examples are the common mutations at one or a few sites in the genes causing achondroplasia, Noonan syndrome, multiple endocrine neoplasia 2B and Apert syndrome. These mutations are recurrent, provide a gain of function, are paternally derived and are more likely transmitted as the father ages. Recent experiments tested whether the high mutation frequencies are due to an elevated mutation rate per cell division, as expected, or an advantage of the mutant spermatogonial stem cells over wild-type stem cells. The evidence, which includes the surprising discovery of testis mutation clusters, rejects the former model but not the latter. We propose how the mutations might alter spermatogonial stem cell function and discuss how germline selection contributes to the paternal age effect, the human mutational load and adaptive evolution.
Keywords: mutation frequency, mutational load, selective advantage, computational analysis, asymmetric and symmetric cell divisions
Introduction
A sizable burden of inherited mutations contributes to human morbidity and mortality throughout the world every generation (114). Most of this mutational load derives from the population’s standing variation. However, genetic disorders also result from de novo (new) mutations originating in parental germ cells prior to fertilization. These rare mutations provide the genetic variation that might lead to an important adaptation or offspring with a disorder, either immediately, or in later generations. The topic of this review focuses on single base genetic changes but in principle could apply to other types of mutational events.
The average human de novo germline mutation rate per generation (also mutation rate or mutation frequency, but distinct from mutation rate per cell division) at any nucleotide site has been estimated in a variety of different ways including direct whole genome DNA sequencing or NGS (reviewed in (5; 7; 94)). Each way provides a very similar nucleotide substitution frequency: for C>T mutations at CpG sites approximately ~10−7 and for mutations in other genomic contexts ~10−8–10−9. However, this per-base average over the whole sequenced genome is uninformative concerning the rates at any specific nucleotide site. To estimate the rate at a specific nucleotide by sequencing parents and their children requires a number of trios on the order of the reciprocal of the mutation rate.
Common features of some deleterious mutations with a high sporadic incidence
Despite the difficulty in measuring the mutation rate at specific sites, it has been known for some time that spontaneous mutations arise at some nucleotide sites orders of magnitude more frequently than expected from the genome average (a mutation hot spot). For example, achondroplasia (MIM #100800), with a sporadic incidence of 3–6 ×10⁻⁵ (100; 110) results overwhelmingly from one recurrent mutation (c.1138G>A, p.G380R) in the FGFR3 gene at the same cytosine in a CpG site (6; 90; 95) at a rate ~450 fold greater than expected (~4.5×10⁻⁵/10−7).
Achondroplasia has a number of important features in common with three additional disorders: Apert syndrome (MIM #101200), multiple endocrine neoplasia type 2B (MEN2B, MIM #162300) and Noonan syndrome (NS1, #163950). All the causal mutations are highly recurrent. The vast majority of Apert syndrome mutations arise at either one of two sites (80; 116) in FGFR2 (c.755C>G, p.S308W and c758C>G, p,P253R). Virtually every new MEN2B mutation (9; 32; 50) arises at the same site in RET (c.2943T>C, p.M918T). The PTPN11 mutation in the SHP-2 protein (c.922A>G, p.N308D) accounts for ~50% of all sporadic Noonan syndrome cases (102). Estimates of how much the recurrent mutations exceed the genome average mutation rate is based on what is known about the incidence of sporadic cases. Apert syndrome data suggest a 100–1,000 fold excess in mutation rate (38; 85) at the two sites. For MEN2B similar estimates were derived but with less certainty because of the state of the data on sporadic incidence (13). The Noonan syndrome c.922A>G mutation rate was calculated to be ~2,400 fold greater than the genome average (122).
In addition to their common high recurrence rate, only a single copy of these mutations is needed to cause the disorder (autosomal dominant transmission). Being gain of function mutations, when an affected child is born to unaffected parents it most likely is a de novo mutation in one of the parent’s germline. Also, these spontaneous mutations virtually always occur in the father’s germline (5; 18; 19; 36; 40; 88). Since there are more germline divisions after puberty in men than women, more new point mutations are expected to originate in the male than the female, nonetheless the magnitude of this bias is surprising (5; 25; 31; 93). Finally, older fathers are at greater risk for having affected children than younger fathers: the paternal age effect or PAE (5; 18; 19; 36; 40; 88).
The term RAMP, for Recurrent, Autosomal dominant, Male-biased, and Paternal age effect is an acronym for the above four characteristics (122). Others have classified these same mutations as leading to PAE disorders (40). Additional gene candidates for RAMP/PAE status have also been discussed previously (5; 18; 19; 36; 37; 40; 88).
Testing RAMP mutations for germline hot spot activity
We consider two approaches (38; 85) to test whether the high mutation frequency at the RAMP disease sites is due to an elevated mutation rate per cell division at these sites, the “hot spot” model. The second approach (38) will be discussed later. We first discuss the one (85) that examined the “molecular anatomy” of de novo RAMP mutations in the post-mortem testes of normal unaffected men not treated with fertility disturbing drugs or procedures. Whether any of the donors had a child with a RAMP disorder was not known, but given the incidence of these conditions, it is incredibly unlikely. The hot spot model predicts every spermatogonial stem cell (SSC) replication will have the same increased chance to produce the causal mutation. Assuming human SSC are uniformly distributed throughout the testis any new RAMP mutations should therefore also be uniformly distributed.
Testis dissection and mutation detection
To determine the spatial distribution of the de novo RAMP mutations each testis was dissected after removing the epididymis, cut into six approximately equal size slices across its long axis and each slice further divided into 32 pieces of approximately the same size. At this level of spatial resolution SSC are uniformly distributed (see Text S2 of (13) for details) among the testis pieces. DNA was isolated from each piece and each sample was assigned an “address” (i.e., slice 3, piece 24) that allowed reconstruction of the original three-dimensional distribution of any detected mutations.
Each DNA sample was tested for a specific RAMP mutation using an ultra-sensitive allele/mutation-specific version of PCR called PAP (61). By testing positive controls PAP can detect a single mutant molecule among 25,000 total genomes (4×10⁻⁵) (85). For each testis piece, enough separate reactions, each with 25,000 genomes, were performed so that a mutation frequency as low as 10−6 could be detected. The assay had an average false positive rate of 10−6–10−7 (85). The mutation frequency was estimated in all testis pieces and negative and positive controls accompanied all experiments. To accurately measure the mutation frequency in those testis pieces with frequencies sufficiently higher (85) limiting DNA dilutions were performed.
Apert syndrome mutation results
Figure 1 shows the c.755C>G mutation data on 14 normal individuals (15 testes total; testes 374-1 and 374-2 are from the same individual) ranging in age from 19–80 years (13; 85). Surprisingly, some testis pieces have mutation frequencies orders of magnitude higher than other pieces. The term “cluster” is used for any one piece, or series of adjacent pieces, that are exceptionally high. For example, consider testis 60891 from a 68 year old donor (middle column, last row). 95% of the testis pieces are colored light gray, indicating a mutation frequency less than 2.5×10⁻⁵. All of the mutants appear to be in two clusters (one in the third slice and the other in the fifth slice). The testis piece with the greatest mutation frequency (in the fifth slice, colored brown, second piece from the top) has a mutation frequency of 4.5×10⁻². The average mutation frequency for the whole testis is 8.6×10⁻⁴. The ratio of the maximum piece frequency to that of the average testis piece (Mx/Av) is 52. If all the testis pieces had the same mutation frequency this ratio would be 1. An additional statistic to measure clustering is the fraction of the testis containing 95% of the mutants (p95). For this testis the fraction is only 3.9%, whereas if the mutations were spatially uniform this fraction would be expected to be near 95%. Other testes from the middle-aged (36–68 years, middle column in Figure 1) and older donors (75–80 years old, right-hand column in Figure 1) show similar mutation frequencies and clustering patterns.
Figure 1.

Apert syndrome mutation (c.755C>G) distribution in 15 testes from normal men (13; 85). Each set of six black outlined rectangles represents a single testis cut into six slices, where each rectangle is a slice. The six slices are cut at right angles to the testis’ long axis. Each slice is divided into 32 pieces of four columns and eight rows (192 total pieces per testis). Young men’s testes (left), middle-aged (center) and older donors (right). The mutation frequency of each piece is coded by the heat map in the lower left part of the figure.
In contrast, the youngest individuals (19–23 years, left-hand column in Figure 1) exhibit much lower mutation frequencies. Indeed, for three of these four testes all of the pieces have mutation frequencies less than 2.5×10⁻⁵ (colored light gray); and the average mutation frequency for each of these testes is between 10−6 and 2×10⁻⁶. The fourth testis in this age group (59056, left-hand column, top row) has both a higher average mutation frequency (1.6×10⁻⁵) and maximum piece frequency (4×10⁻³, colored orange) than the other young testes, but these frequencies are on the low end compared to the middle-aged and older testes. The difference in age groups suggests that the disease mutations accumulate in the adult and are not an early embryonic mutation.
The spatial distribution was also studied for a presumably neutral CpG site (on a different chromosome) for testes 374-1 and 374-2 from a 62 year old donor (85). All of the testis pieces had mutation frequencies less than 2.5×10⁻⁵ (colored light gray). This observation suggests that whatever causes the mutation clusters at the RAMP sites, these sites are special since clusters are not observed at a random site using the same method.
Analysis of four additional RAMP mutations
The second Apert mutation (c.758C>G) was analyzed in six testes (12). Figure 2 shows the mutation distribution in the RET gene (c.2943T>C) causing MEN2B in 14 testes (13). The most common Noonan syndrome mutation in the PTPN11 gene (c.922A>G) was studied in 15 testes (122). The achondroplasia mutation in FGFR3 (c.1138G>A) was examined in one testis (97). The spatial distribution of all these RAMP mutations was similar to the data for the c.755C>G Apert syndrome mutation: for middle-aged testes the mutations formed clusters, and for testes in the youngest age group the mutation frequencies were much lower. One difference between the c.755C>G mutation and the other RAMP mutations is that for these other mutations some of the testes in the oldest age group have very low mutation frequencies similar to testes from the youngest age group (compare the right-hand columns of Figures 1 and 2). This difference will be discussed later.
Figure 2.

MEN2B mutation (c.2943T>C) distribution in 14 testes from normal men (13; 85). For further details see Figure 1.
All men become germline mosaics for multiple RAMP mutations as they age
Measuring the frequency of a number of different mutations in the same testes provides an estimate of an individual’s mutational load regarding these specific disorders. Figure 3 shows the anatomical distribution of the two Apert syndrome mutations, the MEN2B mutation and the most common Noonan mutation in both testes from one (62 year old) man. Analysis of the anatomical location of the clusters for each of the four different mutations shows that they arose independently ((12) and unpublished data).
Figure 3.
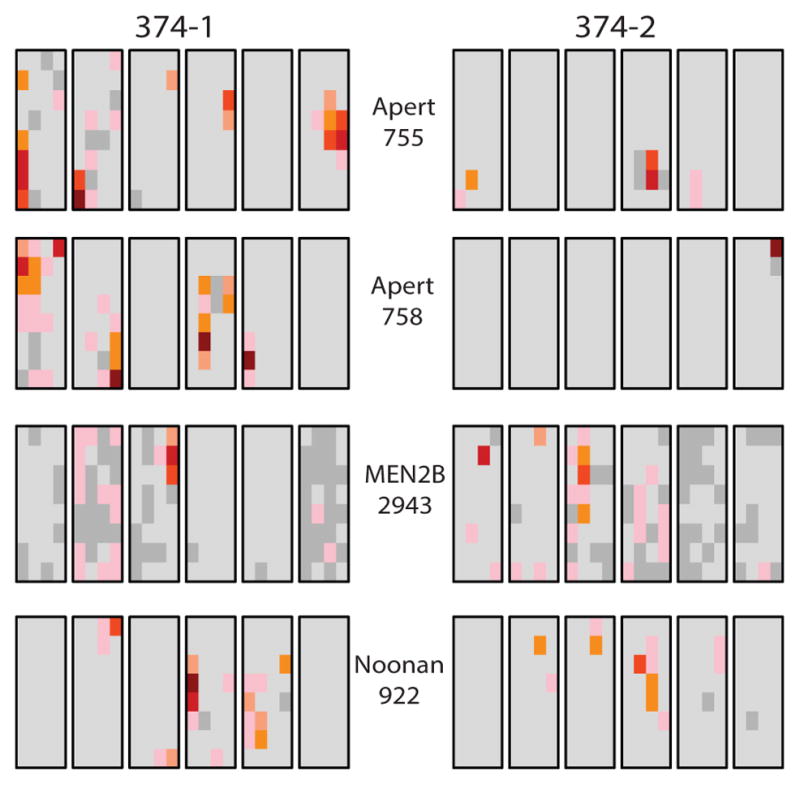
Mutation cluster data on four different RAMP mutations in both testes (374-1 and 374-2) from the same 62 year old donor. Four aliquots from each of the 192 testis pieces were used in assays to detect the Apert syndrome c.755C>G and c.758C>G, MEN2B c.2943T>C and the Noonan PTPN11 c.922A>G mutations (12; 13; 85; 122).
The cellular composition of mutation clusters
Humans have two classes of spermatogonia: undifferentiated and differentiating. The identification of human spermatogonial types is based on specialized nuclear staining (14–16; 29) and distinguishes two undifferentiated types: A-pale (Ap) and A-dark (Ad). Ap divide every 16 days (48) and are thought to be the self-renewing human SSC (also called SrAp). Ad are considered reserve stem cells with minimal cell cycling behavior. Non-human primate studies using autoradiography show that Ad are less susceptible to radiation damage than Ap and, in response to such damage, divide and generate replacement Ap cells; this may also be true in humans. The third human spermatogonial type, B spermatogonia, are derived from Ap cells and are committed to enter meiosis and produce sperm. Starting with one SrAp, a cohort of four B spermatogonia will eventually generate 16 sperm after meiosis and post-meiotic differentiation events. Critical for understanding mutation clusters is the fact that all of the meiotic and post-meiotic descendants stay in close proximity to their SrAp source until the sperm enter the lumen of the tubule and travel to the epididymis.
Although SrAp divide every 16 days (48), it takes 74 days (49) for sperm to enter the seminiferous tubule. So, before one cohort of sperm are released, the same SrAp cell has already started several additional generations of sperm production creating overlapping “generations” of different germline cell types (2).
The role of stem cell division type in mutation cluster formation
Two different schemes of SSC divisions are considered, asymmetric or symmetric (Figure 4), and will be discussed further later. Regardless of the specific mechanism of division a balance between the production of self-renewing cells and the production of cells that differentiate and produce sperm is essential to maintain fertility. The inability (compared to mice) to perform certain critical experiments in humans due to ethical, legal and technical constraints means that most knowledge about humans comes from histological analysis of testis biopsy samples. The only exception recorded is a 1963 experiment where 3H-thymidine was injected into the testes of prisoner-volunteers whose testes were biopsied over time and analyzed by autoradiography (48). That study provided the Ap cell division rate and a further analysis of this data determined the length of time from this division to the release of sperm into the lumen of the seminiferous tubule (42).
Figure 4.

Asymmetric and Symmetric SSC divisions. SSC are black, differentiated cells blue. An asymmetric SSC division produces two daughters: one SSC (self-renewal, SR) and the other committed to meiosis and sperm formation (differentiation, D). For the symmetric model there are two possible outcomes: two daughter SSCs or loss of the SSC through differentiation.
Mutation clusters and epididymal sperm
For both Apert syndrome mutations it was established that the average mutation frequency of each testis was similar to the epididymal sperm mutation frequency isolated from the same testis (12; 85). This observation suggests that the de novo RAMP mutation clusters produce enough mutant sperm to account for the high incidence of sporadic births with the particular RAMP disorder. Thus far it has not been possible to collect epididymal sperm to test the three other RAMP mutations but similar results to Apert syndrome would be expected.
Are the RAMP mutation data consistent with the hot spot model?
The RAMP mutations are clustered in the testes of middle-aged and older donors. This clustering is at odds with the uniform distribution predicted by the hot spot model. In order to rigorously test this idea, several computational models have been proposed for both the asymmetric (85) and symmetric (13) division schemes. These models are based on what is known about human germline development and maturation (17; 25; 29; 30; 48; 49; 52; 76; 106; 127). Later some variations to these models are considered.
All the models we will discuss have two phases: the growth phase and the adult phase. The growth phase models germline development from zygote formation to puberty. During this phase the germ cells divide symmetrically and increase in number exponentially. A mutation early in this phase can lead to a “mutation jackpot” similar to those in bacteria (62). Since germ cells are expected to remain physically close to their ancestors such a jackpot could produce a mutation cluster.
The growth phase germ cells eventually form the adult phase SrAp. Beginning at puberty, these SrAp divide approximately every 16 days (48) providing many more opportunities for new mutations throughout a man’s life. The two hot spot models differ in how they model this adult phase. In the asymmetric model, the SrAp cells divide asymmetrically to form one SrAp cell and one differentiated B spermatogonia (which after a few divisions initiates the steps required for sperm formation). In this model a mutation in the adult phase only persists in one stem cell lineage, so should not form a mutation cluster.
In the symmetric model, randomly half of the SrAp cells divide symmetrically to form two SrAp cells while the other half form differentiated cells (these stem cell lineages terminate). The balance between self-renewal and differentiation means that, like in the asymmetric model, the number of SrAp remains constant and there is continuing production of sperm throughout the man’s life. However, unlike in the asymmetric model, a SrAp mutation in the symmetric model can be followed by several symmetric divisions leading to growth of a mutation cluster in the adult. Nonetheless, if, as is likely, some or all of these mutated SrAp later differentiate then this cluster can diminish or even disappear.
Testing the hot spot model
In order to test the models, the parameter values that best match the average mutation frequency observed in each testis is inferred by computer simulations (12; 13; 85; 96; 122). The hot spot model is simulated many times with each testis’ parameter values. In order to quantify the mutation clustering observed in the testis, several summary statistics have been introduced: the ratio of the maximum testis piece mutation frequency to the average mutation frequency for the entire testis (Mx/Av) and the fraction of the testis containing 95% of the mutants (p95). For those simulations with average mutation frequencies close to the average observed in the testis, the clustering statistics for the simulations are compared to the clustering statistics observed in the testis. This procedure is repeated separately for each testis and RAMP mutation combination.
For example, consider the Noonan syndrome c.922A>G mutation in testis 374-2 (see Figure 3 for testis data). The Mx/Av value is 62 and the p95 value is 4.7%. The symmetric hot spot model has one free parameter: the mutation rate per cell division. Figure 5A shows the histogram of simulated Mx/Av statistics. Since in over one million simulations this statistic is always less than the value observed in the testis, the symmetric hot spot model is strongly rejected with p-value less than 10−6. Figure 5B shows similar results for the p95 statistic. The symmetric hot spot model was also rejected for the other testes with Noonan syndrome mutation clusters, and similarly for the other RAMP mutations ((13; 96; 122) and unpublished data).
Figure 5.
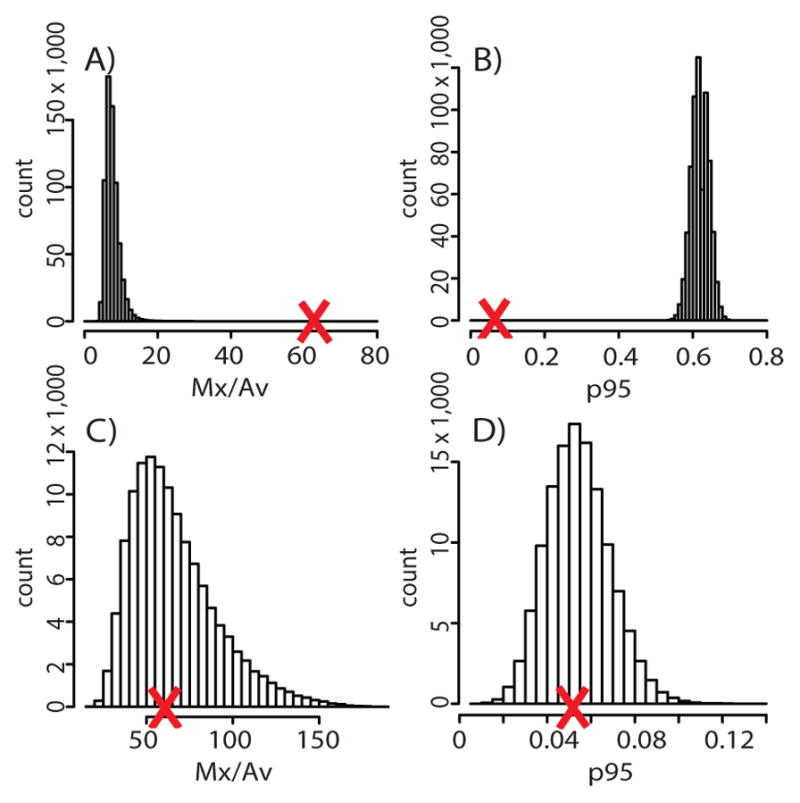
(A) Histogram of simulations of the symmetric hot spot model using data on the Noonan c.922A>G mutation from testis 374-2. The X-axis shows the Mx/Av summary statistic and the Y-axis the number (count) of simulations that gave that value. The large red X indicates the Mx/Av value observed in the testis. Since this value is greater than one million simulated values, the symmetric hot spot model is rejected with p-value < 10−6. (B) The same as (A) except the p95 statistic was used. (C) The same as (A) except the symmetric selection model was simulated. Since the observed Mx/Av statistic (large red X) is not in the extremes of the simulated statistics the symmetric selection model is not rejected. (D) The same as (C) but the p95 statistic was used.
Likewise, the asymmetric hot spot model was rejected (12; 13; 85; 96; 122). The asymmetric hot spot can also be rejected by another argument. In the asymmetric model, mutation clusters can only grow during the growth phase (not during the adult phase). But the testes in the younger donors do not have mutation clusters, only middle-aged and older testes have clusters, indicating that the clusters grew in the adult (not during the growth phase).
The selection models
Both the asymmetric and symmetric models have been modified to incorporate germline selection (also called selfish spermatogonial selection (38)). In each case, in addition to the mutation rate per cell division parameter, there is a second parameter for selection. Selection is modeled differently depending on whether SSC divisions are asymmetric or symmetric. For the asymmetric selection model (85) mutant SrAp (but not wild-type SrAp) in the adult phase may occasionally divide symmetrically, a plasticity known from other stem cell systems (56; 57; 68). Since the mutant daughter cells (who also can occasionally divide symmetrically) stay near their mutant ancestors, mutation clusters can grow in the adult.
The symmetric selection model (122) modifies the symmetric hot spot model, also by upsetting the balance between self-renewal and differentiation. For wild-type SrAp the ratio of self-renewal to differentiation events is still 50:50, but for mutant SrAp this ratio slightly favors self-renewal. This modification makes mutation clusters more likely to grow and persist.
Both selection models were tested statistically the same way as the hot spot models. As an example, consider the symmetric selection model and testis 374-2 for the Noonan syndrome mutation (c.922A>G). Figures 5C and 5D show that the Mx/Av and p95 statistics, respectively, are not in the extremes of the simulated statistics. Consequently, the symmetric selection model could not be rejected. Similarly for all the testes and RAMP mutations, the symmetric and asymmetric selection models could not be rejected ((12; 13; 85; 96; 122) and unpublished data). The parameters inferred from these analyses provide insight into two important features of germline selection, the mutation rate and selection coefficient.
First for both selection models the inferred value of the mutation rate per cell division parameter corresponds to the known genome average mutation rate per generation (reviewed in (5; 7; 94)) and the number of germline cell divisions for an individual that age (2). This implies that the RAMP mutations do not arise more frequently than at typical sites and that it is selection that increases the disease mutation frequencies. Moreover, with this mutation rate per cell division both symmetric and asymmetric models predict that mutation clusters will be unlikely in the younger donors (there have not been enough divisions for mutations to both arise and increase to high frequencies).
The second model parameter is the selection parameter, and for both models the inferred value of this bias is slight but sufficient to produce the observed mutation clusters. For the asymmetric selection model, ~1% of the mutant SrAp divisions are symmetric. Since these cells divide every 16 days, each mutant SrAp would divide symmetrically about once every four years. For the symmetric selection model, regarding the mutant SrAp, the ratio of self-renewal symmetric divisions to differentiation events is about 51:49.
Mutation cluster details
As discussed previously, each SrAp is associated with multiple overlapping generations of differentiated germ cells. Testis biopsies (127) revealed that for every SrAp there are approximately 21 differentiated germ cells (in various stages). Because the testis dissection and mutation studies measure DNA, and not cells, these counts can be converted into genomes after accounting for the ploidy of the different cell types. We calculated a total of 36 differentiated germ cell genomes for every SrAp cell. If the SrAp cell is mutated then 18 of these differentiated genomes will also harbor the mutation.
One can further calculate that there are 1.7 million SrAp cells, 43 million total cells, and 76 million genomes in each testis piece (127). If there is a single mutant SrAp cell in a testis piece (along with the 18 associated mutated differentiated germ cell genomes) then the mutation frequency for this testis piece will be 2.5×10⁻⁷. Such a low frequency is unlikely to be detected by the mutation assay employed above.
In Figures 1 and 2, the threshold frequency between the dark gray and pink colors is 5×10⁻⁵. To achieve this frequency, which is easily detectable by the assay, there must be approximately 200 mutant SrAp cells in the testis piece. This number of mutant SrAp can be reached by a combination of mutation events and symmetric divisions following any mutation event. If this number were attained by symmetric divisions following a single mutation event, then it would require the population of mutant SrAp cells to double 7.7 consecutive times. Similarly, for a testis piece to achieve a mutation frequency of 10−2 (the color with the highest frequency in Figures 1 and 2) it requires 40,000 mutant SrAp cells. And for a single mutation event to yield such a cluster requires 15.3 “doublings.”
By stochastic modeling (e.g., (26)) one can calculate interesting properties for the asymmetric selection model. Using the previous estimate that mutant SrAp divide symmetrically once every four years, the average time for 15 doublings is 44 years after the single mutation event. With probability 95%, the range of such times is between 36 and 56 years.
An interesting feature of the cluster data is shown in Figures 1 and 2. For some of the testes the large extended clusters appear to be preferably aligned in the vertical dimension (perpendicular to the long axis of the testis) and can extend over multiple testis pieces. In fact, the seminiferous tubules also are oriented in this way. This leads to the speculation that some mutant SrAp clusters expand along the length of the tubule and not in situ. In this way the large number of cells produced by the doublings might not impact the normal cellular organization of the tubules nor disrupt spermatogenesis as would likely occur with an in situ expansion.
Incorporating Cell Death
While the selection models can explain both the elevated mutation frequency and the mutation clustering observed in the testes for the RAMP mutations, there is a further observation that these relatively simple models cannot explain. In some older individuals (Figure 2) the RAMP mutation frequencies are very low similar to those from the youngest donors (13; 96; 122). By incorporating cell death, the selection models can also explain this observation. There is data suggesting spermatogonial cell death accompanies aging (75). The Ad spermatogonia are believed to act as reserve stem cells: they do not divide until there has been sufficient SrAp cell death at which point they begin dividing regularly (22; 104; 105). Since previously these Ad cells have not been dividing they are most likely not carrying a RAMP mutation, so random death of SrAp at middle-age and replacement by wild-type Ad can lead to a decreased mutation frequency and the diminution or disappearance of some mutation clusters. The newly transformed SrAp will then begin dividing regularly and will be subject to mutation, potentially contributing to the eventual further increase in mutation frequency. The modified models agree with the previous results, in addition to predicting the diversity observed in older testes (13; 122).
There is independent support for SrAp cell death of the kind proposed. In Apert syndrome the mutation frequency does not increase monotonically with age: there is a dip in the upward progression seen in the number of sporadic cases of affected children with paternal age (88). There is a similar dip in the sperm mutation frequency for both Apert syndrome mutations as a function of sperm donors’ ages (124). Computer simulations using the selection model incorporating cell death reproduces this dip (124).
Other models
Numerous other modifications to the hot spot models have also been considered. A successful model must explain the extreme mutation clusters observed in the testes. The earlier models assumed that the mutation rate per cell division is constant, but it is possible this rate increases with age, for example, due to a decrease in DNA repair efficiency (51; 63; 92; 118). While such a modification could explain the paternal age effect, it could not explain the mutation clusters observed in the testes since the new mutations would be spatially uniform. In addition to the asymmetric and symmetric hot spot models a more general hot spot model was also considered. In this model, all the SrAp (whether they are mutated or not) can randomly divide asymmetrically, symmetrically or differentiate. The probability of symmetrical self-renewal is equal to the probability of differentiation in order to keep the number of SrAp constant. The ratio of the probabilities of these two types of events to the probability of asymmetric divisions is a free parameter of the model (the three probabilities sum to one). This hot spot model was also rejected (13). Another model assumption that could be incorrect is that the SrAp divide every 16 days (48). A significant change in this division rate would affect the inferred value of the mutation rate per cell division, but this modification would not produce mutation clusters. In addition to replication-dependent mutations there are also replication-independent mutations, e.g., deamination at a cytosine or 5-methyl cytosine (34), but this type of mutation was included in another model that was also rejected (85).
Different selection models, where the mutant SrAp differ from wild-type SrAp in ways other than increased symmetric divisions, have also been considered. One possibility is that the mutant SrAp may divide more quickly than the wild-type SrAp, but the increase in division rate necessary to produce mutation clusters is biologically unreasonable (unpublished data). In relation to the previous section on cell death, mutant SrAp could have a survival advantage over wild-type SrAp (13; 122) but this change alone would not produce mutation clusters. An alternative proposal is that mutant SrAp could displace wild-type SrAp from the stem cell niche (or possibly kill them). For these properties to produce mutation clusters it must be accompanied by self-renewal symmetric divisions of the mutant SrAp to fill the void, making this model in effect similar to the selection models already proposed.
Another approach to testing the hot spot model
A study on the Apert syndrome c.755C>G mutation using sperm samples from 99 normal men of different ages (38) measured the mutation frequency for the three possible de novo mutations at the c.755C site. Total sperm DNA from each of multiple donors was enriched for a small DNA fragment carrying the site followed by pyrosequencing of each donor’s sample. The average C>G (Apert syndrome) missense mutation frequency was ~1.7 times that of C>T (the rarer Crouzon syndrome) missense mutation frequency. This difference was reflected in the fact that the incidence data for the former condition was greater than the latter. The C>A stop codon rate was ~10 fold lower.
The researchers exploited the fact some of the donors were heterozygous for a neutral polymorphism closely linked to the c.755C site on the same DNA fragment. Each de novo mutation at the c.755C site can arise on either one of the two normal chromosome homologs marked by the two different alleles. A high frequency of independent recurrent mutation events at the c.755C site in one individual’s germline predicts that these mutations will be equally distributed (with minimal skewing) among the two homologs of that individual; half of the mutant sperm will be associated with one marker allele. Despite the C>G mutation having a greater frequency than C>T, unexpectedly, C>G had more skewing than the C>T. The authors therefore rejected all hot spot models. The same group also collected skewing data on the most common Costello syndrome (MIM #218040) mutation in HRAS (c.34G>A, p.G12S) and made similar conclusions for this site (35). However, skewing data can be quite noisy given the stochastic factors that contribute to its magnitude and another group has shown by modeling that the evidence for rejection of all hot spot models based on skewing data (85) alone is not very strong.
Additional arguments have been made to support the germline selection hypothesis. It was observed, for example, that sperm carrying tandem base substitutions are more frequent than expected at Apert syndrome and Costello syndrome mutation sites possibly due to the role of selection (35; 39). Also considered relevant were studies comparing all nine possible mutations at lysine codon 650 in the FGFR3 gene. Inheritance of a germline c.1948A>G change (p.K650E) at this site causes the neonatal lethal condition thanatophoric dysplasia type II (MIM #187601) and the authors noted that this substitution had the highest sperm mutation frequency among all nine possible changes.
Cytological evidence for human SSC mutation clusters?
Lim and colleagues (60) looked for an analog of mutation clusters in testes of men older than 69 years by assuming SrAp expansion would proceed in a fashion similar to oncogenesis. The authors obtained blocks of formalin fixed normal human testis tissue and searched for histological features characteristics of early tumor formation including small clusters of cells (>3) that appeared aberrant followed by immunostaining of tissue sections adjacent to such features. The antibodies targeted all spermatogonia (MAGEA4), a cell proliferation marker (Ki-67), a form of the protein AKT involved in spermatogonial signaling and the wild-type FGFR3 protein (chosen because some FGFR3 mutants, e.g. achondroplasia and others (40), are candidates for spermatogonial stem cell selection). Among 3,000 seminiferous tubule cross-sections from one man, 84 microclones were found. A small number stained with wild-type FGFR3. Two clones were estimated to contain ~300 cells. Among the total of six testes a ~10 fold variation in microclone number was seen and some lacked immunopositive tubules. In the end the authors suggest caution in interpreting the data as representing the cellular analog of mutation clusters.
The small microclones can readily be explained; SSC without any mutation can, by chance (44; 55), undergo consecutive symmetric divisions independent of oncogenesis. The large FGFR3-staining clusters most likely have a different explanation. It is improbable that they are pure SrAp with a RAMP mutation undergoing selection and producing sperm since both spermatids and sperm were unobserved in the local tubule region (60). A clue to these larger clusters comes from the fact that normal Ad show marked FGFR3 staining (107; 108). Given the age of the men sampled it is easier to imagine these clusters as expanding Ad spermatogonia responding to a severe local loss of Ap spermatogonia (104; 105) or some unknown factor.
Regardless of these concerns, there must be cellular analogs of mutation clusters and pursuing this line of research is important. An excellent approach would be laser capture microdissection (LCM), previously used to measure human trinucleotide repeat expansion mutation frequencies (123) in spermatogonia. However, application of LCM to human RAMP mutations present in only a small fraction of the 192 testis pieces and at unknown locations would definitely be a challenge.
Function of the wild-type versions of RAMP mutation genes in spermatogonia
The selection model requires that the new RAMP mutation in the SSC produce some functional alteration giving the cell a selective advantage compared to wild-type SSC. The wild-type version of the genes carrying the RAMP mutations discussed here have long been known to play a role in normal mouse spermatogenesis including SSC proliferation, survival and differentiation. The importance of these mouse proteins in spermatogenesis has been revealed by a variety of studies including knockout and knockdown experiments in live animals, manipulation (including knockdowns) of SSC cultures grown in chemically defined media and transplantation of modified and unmodified SSC into mice with a testis stem cell niche but lacking germ cells (28; 41; 53; 77; 119; 125; 128). The FGRG2, FGFR3, RET and PTPN11 genes all influence many well-known signaling pathways through their protein products: the receptor tyrosine kinases (RTKs) FGFR2, FGFR3 and RET and the non-receptor protein tyrosine phosphatase SHP-2 (4; 20; 33; 42; 72; 74; 103). The three RTK are activated by the binding of cytokines and growth factors and stimulate signaling pathways, including PI3K/AKT, SFK (src family kinases) and components of the RAS/MAPK pathway. SHP-2 binds to certain phosphotyrosyl-containing proteins that activates SHP-2’s tyrosine phosphatase activity and modulates the signaling in these pathways. Together these four proteins help promote the synthesis of transcription factors, other proteins (28; 41; 53; 77; 119; 125; 128) and small RNAs (47; 120) critical for SSC function.
How do RAMP mutations alter spermatogonial function?
Virtually all work on RAMP mutations has focused on the human or mouse somatic tissues affected by these different disorders. Studies are lacking on the molecular effects of RAMP mutations in germline tissue from mouse models of Apert syndrome (10; 112; 113; 121), achondroplasia (67; 73; 111), MEN2B (99) and Noonan syndrome (3), or on germline tissues from humans affected with these conditions. However all these mouse model males are fertile (see however, (113)) and men with MEN2B, Noonan syndrome and achondroplasia frequently have children (1; 66; 81). Anecdotally, the affected men’s reproductive potential is thought to be somewhat diminished but whether this is due to effects on spermatogenesis or indirectly by the mutations effects on non-germline cells that contribute to fertility is not known. The one example of a possible transmission of Apert syndrome by an affected male published in 1988 (89) could not be confirmed because molecular confirmation of this disorder was not possible at that time.
Two general hypotheses have been suggested for how the mutated SSC might be influenced. One proposes the idea that the RAMP mutation causes an increased level of phosphorylation in components of the RAS/MAPK and related pathways (see above) thereby increasing well-known proliferation signals (13; 40). The degree of increase in proliferation signals is critical; it must be subtle so as not to encourage tumorigenesis or interfere significantly with sperm production.
The second hypothesis (122) suggests that the most common Noonan SHP-2 RAMP mutation (N308D) could enhance proliferation in an entirely different way by inhibiting SSC differentiation. Interestingly, this observation ties together the two alternative symmetric division SrAp choices: self-renewal or differentiation. Normal mouse SSC show a subtle increase in SSC proliferation, accompanied by a marked reduction in SSC differentiation (and loss of sperm production) when the transcription factor STAT3 is down-regulated by siRNA (54; 78) or by endogenous microRNAs (47). SHP-2 negatively regulates STAT3 signaling (20; 74). Mechanistically, in the context of non-germline tissues, wild-type SHP-2 binds to STAT3 and inhibits STAT3 function (126). More striking is that the Noonan syndrome SHP-2 N308D protein is an even better inhibitor of STAT3 than wild-type SHP-2 (126). In other words, the greater binding affinity of the mutant SHP-2 to STAT3 is suggested (122) to provide the mutant SSC a subtle proliferative advantage yet still allow sperm production. Concerning the three RTK RAMP mutations, an even more speculative version of this model has also been proposed. The hyperactivation of these three RTK by the Apert, achondroplasia and MEN2B RAMP mutations might subtly increase cyclin D1 (CCND1) expression which in turn is also known as an inhibitor of STAT3 (for details see (122)).
None of the above models for RAMP mutation effects on the RAS/MAPK and associated pathways or on the role of STAT3 have actually been verified by experiments in human or mouse SSC in vivo or in vitro. However, a recent study (65) was designed to directly test whether mouse SSC carrying the c.755C>G Apert mutation had a proliferative advantage over wild-type SSC in vivo. Mouse SSC were genetically modified by introduction of a lentiviral vector carrying the human FGFR2 coding region with the Apert syndrome mutation or the wild-type version; the two cell types were distinguished with different fluorescent markers. When mixed and introduced into mouse testes (lacking germ cells) individual SSC produced small colonies. The number of colonies was slightly greater for the cells with the Apert mutation. However, several factors need to be considered in interpreting the data. For example, there was no direct competition between mutant and wild-type SSC. The growing colonies were physically separated from one another in the testis whereas a newly mutant SSC would normally be in an overwhelmingly wild-type spermatogenic environment. Also, sperm production by these mice was not reported. This raises the question of whether the results reflected increased proliferation by otherwise normal functioning mutant SSC or whether the mutant SSC had undergone a pre-oncogenic transformation that enhanced proliferation. Additional experiments are eagerly awaited.
The relationship between tumor formation and germline selection
An important question is whether germline selection is mechanistically related to oncogenesis. The oncogenic connection for the FGFR2 Apert syndrome mutations was proposed (38; 39) originally because these specific mutations are found in some cancers of somatic tissues (e.g., endometrial cancer (27; 84)). The later discovery of Apert syndrome mutation clusters in testes (12; 85) could be taken as support for this idea (40). However, none of the documented cluster-forming RAMP mutations are found in the most common types of human testis cancers in younger men (11; 43). Similarly, no increased risk of germ cell tumor formation in men inheriting any of these five mutations has been reported (1; 66; 81).
A better choice for locating RAMP mutations associated with neoplasia (37) are testicular spermatocytic seminomas of older men, rare slowly growing benign tumors thought to be derived from SSC (109). Studies on 33 paraffin-embedded spermatocytic seminomas of almost 150 codons distributed among 17 different candidate RAMP/PAE genes (35; 37) failed to find any evidence of the five cluster-forming RAMP mutations. However, two mutant genes were found. Two tumors had the FGFR3 c.1948A>G (p.K650E) change. Seven of the tumors had mutations in the HRAS gene at one of three different locations not typically found in cancer or in known RAMP/PAE disorders. In addition, six of these seven mutants were found to be homozygous suggesting that loss of heterozygousity (LOH) was important for spermatocytic seminoma formation. This raises the unexpected (and difficult to answer) question of whether the mutant SrAp found in RAMP testis clusters have also experienced LOH.
The FGFR3 and HRAS mutations found in the tumors have not been examined for mutation cluster-forming ability in testes. However, p.K650E mutation clusters might be expected given its high sperm mutation frequency in normal men (37). Sperm studies also predict similar clusters for some disorder-causing HRAS mutations (35) not present in spermatocytic seminomas.
In our view, the evidence for a cancer-germline selection relationship, writ large, is not very strong. A mutation that causes cancer in one tissue may have no influence on any other tissues due to the complexity of interactions between the members of different signaling pathways and their tissue-specific partners. As depicted in Figure 6, our view is that RAMP mutation-carrying SrAp that make mutant sperm are virtually normal and only subtlety affected (13; 122). Further experiments are needed to definitively settle this issue.
Figure 6.
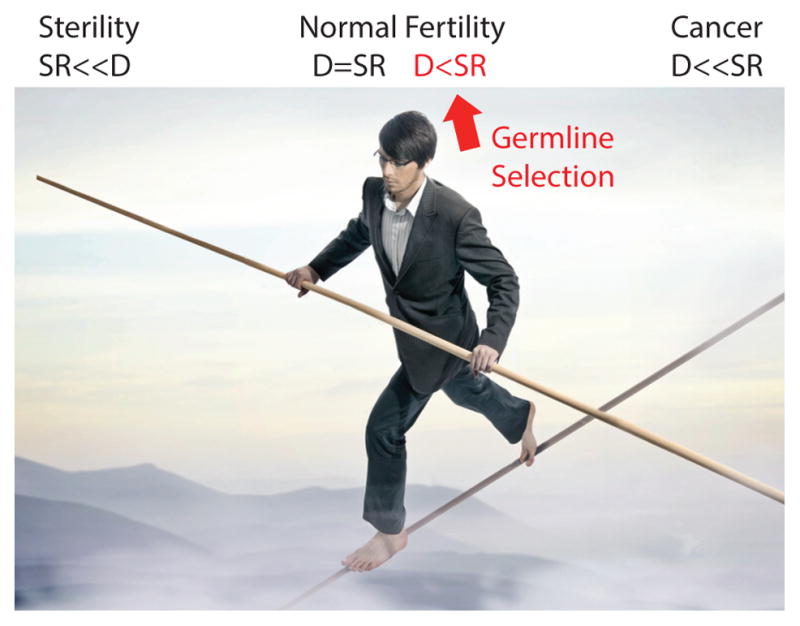
When self-renewal (SR) is a lot less than differentiation (D) fertility is diminished, when self-renewal and differentiation are balanced there is normal fertility, and when self-renewal is a lot more than differentiation cancer arises. Germline selection is characterized by self-renewal being only subtly more than differentiation.
Selection exacerbates the PAE of RAMP disorders
Wilhelm Weinberg was the first to notice in 1912 that a new Mendelian disorder (achondroplasia) that arose sporadically in large families was not equally distributed among all the children in those families but was more likely present in the younger rather than older siblings (115). He suggested that, as the parents aged, new mutations were more likely to be transmitted to their children. In 1957 Penrose used the available epidemiological data to show that the aging normal fathers (and not the normal mothers) were primarily responsible for transmitting achondroplasia to the next generation (82; 83). In 1987 Risch et al. analyzed the accumulating epidemiological studies on a number of different Mendelian disorders and divided them into two groups (88). One contained disorders where the paternal age effect was linear as expected for cell replication dependent mutations. The other group of disorders, which contained achondroplasia and Apert syndrome, among others, showed a super-linear increase with the father’s age. In agreement with this observation, germline selection predicts an exponential increase in mutation frequency for any of the RAMP mutations using the models described earlier. For other RAMP mutations there is insufficient epidemiological data available to be analyzed to distinguish between a linear and super-linear increase. But a PAE for Noonan syndrome (102) and MEN2B (8) was established by comparing the average age of fathers at the conception of their affected offspring to the average age of all fathers using census data and finding a statistically significant greater average age for the former fathers.
Data from traditional sequencing (reviewed in (5)) as well as NGS of parents and their offspring supports the linear PAE model for the vast majority of mutations most of which are expected to be neutral or deleterious (58; 94). (Note that the classical cell replication dependent PAE should show a linear increase as men age regardless of whether SrAp cell replications are symmetric or asymmetric.)
The contribution of RAMP mutations to increasing the mutational load
The RAMP mutations discussed in this review and other related mutations (discussed elsewhere (5) and more extensively in (40)) may be the tip of an “iceberg” of disadvantageous mutations that can experience positive selection in the germline. RAMP mutations are known because they produce recurrent, de novo, gain of function mutations with an unusually high incidence that are easily identified by their phenotype, pattern of Mendelian inheritance and formation of mutation clusters. However, whether the data represent the tip of an “iceberg” or merely an “ice cube” is unknown. Detection of positive germline selection for a gain of function deleterious mutation in any gene is limited by the genome average mutation rates, whether the genes are transcribed and translated in the germline (although almost all are transcribed (24)) and the cellular consequences of each mutation whose specific functional properties will determine the magnitude of selective advantage. Our current limits in understanding the structure-function relationships in proteins and how each mutant protein contributes to the ultimate phenotype of a disorder severely limits the chance of predicting new examples of deleterious mutations that confer a positive germline selective advantage based on these principles. However, using the RAMP criteria, or a subset of these criteria, is currently the best approach for choosing additional examples to study. It will also be important to expand the study of different mutations in the same gene on various properties related to positive germline selection (35; 37).
Due to numerous societal changes, more couples are delaying the age when they have children. Young men choosing to freeze sperm samples to be used, even up to 40 years later (101), might lower their personal risk of having a child carrying a de novo RAMP mutation as well as any other de novo mutations leading to disorders that exhibit the paternal age effect. However, the societal impact of such a strategy will be less significant (at least for the present), since despite the higher risk for older fathers most children are born to younger fathers, and thus the majority of cases for these disorders are the offspring of younger men.
Advantageous gain of function mutations with a germline selective advantage
A new mutation advantageous to individuals has a chance over time to spread throughout the world population. A new advantageous mutation that also provides a germline selective advantage could spread through the human population at an accelerated rate since the speed of adaptation depends on the rate at which new mutations are introduced into the population each generation (in addition to other factors (86; 87)). In the case of germline selection, some new mutations may be introduced into the population hundreds to thousands of times more frequently than a mutation without this advantage. Depending upon the specific demographic conditions (86; 87) the speed of adaptation in this case could increase dramatically over the rate of a typical advantageous mutation. Specific examples of such a scenario are not known to us.
Germline purifying selection decreases mutational load from some deleterious gain of function mutations
This review focused on positive germline selection of deleterious de novo gain of function mutations because they are so surprising. Germline selection can also reduce the load of mutations through purifying germline selection of deleterious gain of function mutations. We are aware of several examples that relate, not to a base substitution, but trinucleotide repeat (TNR) expansion mutations and their accompanying disorders (21; 23; 64; 69–71; 91; 98). For example, the X-linked neurodegenerative disorder fragile X syndrome has been studied in some detail. The zygote of a fragile X male receives a highly expanded segment of tandem CCG/GCC repeats in the gene FRAX1 that leads to this developmental disorder. Examination of fetal gonads throughout fetal life showed an ever increasing frequency in the contraction of the number of repeats so that adult males with fragile X syndrome produce sperm that overwhelmingly contain a normal number of repeats, presumably due to their selective proliferative advantage over SSC containing the fully expanded fragile X allele.
Are mutations transmitted in a recessive fashion also subject to germline selection?
The theory behind germline selection in animals has been examined from a number of different points of view (45; 46; 79). The major focus was on mutations transmitted in a recessive fashion and germline selection would not be possible in heterozygous cells unless LOH produced a SrAp homozygous for the mutant (estimated LOH rate 10−5–10−6 (59; 117)). Their modeling showed purifying germline selection against deleterious alleles could lower the deleterious allele frequency in the population and positive germline selection for cells could increase the frequency of advantageous alleles in the population. We are not aware of specific mutations that are examples of this germline selection scheme.
Summary Points.
Some nucleotide sites in the human genome cause sporadic cases of a number of clinical disorders whose frequencies are orders of magnitude greater than the genome average germline mutation rate. Examples include the mutations that cause achondroplasia, Apert syndrome, MEN2B, and Noonan syndrome. In addition to being Recurrent, these mutations are Autosomal dominant, Male biased, and feature the Paternal age effect, leading to the acronym RAMP.
By measuring the spatial distribution of spontaneous RAMP mutations in normal human testes, researchers have found that these mutations are clustered: most of the mutants are in a small region of a testis while the mutation frequency in the rest of the testis is orders of magnitude lower.
Computational modeling has shown that this clustering is incompatible with an elevated mutation rate per cell division at these sites (hot spot model), since this model would predict a spatially uniform mutation distribution. The testis data is, however, consistent with the mutations arising at the genome average rate, and the mutant spermatogonial stem cells having a selective advantage over wild-type cells (germline selection). These conclusions are robust to modifying stem cell division type (asymmetric or symmetric), mutation rate, stem cell division rate, replication independent mutation and stem cell survival.
In addition to explaining the high mutation frequency and the mutation clustering observed in the testes, germline selection can also explain the male mutation bias and paternal age effect characteristic of RAMP mutations.
Two models for how RAMP mutations might affect stem cell behavior are currently being considered. One suggests that the mutation enhances stem cell proliferation directly while the other posits that inhibiting stem cell differentiation is the critical step.
In our view germline selection is likely the result of a subtle change in SrAp behavior due to the RAMP mutation rather than the initiation of an oncogenic process.
It is surprising that a mutation that is disadvantageous to potential offspring and contributes to the accumulating mutational load as men age is preferred in the male germline. Yet germline selection also has been shown to remove cells carrying large trinucleotide repeat expansions through purifying selection. Additionally, mutations advantageous for an individual and that also have a germline selective advantage would be expected to spread throughout the human population at accelerated rates compared to those without a germline advantage.
Future Issues.
Establish the consequences of RAMP mutations on proliferation and other functions of mouse spermatogonial stem cells (SSC) at the molecular and biochemical levels.
Extend direct tests of the competitive advantage of mutant vs wild-type SSC in vivo in mouse testes mindful of the fact that differences between human and mouse spermatogenesis might influence the significance of such findings to human germline selection.
Find the cellular counterparts of the human RAMP mutation clusters and establish if they alter the histology of the seminiferous tubule, and whether cluster formation corresponds to any known stage of oncogenesis.
Explore computational approaches to identify new examples of positive or negative germline selection, using the massive amounts of population DNA sequencing data being collected.
Expand the cellular and molecular experimental tools for studying human SSC to a point where it could serve as a model system for studying spermatogenesis.
Acknowledgments
Research reported in this publication was supported by the National Institute of General Medical Sciences of the National Institutes of Health under award number R01GM36745. The content is solely the responsibility of the authors and does not necessarily represent the official views of the National Institutes of Health. We also gratefully appreciate discussions with Peter Ralph and Paul Marjoram and the advice of Jordan Eboreime in the preparation of this manuscript.
Contributor Information
Norman Arnheim, Molecular and Computational Biology Program, University of Southern California.
Peter Calabrese, Molecular and Computational Biology Program, University of Southern California.
Literature cited
- 1.Allanson JE, Roberts AE, editors; Pagon RA, Bird TD, Dolan CR, et al. Noonan Syndrome. 2001 Nov 15; [Updated 2011 Aug 4]
- 2.Amann RP. The cycle of the seminiferous epithelium in humans: a need to revisit? J Androl. 2008;29:469–87. doi: 10.2164/jandrol.107.004655. [DOI] [PubMed] [Google Scholar]
- 3.Araki T, Chan G, Newbigging S, Morikawa L, Bronson RT, Neel BG. Noonan syndrome cardiac defects are caused by PTPN11 acting in endocardium to enhance endocardial-mesenchymal transformation. Proc Natl Acad Sci U S A. 2009;106:4736–41. doi: 10.1073/pnas.0810053106. [DOI] [PMC free article] [PubMed] [Google Scholar]
- 4.Arighi E, Borrello MG, Sariola H. RET tyrosine kinase signaling in development and cancer. Cytokine Growth Factor Rev. 2005;16:441–67. doi: 10.1016/j.cytogfr.2005.05.010. [DOI] [PubMed] [Google Scholar]
- 5.Arnheim N, Calabrese P. Understanding what determines the frequency and pattern of human germline mutations. Nat Rev Genet. 2009;10:478–88. doi: 10.1038/nrg2529. [DOI] [PMC free article] [PubMed] [Google Scholar]
- 6.Bellus GA, Hefferon TW, Ortiz de Luna RI, Hecht JT, Horton WA, et al. Achondroplasia is defined by recurrent G380R mutations of FGFR3. Am J Hum Genet. 1995;56:368–73. [PMC free article] [PubMed] [Google Scholar]
- 7.Campbell CD, Eichler EE. Properties and rates of germline mutations in humans. Trends Genet. 2013;29:575–84. doi: 10.1016/j.tig.2013.04.005. [DOI] [PMC free article] [PubMed] [Google Scholar]
- 8.Carlson KM, Bracamontes J, Jackson CE, Clark R, Lacroix A, et al. Parent-of-origin effects in multiple endocrine neoplasia type 2B. Am J Hum Genet. 1994;55:1076–82. [PMC free article] [PubMed] [Google Scholar]
- 9.Carlson KM, Dou S, Chi D, Scavarda N, Toshima K, et al. Single missense mutation in the tyrosine kinase catalytic domain of the RET protooncogene is associated with multiple endocrine neoplasia type 2B. Proc Natl Acad Sci U S A. 1994;91:1579–83. doi: 10.1073/pnas.91.4.1579. [DOI] [PMC free article] [PubMed] [Google Scholar]
- 10.Chen L, Li D, Li C, Engel A, Deng CX. A Ser252Trp [corrected] substitution in mouse fibroblast growth factor receptor 2 (Fgfr2) results in craniosynostosis. Bone. 2003;33:169–78. doi: 10.1016/s8756-3282(03)00222-9. [DOI] [PubMed] [Google Scholar]
- 11.Chevalier N, Barlier A, Roche C, Mograbi B, Camparo P, et al. RET gene mutations are not involved in the origin of human testicular seminoma. International Journal of Andrology. 2010;33:848–52. doi: 10.1111/j.1365-2605.2009.01043.x. [DOI] [PubMed] [Google Scholar]
- 12.Choi SK, Yoon SR, Calabrese P, Arnheim N. A germ-line-selective advantage rather than an increased mutation rate can explain some unexpectedly common human disease mutations. Proc Natl Acad Sci U S A. 2008;105:10143–8. doi: 10.1073/pnas.0801267105. [DOI] [PMC free article] [PubMed] [Google Scholar]
- 13.Choi SK, Yoon SR, Calabrese P, Arnheim N. Positive selection for new disease mutations in the human germline: evidence from the heritable cancer syndrome multiple endocrine neoplasia type 2B. PLoS Genet. 2012;8:e1002420. doi: 10.1371/journal.pgen.1002420. [DOI] [PMC free article] [PubMed] [Google Scholar]
- 14.Clermont Y. The cycle of the seminiferous epithelium in man. Am J Anat. 1963;112:35–51. doi: 10.1002/aja.1001120103. [DOI] [PubMed] [Google Scholar]
- 15.Clermont Y. Renewal of spermatogonia in man. Am J Anat. 1966;118:509–24. doi: 10.1002/aja.1001180211. [DOI] [PubMed] [Google Scholar]
- 16.Clermont Y. Spermatogenesis in man. A study of the spermatogonial population. Fertil Steril. 1966;17:705–21. [PubMed] [Google Scholar]
- 17.Clermont Y. Kinetics of spermatogenesis in mammals: seminiferous epithelium cycle and spermatogonial renewal. Physiol Rev. 1972;52:198–236. doi: 10.1152/physrev.1972.52.1.198. [DOI] [PubMed] [Google Scholar]
- 18.Crow JF. The high spontaneous mutation rate: is it a health risk? Proc Natl Acad Sci U S A. 1997;94:8380–6. doi: 10.1073/pnas.94.16.8380. [DOI] [PMC free article] [PubMed] [Google Scholar]
- 19.Crow JF. The origins, patterns and implications of human spontaneous mutation. Nat Rev Genet. 2000;1:40–7. doi: 10.1038/35049558. [DOI] [PubMed] [Google Scholar]
- 20.Dance M, Montagner A, Salles JP, Yart A, Raynal P. The molecular functions of Shp2 in the Ras/Mitogen-activated protein kinase (ERK1/2) pathway. Cell Signal. 2008;20:453–9. doi: 10.1016/j.cellsig.2007.10.002. [DOI] [PubMed] [Google Scholar]
- 21.De Michele G, Cavalcanti F, Criscuolo C, Pianese L, Monticelli A, et al. Parental gender, age at birth and expansion length influence GAA repeat intergenerational instability in the X25 gene: pedigree studies and analysis of sperm from patients with Friedreich’s ataxia. Hum Mol Genet. 1998;7:1901–6. doi: 10.1093/hmg/7.12.1901. [DOI] [PubMed] [Google Scholar]
- 22.de Rooij DG, van Alphen MM, van de Kant HJ. Duration of the cycle of the seminiferous epithelium and its stages in the rhesus monkey (Macaca mulatta) Biol Reprod. 1986;35:587–91. doi: 10.1095/biolreprod35.3.587. [DOI] [PubMed] [Google Scholar]
- 23.Delatycki MB, Paris D, Gardner RJ, Forshaw K, Nicholson GA, et al. Sperm DNA analysis in a Friedreich ataxia premutation carrier suggests both meiotic and mitotic expansion in the FRDA gene. J Med Genet. 1998;35:713–6. doi: 10.1136/jmg.35.9.713. [DOI] [PMC free article] [PubMed] [Google Scholar]
- 24.Djureinovic D, Fagerberg L, Hallstrom B, Danielsson A, Lindskog C, et al. The human testis-specific proteome defined by transcriptomics and antibody-based profiling. Mol Hum Reprod. 2014;20:476–88. doi: 10.1093/molehr/gau018. [DOI] [PubMed] [Google Scholar]
- 25.Drost JB, Lee WR. Biological basis of germline mutation: comparisons of spontaneous germline mutation rates among drosophila, mouse, and human. Environ Mol Mutagen. 1995;25:48–64. doi: 10.1002/em.2850250609. [DOI] [PubMed] [Google Scholar]
- 26.Durrett R. Essentials of Stochastic Processes. Springer-Verlag; NY: 1999. [Google Scholar]
- 27.Dutt A, Salvesen HB, Chen TH, Ramos AH, Onofrio RC, et al. Drug-sensitive FGFR2 mutations in endometrial carcinoma. Proc Natl Acad Sci U S A. 2008;105:8713–7. doi: 10.1073/pnas.0803379105. [DOI] [PMC free article] [PubMed] [Google Scholar]
- 28.Ebata KT, Yeh JR, Zhang X, Nagano MC. Soluble growth factors stimulate spermatogonial stem cell divisions that maintain a stem cell pool and produce progenitors in vitro. Exp Cell Res. 2011;317:1319–29. doi: 10.1016/j.yexcr.2011.03.013. [DOI] [PubMed] [Google Scholar]
- 29.Ehmcke J, Schlatt S. A revised model for spermatogonial expansion in man: lessons from non-human primates. Reproduction. 2006;132:673–80. doi: 10.1530/rep.1.01081. [DOI] [PubMed] [Google Scholar]
- 30.Ehmcke J, Wistuba J, Schlatt S. Spermatogonial stem cells: questions, models and perspectives. Hum Reprod Update. 2006;12:275–82. doi: 10.1093/humupd/dmk001. [DOI] [PubMed] [Google Scholar]
- 31.Ellegren H. Characteristics, causes and evolutionary consequences of male-biased mutation. Proc Biol Sci. 2007;274:1–10. doi: 10.1098/rspb.2006.3720. [DOI] [PMC free article] [PubMed] [Google Scholar]
- 32.Eng C, Smith DP, Mulligan LM, Nagai MA, Healey CS, et al. Point mutation within the tyrosine kinase domain of the RET proto-oncogene in multiple endocrine neoplasia type 2B and related sporadic tumours. Hum Mol Genet. 1994;3:237–41. doi: 10.1093/hmg/3.2.237. [DOI] [PubMed] [Google Scholar]
- 33.Eswarakumar VP, Lax I, Schlessinger J. Cellular signaling by fibroblast growth factor receptors. Cytokine Growth Factor Rev. 2005;16:139–49. doi: 10.1016/j.cytogfr.2005.01.001. [DOI] [PubMed] [Google Scholar]
- 34.Friedberg EC, Friedberg EC. DNA repair and mutagenesis. Washington, D.C: ASM Press; 2006. p. xxix.p. 1118. [Google Scholar]
- 35.Giannoulatou E, McVean G, Taylor IB, McGowan SJ, Maher GJ, et al. Contributions of intrinsic mutation rate and selfish selection to levels of de novo HRAS mutations in the paternal germline. Proc Natl Acad Sci U S A. 2013;110:20152–7. doi: 10.1073/pnas.1311381110. [DOI] [PMC free article] [PubMed] [Google Scholar]
- 36.Glaser RL, Jabs EW. Dear old dad. Sci Aging Knowledge Environ. 2004;2004:re1. doi: 10.1126/sageke.2004.3.re1. [DOI] [PubMed] [Google Scholar]
- 37.Goriely A, Hansen RM, Taylor IB, Olesen IA, Jacobsen GK, et al. Activating mutations in FGFR3 and HRAS reveal a shared genetic origin for congenital disorders and testicular tumors. Nat Genet. 2009;41:1247–52. doi: 10.1038/ng.470. [DOI] [PMC free article] [PubMed] [Google Scholar]
- 38.Goriely A, McVean GA, Rojmyr M, Ingemarsson B, Wilkie AO. Evidence for selective advantage of pathogenic FGFR2 mutations in the male germ line. Science. 2003;301:643–6. doi: 10.1126/science.1085710. [DOI] [PubMed] [Google Scholar]
- 39.Goriely A, McVean GA, van Pelt AM, O’Rourke AW, Wall SA, et al. Gain-of-function amino acid substitutions drive positive selection of FGFR2 mutations in human spermatogonia. Proc Natl Acad Sci U S A. 2005;102:6051–6. doi: 10.1073/pnas.0500267102. [DOI] [PMC free article] [PubMed] [Google Scholar]
- 40.Goriely A, Wilkie AO. Paternal age effect mutations and selfish spermatogonial selection: causes and consequences for human disease. Am J Hum Genet. 2012;90:175–200. doi: 10.1016/j.ajhg.2011.12.017. [DOI] [PMC free article] [PubMed] [Google Scholar]
- 41.Griswold MD, Oatley JM. Concise review: Defining characteristics of mammalian spermatogenic stem cells. Stem Cells. 2013;31:8–11. doi: 10.1002/stem.1253. [DOI] [PMC free article] [PubMed] [Google Scholar]
- 42.Grossmann KS, Rosario M, Birchmeier C, Birchmeier W. The tyrosine phosphatase Shp2 in development and cancer. Adv Cancer Res. 2010;106:53–89. doi: 10.1016/S0065-230X(10)06002-1. [DOI] [PubMed] [Google Scholar]
- 43.Hansen RM, Goriely A, Wall SA, Roberts IS, Wilkie AO. Fibroblast growth factor receptor 2, gain-of-function mutations, and tumourigenesis: investigating a potential link. J Pathol. 2005;207:27–31. doi: 10.1002/path.1816. [DOI] [PubMed] [Google Scholar]
- 44.Hara K, Nakagawa T, Enomoto H, Suzuki M, Yamamoto M, et al. Mouse spermatogenic stem cells continually interconvert between equipotent singly isolated and syncytial states. Cell Stem Cell. 2014;14:658–72. doi: 10.1016/j.stem.2014.01.019. [DOI] [PMC free article] [PubMed] [Google Scholar]
- 45.Hastings IM. Potential germline competition in animals and its evolutionary implications. Genetics. 1989;123:191–7. doi: 10.1093/genetics/123.1.191. [DOI] [PMC free article] [PubMed] [Google Scholar]
- 46.Hastings IM. Germline selection: population genetic aspects of the sexual/asexual life cycle. Genetics. 1991;129:1167–76. doi: 10.1093/genetics/129.4.1167. [DOI] [PMC free article] [PubMed] [Google Scholar]
- 47.He Z, Jiang J, Kokkinaki M, Tang L, Zeng W, et al. MiRNA-20 and mirna-106a regulate spermatogonial stem cell renewal at the post-transcriptional level via targeting STAT3 and Ccnd1. Stem Cells. 2013;31:2205–17. doi: 10.1002/stem.1474. [DOI] [PMC free article] [PubMed] [Google Scholar]
- 48.Heller CG, Clermont Y. Spermatogenesis in man: an estimate of its duration. Science. 1963;140:184–6. doi: 10.1126/science.140.3563.184. [DOI] [PubMed] [Google Scholar]
- 49.Heller CH, Clermont Y. Kinetics of the Germinal Epithelium in Man. Recent Prog Horm Res. 1964;20:545–75. [PubMed] [Google Scholar]
- 50.Hofstra RM, Landsvater RM, Ceccherini I, Stulp RP, Stelwagen T, et al. A mutation in the RET proto-oncogene associated with multiple endocrine neoplasia type 2B and sporadic medullary thyroid carcinoma. Nature. 1994;367:375–6. doi: 10.1038/367375a0. [DOI] [PubMed] [Google Scholar]
- 51.Insinga A, Cicalese A, Pelicci PG. DNA damage response in adult stem cells. Blood Cells Mol Dis. 2014;52:147–51. doi: 10.1016/j.bcmd.2013.12.005. [DOI] [PubMed] [Google Scholar]
- 52.Johnson L, Varner DD. Effect of daily spermatozoan production but not age on transit time of spermatozoa through the human epididymis. Biol Reprod. 1988;39:812–7. doi: 10.1095/biolreprod39.4.812. [DOI] [PubMed] [Google Scholar]
- 53.Kanatsu-Shinohara M, Shinohara T. Spermatogonial stem cell self-renewal and development. Annu Rev Cell Dev Biol. 2013;29:163–87. doi: 10.1146/annurev-cellbio-101512-122353. [DOI] [PubMed] [Google Scholar]
- 54.Kaucher AV, Oatley MJ, Oatley JM. NEUROG3 is a critical downstream effector for STAT3-regulated differentiation of mammalian stem and progenitor spermatogonia. Biol Reprod. 2012;86:164, 1–11. doi: 10.1095/biolreprod.111.097386. [DOI] [PMC free article] [PubMed] [Google Scholar]
- 55.Klein AM, Nakagawa T, Ichikawa R, Yoshida S, Simons BD. Mouse germ line stem cells undergo rapid and stochastic turnover. Cell Stem Cell. 2010;7:214–24. doi: 10.1016/j.stem.2010.05.017. [DOI] [PubMed] [Google Scholar]
- 56.Knoblich JA. Mechanisms of asymmetric stem cell division. Cell. 2008;132:583–97. doi: 10.1016/j.cell.2008.02.007. [DOI] [PubMed] [Google Scholar]
- 57.Knoblich JA. Asymmetric cell division: recent developments and their implications for tumour biology. Nat Rev Mol Cell Biol. 2010;11:849–60. doi: 10.1038/nrm3010. [DOI] [PMC free article] [PubMed] [Google Scholar]
- 58.Kong A, Frigge ML, Masson G, Besenbacher S, Sulem P, et al. Rate of de novo mutations and the importance of father’s age to disease risk. Nature. 2012;488:471–5. doi: 10.1038/nature11396. [DOI] [PMC free article] [PubMed] [Google Scholar]
- 59.Lachance J, Tishkoff SA. Biased gene conversion skews allele frequencies in human populations, increasing the disease burden of recessive alleles. Am J Hum Genet. 2014;95:408–20. doi: 10.1016/j.ajhg.2014.09.008. [DOI] [PMC free article] [PubMed] [Google Scholar]
- 60.Lim J, Maher GJ, Turner GD, Dudka-Ruszkowska W, Taylor S, et al. Selfish spermatogonial selection: evidence from an immunohistochemical screen in testes of elderly men. PLoS One. 2012;7:e42382. doi: 10.1371/journal.pone.0042382. [DOI] [PMC free article] [PubMed] [Google Scholar]
- 61.Liu Q, Sommer SS. Detection of extremely rare alleles by bidirectional pyrophosphorolysis-activated polymerization allele-specific amplification (Bi-PAP-A): measurement of mutation load in mammalian tissues. Biotechniques. 2004;36:156–66. doi: 10.2144/04361DD03. [DOI] [PubMed] [Google Scholar]
- 62.Luria SE, Delbruck M. Mutations of bacteria from virus sensitivity to virus resistance. Genetics. 1943;28:491–511. doi: 10.1093/genetics/28.6.491. [DOI] [PMC free article] [PubMed] [Google Scholar]
- 63.Madabhushi R, Pan L, Tsai LH. DNA damage and its links to neurodegeneration. Neuron. 2014;83:266–82. doi: 10.1016/j.neuron.2014.06.034. [DOI] [PMC free article] [PubMed] [Google Scholar]
- 64.Malter HE, Iber JC, Willemsen R, Degraaff E, Tarleton JC, et al. Characterization of the full fragile-X-syndrome mutation in fetal gametes. Nature Genetics. 1997;15:165–9. doi: 10.1038/ng0297-165. [DOI] [PubMed] [Google Scholar]
- 65.Martin LA, Assif N, Gilbert M, Wijewarnasuriya D, Seandel M. Enhanced fitness of adult spermatogonial stem cells bearing a paternal age-associated FGFR2 mutation. Stem Cell Reports. 2014;3:219–26. doi: 10.1016/j.stemcr.2014.06.007. [DOI] [PMC free article] [PubMed] [Google Scholar]
- 66.Moline J, Eng C, editors. GeneReviews™ [Internet] 1993–2010 Seattle (WA): University of Washington, Seattle; 1999. Sep 27, Multiple Endocrine Neoplasia Type 2. [Updated 2013 Jan 10] [Google Scholar]
- 67.Monsonego-Ornan E, Adar R, Feferman T, Segev O, Yayon A. The transmembrane mutation G380R in fibroblast growth factor receptor 3 uncouples ligand-mediated receptor activation from down-regulation. Mol Cell Biol. 2000;20:516–22. doi: 10.1128/mcb.20.2.516-522.2000. [DOI] [PMC free article] [PubMed] [Google Scholar]
- 68.Morrison SJ, Kimble J. Asymmetric and symmetric stem-cell divisions in development and cancer. Nature. 2006;441:1068–74. doi: 10.1038/nature04956. [DOI] [PubMed] [Google Scholar]
- 69.Moseley ML, Schut LJ, Bird TD, Koob MD, Day JW, Ranum LP. SCA8 CTG repeat: en masse contractions in sperm and intergenerational sequence changes may play a role in reduced penetrance. Hum Mol Genet. 2000;9:2125–30. doi: 10.1093/hmg/9.14.2125. [DOI] [PubMed] [Google Scholar]
- 70.Moutou C, Vincent MC, Biancalana V, Mandel JL. Transition from premutation to full mutation in fragile X syndrome is likely to be prezygotic. Hum Mol Genet. 1997;6:971–9. doi: 10.1093/hmg/6.7.971. [DOI] [PubMed] [Google Scholar]
- 71.Muller J, Skakkebaek NE. The prenatal and postnatal development of the testis. Baillieres Clin Endocrinol Metab. 1992;6:251–71. doi: 10.1016/s0950-351x(05)80150-8. [DOI] [PubMed] [Google Scholar]
- 72.Mulligan LM. RET revisited: expanding the oncogenic portfolio. Nat Rev Cancer. 2014;14:173–86. doi: 10.1038/nrc3680. [DOI] [PubMed] [Google Scholar]
- 73.Naski MC, Colvin JS, Coffin JD, Ornitz DM. Repression of hedgehog signaling and BMP4 expression in growth plate cartilage by fibroblast growth factor receptor 3. Development. 1998;125:4977–88. doi: 10.1242/dev.125.24.4977. [DOI] [PubMed] [Google Scholar]
- 74.Neel BG, Chan G, Dhanji S. SH2 Domain-Containing Protein-Tyrosine Phosphatases. In: Bradshaw RA, Dennis EA, editors. Handbook of cell signaling. 2. Amsterdam San Diego, Calif: Academic Press; 2010. pp. 771–810.pp. 771–810. [Google Scholar]
- 75.Nistal M, Codesal J, Paniagua R, Santamaria L. Decrease in the number of human Ap and Ad spermatogonia and in the Ap/Ad ratio with advancing age. New data on the spermatogonial stem cell. J Androl. 1987;8:64–8. doi: 10.1002/j.1939-4640.1987.tb00950.x. [DOI] [PubMed] [Google Scholar]
- 76.Nistal M, Paniagua R. Testicular and Epididymal Pathology. New York: Thieme-Stratton Inc; 1984. p. 358. [Google Scholar]
- 77.Oatley JM, Brinster RL. Regulation of spermatogonial stem cell self-renewal in mammals. Annu Rev Cell Dev Biol. 2008;24:263–86. doi: 10.1146/annurev.cellbio.24.110707.175355. [DOI] [PMC free article] [PubMed] [Google Scholar]
- 78.Oatley JM, Kaucher AV, Avarbock MR, Brinster RL. Regulation of Mouse Spermatogonial Stem Cell Differentiation by STAT3 Signaling. Biology of Reproduction. 2010;83:427–33. doi: 10.1095/biolreprod.109.083352. [DOI] [PMC free article] [PubMed] [Google Scholar]
- 79.Otto SP, Hastings IM. Mutation and selection within the individual. Genetica. 1998;102–103:507–24. [PubMed] [Google Scholar]
- 80.Park WJ, Theda C, Maestri NE, Meyers GA, Fryburg JS, et al. Analysis of phenotypic features and FGFR2 mutations in Apert syndrome. Am J Hum Genet. 1995;57:321–8. [PMC free article] [PubMed] [Google Scholar]
- 81.Pauli RM. Achondroplasia. In: Pagon RA, Adam MP, Ardinger HH, Wallace SE, Amemiya A, et al., editors. GeneReviews(R) Seattle (WA): 1993. Number of. [Google Scholar]
- 82.Penrose L. Paternal age and mutation. Lancet. 1955;269:312–3. doi: 10.1016/s0140-6736(55)92305-9. [DOI] [PubMed] [Google Scholar]
- 83.Penrose LS. Parental age in acondroplasia and mongolism. Am J Hum Genet. 1957;9:167–9. [PMC free article] [PubMed] [Google Scholar]
- 84.Pollock PM, Gartside MG, Dejeza LC, Powell MA, Mallon MA, et al. Frequent activating FGFR2 mutations in endometrial carcinomas parallel germline mutations associated with craniosynostosis and skeletal dysplasia syndromes. Oncogene. 2007;26:7158–62. doi: 10.1038/sj.onc.1210529. [DOI] [PMC free article] [PubMed] [Google Scholar]
- 85.Qin J, Calabrese P, Tiemann-Boege I, Shinde DN, Yoon SR, et al. The molecular anatomy of spontaneous germline mutations in human testes. PLoS Biol. 2007;5:e224. doi: 10.1371/journal.pbio.0050224. [DOI] [PMC free article] [PubMed] [Google Scholar]
- 86.Ralph P, Coop G. Parallel adaptation: one or many waves of advance of an advantageous allele? Genetics. 2010;186:647–68. doi: 10.1534/genetics.110.119594. [DOI] [PMC free article] [PubMed] [Google Scholar]
- 87.Ralph P, Coop G. The role of standing variation in geographic convergent adaptation. PLOS Genetics. 2015 doi: 10.1086/682948. In Press. [DOI] [PMC free article] [PubMed] [Google Scholar]
- 88.Risch N, Reich EW, Wishnick MM, McCarthy JG. Spontaneous mutation and parental age in humans. Am J Hum Genet. 1987;41:218–48. [PMC free article] [PubMed] [Google Scholar]
- 89.Rollnick BR. Male transmission of Apert syndrome. Clinical Genetics. 1988;33:87–90. doi: 10.1111/j.1399-0004.1988.tb03416.x. [DOI] [PubMed] [Google Scholar]
- 90.Rousseau F, Bonaventure J, Legeai-Mallet L, Pelet A, Rozet JM, et al. Mutations in the gene encoding fibroblast growth factor receptor-3 in achondroplasia. Nature. 1994;371:252–4. doi: 10.1038/371252a0. [DOI] [PubMed] [Google Scholar]
- 91.Salat U, Bardoni B, Wohrle D, Steinbach P. Increase of FMRP expression, raised levels of FMR1 mRNA, and clonal selection in proliferating cells with unmethylated fragile X repeat expansions: a clue to the sex bias in the transmission of full mutations? J Med Genet. 2000;37:842–50. doi: 10.1136/jmg.37.11.842. [DOI] [PMC free article] [PubMed] [Google Scholar]
- 92.Sanchez JR, Reddick TL, Perez M, Centonze VE, Mitra S, et al. Increased human AP endonuclease 1 level confers protection against the paternal age effect in mice. Mutat Res. 2015;779:124–33. doi: 10.1016/j.mrfmmm.2015.06.008. [DOI] [PMC free article] [PubMed] [Google Scholar]
- 93.Sayres MA, Makova KD. Genome analyses substantiate male mutation bias in many species. Bioessays. 2011;33:938–45. doi: 10.1002/bies.201100091. [DOI] [PMC free article] [PubMed] [Google Scholar]
- 94.Segurel L, Wyman MJ, Przeworski M. Determinants of mutation rate variation in the human germline. Annu Rev Genomics Hum Genet. 2014;15:47–70. doi: 10.1146/annurev-genom-031714-125740. [DOI] [PubMed] [Google Scholar]
- 95.Shiang R, Thompson LM, Zhu YZ, Church DM, Fielder TJ, et al. Mutations in the transmembrane domain of FGFR3 cause the most common genetic form of dwarfism, achondroplasia. Cell. 1994;78:335–42. doi: 10.1016/0092-8674(94)90302-6. [DOI] [PubMed] [Google Scholar]
- 96.Shinde DN, Elmer DP, Calabrese P, Boulanger J, Arnheim N, Tiemann-Boege I. New evidence for positive selection helps explain the paternal age effect observed in achondroplasia. Hum Mol Genet. 2013 doi: 10.1093/hmg/ddt260. [DOI] [PMC free article] [PubMed] [Google Scholar]
- 97.Shinde DN, Elmer DP, Calabrese P, Boulanger J, Arnheim N, Tiemann-Boege I. New evidence for positive selection helps explain the paternal age effect observed in achondroplasia. Hum Mol Genet. 2013;22:4117–26. doi: 10.1093/hmg/ddt260. [DOI] [PMC free article] [PubMed] [Google Scholar]
- 98.Silveira I, Alonso I, Guimaraes L, Mendonca P, Santos C, et al. High germinal instability of the (CTG)n at the SCA8 locus of both expanded and normal alleles. Am J Hum Genet. 2000;66:830–40. doi: 10.1086/302827. [DOI] [PMC free article] [PubMed] [Google Scholar]
- 99.Smith-Hicks CL, Sizer KC, Powers JF, Tischler AS, Costantini F. C-cell hyperplasia, pheochromocytoma and sympathoadrenal malformation in a mouse model of multiple endocrine neoplasia type 2B. EMBO J. 2000;19:612–22. doi: 10.1093/emboj/19.4.612. [DOI] [PMC free article] [PubMed] [Google Scholar]
- 100.Stoll C, Dott B, Roth MP, Alembik Y. Birth prevalence rates of skeletal dysplasias. Clin Genet. 1989;35:88–92. doi: 10.1111/j.1399-0004.1989.tb02912.x. [DOI] [PubMed] [Google Scholar]
- 101.Szell AZ, Bierbaum RC, Hazelrigg WB, Chetkowski RJ. Live births from frozen human semen stored for 40 years. J Assist Reprod Genet. 2013;30:743–4. doi: 10.1007/s10815-013-9998-9. [DOI] [PMC free article] [PubMed] [Google Scholar]
- 102.Tartaglia M, Cordeddu V, Chang H, Shaw A, Kalidas K, et al. Paternal germline origin and sex-ratio distortion in transmission of PTPN11 mutations in Noonan syndrome. Am J Hum Genet. 2004;75:492–7. doi: 10.1086/423493. [DOI] [PMC free article] [PubMed] [Google Scholar]
- 103.Turner N, Grose R. Fibroblast growth factor signalling: from development to cancer. Nat Rev Cancer. 2010;10:116–29. doi: 10.1038/nrc2780. [DOI] [PubMed] [Google Scholar]
- 104.van Alphen MM, de Rooij DG. Depletion of the seminiferous epithelium of the rhesus monkey, Macaca mulatta, after X-irradiation. Br J Cancer Suppl. 1986;7:102–4. [PMC free article] [PubMed] [Google Scholar]
- 105.van Alphen MM, van de Kant HJ, de Rooij DG. Depletion of the spermatogonia from the seminiferous epithelium of the rhesus monkey after X irradiation. Radiat Res. 1988;113:473–86. [PubMed] [Google Scholar]
- 106.Vogel F, Motulsky AG. Human genetics : problems and approaches. Berlin ; New York: Springer; 1997. p. xxxvi.p. 851. [Google Scholar]
- 107.von Kopylow K, Staege H, Schulze W, Will H, Kirchhoff C. Fibroblast growth factor receptor 3 is highly expressed in rarely dividing human type A spermatogonia. Histochem Cell Biol. 2012;138:759–72. doi: 10.1007/s00418-012-0991-7. [DOI] [PubMed] [Google Scholar]
- 108.von Kopylow K, Staege H, Spiess AN, Schulze W, Will H, et al. Differential marker protein expression specifies rarefaction zone-containing human Adark spermatogonia. Reproduction. 2012;143:45–57. doi: 10.1530/REP-11-0290. [DOI] [PubMed] [Google Scholar]
- 109.Waheeb R, Hofmann MC. Human spermatogonial stem cells: a possible origin for spermatocytic seminoma. Int J Androl. 2011;34:e296–305. doi: 10.1111/j.1365-2605.2011.01199.x. discussion e. [DOI] [PMC free article] [PubMed] [Google Scholar]
- 110.Waller DK, Correa A, Vo TM, Wang Y, Hobbs C, et al. The population-based prevalence of achondroplasia and thanatophoric dysplasia in selected regions of the US. Am J Med Genet A. 2008;146A:2385–9. doi: 10.1002/ajmg.a.32485. [DOI] [PMC free article] [PubMed] [Google Scholar]
- 111.Wang Y, Spatz MK, Kannan K, Hayk H, Avivi A, et al. A mouse model for achondroplasia produced by targeting fibroblast growth factor receptor 3. P Natl Acad Sci USA. 1999;96:4455–60. doi: 10.1073/pnas.96.8.4455. [DOI] [PMC free article] [PubMed] [Google Scholar]
- 112.Wang Y, Sun M, Uhlhorn VL, Zhou X, Peter I, et al. Activation of p38 MAPK pathway in the skull abnormalities of Apert syndrome Fgfr2(+P253R) mice. BMC Dev Biol. 2010;10:22. doi: 10.1186/1471-213X-10-22. [DOI] [PMC free article] [PubMed] [Google Scholar]
- 113.Wang Y, Xiao R, Yang F, Karim BO, Iacovelli AJ, et al. Abnormalities in cartilage and bone development in the Apert syndrome FGFR2+/S252W mouse. Development. 2005;132:3537–48. doi: 10.1242/dev.01914. [DOI] [PubMed] [Google Scholar]
- 114.Weatherall DJ. The global problem of genetic disease. Ann Hum Biol. 2005;32:117–22. doi: 10.1080/03014460500075480. [DOI] [PubMed] [Google Scholar]
- 115.Weinberg W. Zur Verebung des Zwergwuches. Archiv Rassen-und Gesellschafts-Hygie Biolne. 1912;9:710–8. [Google Scholar]
- 116.Wilkie AO, Slaney SF, Oldridge M, Poole MD, Ashworth GJ, et al. Apert syndrome results from localized mutations of FGFR2 and is allelic with Crouzon syndrome. Nat Genet. 1995;9:165–72. doi: 10.1038/ng0295-165. [DOI] [PubMed] [Google Scholar]
- 117.Williams AL, Genovese G, Dyer T, Altemose N, Truax K, et al. Non-crossover gene conversions show strong GC bias and unexpected clustering in humans. Elife. 2015:4. doi: 10.7554/eLife.04637. [DOI] [PMC free article] [PubMed] [Google Scholar]
- 118.Xu G, Spivak G, Mitchell DL, Mori T, McCarrey JR, et al. Nucleotide Excision Repair Activity Varies Among Murine Spermatogenic Cell Types. Biol Reprod. 2005;73:123–30. doi: 10.1095/biolreprod.104.039123. [DOI] [PubMed] [Google Scholar]
- 119.Yang QE, Oatley JM. Spermatogonial stem cell functions in physiological and pathological conditions. Curr Top Dev Biol. 2014;107:235–67. doi: 10.1016/B978-0-12-416022-4.00009-3. [DOI] [PubMed] [Google Scholar]
- 120.Yang QE, Racicot KE, Kaucher AV, Oatley MJ, Oatley JM. MicroRNAs 221 and 222 regulate the undifferentiated state in mammalian male germ cells. Development. 2013;140:280–90. doi: 10.1242/dev.087403. [DOI] [PMC free article] [PubMed] [Google Scholar]
- 121.Yin L, Du X, Li C, Xu X, Chen Z, et al. A Pro253Arg mutation in fibroblast growth factor receptor 2 (Fgfr2) causes skeleton malformation mimicking human Apert syndrome by affecting both chondrogenesis and osteogenesis. Bone. 2008;42:631–43. doi: 10.1016/j.bone.2007.11.019. [DOI] [PubMed] [Google Scholar]
- 122.Yoon SR, Choi SK, Eboreime J, Gelb BD, Calabrese P, Arnheim N. Age-dependent germline mosaicism of the most common noonan syndrome mutation shows the signature of germline selection. Am J Hum Genet. 2013;92:917–26. doi: 10.1016/j.ajhg.2013.05.001. [DOI] [PMC free article] [PubMed] [Google Scholar]
- 123.Yoon SR, Dubeau L, de Young M, Wexler NS, Arnheim N. Huntington disease expansion mutations in humans can occur before meiosis is completed. Proc Natl Acad Sci U S A. 2003;100:8834–8. doi: 10.1073/pnas.1331390100. [DOI] [PMC free article] [PubMed] [Google Scholar]
- 124.Yoon SR, Qin J, Glaser RL, Jabs EW, Wexler NS, et al. The ups and downs of mutation frequencies during aging can account for the Apert syndrome paternal age effect. PLoS Genet. 2009;5:e1000558. doi: 10.1371/journal.pgen.1000558. [DOI] [PMC free article] [PubMed] [Google Scholar]
- 125.Yoshida S. Elucidating the identity and behavior of spermatogenic stem cells in the mouse testis. Reproduction. 2012;144:293–302. doi: 10.1530/REP-11-0320. [DOI] [PubMed] [Google Scholar]
- 126.Zhang W, Chan RJ, Chen H, Yang Z, He Y, et al. Negative regulation of Stat3 by activating PTPN11 mutants contributes to the pathogenesis of Noonan syndrome and juvenile myelomonocytic leukemia. J Biol Chem. 2009;284:22353–63. doi: 10.1074/jbc.M109.020495. [DOI] [PMC free article] [PubMed] [Google Scholar]
- 127.Zhengwei Y, Wreford NG, Royce P, de Kretser DM, McLachlan RI. Stereological evaluation of human spermatogenesis after suppression by testosterone treatment: heterogeneous pattern of spermatogenic impairment. J Clin Endocrinol Metab. 1998;83:1284–91. doi: 10.1210/jcem.83.4.4724. [DOI] [PubMed] [Google Scholar]
- 128.Zhou QG, Griswold MD. TSR Community, editor . StemBook. 2008. Regulation of Spermatogonia (July 14, 2008) [Google Scholar]