Bile diversion (BD) improves obesity, glycemic control, thermogenesis, and energy expenditure, and alters the gut microbiota, thereby increasing the microbe Akkermansia muciniphila, which is correlated with circulating bile acids in this study and is associated with leanness. Whereas oral bile acid gavage reverses mucosal hypertrophy and proliferation during BD, this approach fails to abrogate metabolic benefits, suggesting that bile acids in the distal intestine, but not proliferation in the proximal intestine, contribute to improved glycemic control.
Keywords: bile acids, bile diversion, obesity, energy expenditure, gut microbiota, gastric bypass, mice
Abstract
The metabolic benefits induced by gastric bypass, currently the most effective treatment for morbid obesity, are associated with bile acid (BA) delivery to the distal intestine. However, mechanistic insights into BA signaling in the mediation of metabolic benefits remain an area of study. The bile diversion () mouse model, in which the gallbladder is anastomosed to the distal jejunum, was used to test the specific role of BA in the regulation of glucose and lipid homeostasis. Metabolic phenotype, including body weight and composition, glucose tolerance, energy expenditure, thermogenesis genes, total BA and BA composition in the circulation and portal vein, and gut microbiota were examined. BD improves the metabolic phenotype, which is in accord with increased circulating primary BAs and regulation of enterohormones. BD-induced hypertrophy of the proximal intestine in the absence of BA was reversed by BA oral gavage, but without influencing BD metabolic benefits. BD-enhanced energy expenditure was associated with elevated TGR5, D2, and thermogenic genes, including UCP1, PRDM16, PGC-1α, PGC-1β, and PDGFRα in epididymal white adipose tissue (WAT) and inguinal WAT, but not in brown adipose tissue. BD resulted in an altered gut microbiota profile (i.e., Firmicutes bacteria were decreased, Bacteroidetes were increased, and Akkermansia was positively correlated with higher levels of circulating primary BAs). Our study demonstrates that enhancement of BA signaling regulates glucose and lipid homeostasis, promotes thermogenesis, and modulates the gut microbiota, which collectively resulted in an improved metabolic phenotype.
NEW & NOTEWORTHY
Bile diversion (BD) improves obesity, glycemic control, thermogenesis, and energy expenditure, and alters the gut microbiota, thereby increasing the microbe Akkermansia muciniphila, which is correlated with circulating bile acids in this study and is associated with leanness. Whereas oral bile acid gavage reverses mucosal hypertrophy and proliferation during BD, this approach fails to abrogate metabolic benefits, suggesting that bile acids in the distal intestine, but not proliferation in the proximal intestine, contribute to improved glycemic control.
primary bile acids, including cholic acid (CA), chenodeoxycholic acid (CDCA in humans), and muricholic acid (MCA, in mice), are synthesized from cholesterol and conjugated with glycine, taurine, or sulfate in the liver before being secreted into the intestine. Primary bile acids are converted to secondary bile acids by microbial deconjugation and fermentation in the distal gut (28). Bile acids are amphipathic detergents that facilitate dietary lipid and lipid vitamin absorption from the small intestine. Bile acids also function as signaling molecules by regulating energy expenditure and counteracting obesity and diabetes, in part through interaction with the bile acid receptors G protein-coupled bile acid receptor 1 (GPBAR1 or TGR5) and farnesoid X receptor (FXR) (32, 46, 59). TGR5 promotes release of glucagon-like peptide-1 (GLP-1), GLP-2, and peptide YY from mucosal enteroendocrine cells (19, 24) and regulates transport proteins and biosynthetics that contribute to glycemic control. FXR, however, reveals dual characteristics: improved insulin release and sensitivity (43, 63) coupled with accelerated progression of obesity and diabetes (41, 58). Gastric bypass remains the most effective therapy for morbid obesity and provides a cost-saving procedure that reduces body weight and type 2 diabetes (T2D) prevalence (47). However, the precise mechanisms of gastric bypass metabolic improvement remain an area of study. Previous research suggests that shortened enterohepatic circulation of bile acids to the distal intestine, resulting in elevated bile acid pools, is one mechanistic feature of improved metabolism in gastric bypass (1, 33).
Expansion of white adipose tissue (WAT) is associated with obesity and T2D risk, whereas expansion of brown adipose tissue (BAT) correlates with improved obesity and T2D outcomes (6, 20, 39). Browning in white adipocytes (brite) found within certain WAT exhibits similar functional characteristics of brown adipocytes (6, 20, 39), thus enhancing the browning of adipocytes is an attractive approach for the treatment of obesity and T2D. Cold stimulation and β-adrenergic agonists successfully promote thermogenic genes in WAT, which results in enhanced nonshivering thermogenesis and energy expenditure (5, 42). However, side effects resulting from cold stimulation and β-adrenergic agonist, and the requirement for persistent cold temperature exposure realistically prevent this from clinical application. However, bile acids increase energy expenditure in murine BAT and human skeletal muscle (53, 59) through activation of TGR5-dependent type-2 iodothyronine deiodinase (D2) (59), the primary enzyme responsible for converting thyroxine (T4) to triiodothyronine (T3). Bioactive T3 induces mitochondrial biogenesis (23) and expression of uncoupling protein 1 (UCP1), promoting free fatty acid oxidation and enhanced energy expenditure (7).
In addition to direct ligand interactions, growing evidence suggests that bile acids interact with the gut microbiota (i.e., bile acids influence gut microbiota composition that in turn modify the deconjugation of primary bile acids to secondary bile acids) (51). Gastric bypass metabolic improvements are mediated in part by modulated gut microbiota (2, 33, 62). However, there is controversy regarding changes in the relative abundance and role of the gut microbiota related to obesity and insulin sensitivity. Recent findings suggest that a high-fat diet induces a significant decrease in Akkermansia bacteria (48), and increased Akkermansia is associated with improved glucose homeostasis in rodents (49). An Akkermansia-enriched microbial population also correlates with a healthier metabolic status and may contribute to the antidiabetic effects of metformin in the clinic (11). However, bile acid regulation of the gut microbiota remains unresolved.
To dissect the bile acid-specific roles in regulating metabolism, Kohli et al. (25) created an ileal interposition rat model, thereby promoting early absorption of primary bile acids. Pournaras et al. (40) performed a duodenal interposition surgery in rats so that primary bile acids were diverted to the distal intestine to promote rapid reabsorption. Because the gallbladder is absent in rats, Kohli et al. (26) also developed a bile diversion (BD) rat model in which bile acids are diverted to the distal intestine through a catheter. Each procedure resulted in improved glycemic control with increased circulating bile acids and elevated GLP-1 release. Another recent report demonstrated that bile rerouting in gastric bypass conferred metabolic benefits (18), including decreased hepatic glucose production and an increase in gluconeogenesis in the proximal gut, where bile acids are subsequently absent (18).
Here, we tested the role of bile acid signaling on the regulation of enterohormone and adipokine release, promotion of adipose thermogenesis genes and energy expenditure, and modulation of the intestinal microbiome composition using our recently created BD mouse model. In this procedure, bile acids are diverted to the distal jejunum, where bile acids are rapidly absorbed through enterohepatic circulation, resulting in increased circulating primary bile acids. We hypothesized that BD would enhance enterohormone release, modulate the gut microbiota, and promote expression of thermogenic genes resulting in improvement of glucose and lipid homeostasis in mice in which diet-induced obesity (DIO) was achieved by feeding the animals a high-fat diet (HFD). Nutrients in the proximal intestine, in the absence of bile acids, induce mucosal proliferation and hypertrophy. We further speculated reintroduction of bile acids by oral gavage would reverse these alterations without impairing global BD-induced metabolic benefits.
MATERIALS AND METHODS
Mice and surgery.
Male C57BL/6 mice were purchased from the Jackson Laboratory. Mice were divided into one of four groups: 1) mice were given a low-fat diet (LFD) (10% kcal fat diet; Bio-Serv, Frenchtown, NJ) starting at 6 wk of age for 10–12 wk (LFD group); 2) DIO mice were given an HFD (60% kcal fat diet; Bio-Serv) starting at 6 wk of age for 10–12 wk (HFD group); 3) weight-matched DIO mice that underwent sham surgery and the HFD was reduced by 25% compared with that given to mice that underwent BD (33) to match the body weight of BD mice (WMS group); and 4) DIO mice that underwent BD (BD group). Mice were maintained in the Animal Resources Center at the University of Chicago in a specific pathogen-free, temperature-controlled environment with a 12:12-h light-dark cycle. The BD surgery in mice with DIO was performed under general anesthesia with isoflurane plus equal amounts of O2 through a cone placed around the mouse's nose. Each animal's vital signs were monitored throughout surgery, including respiratory rate, response to noxious stimulus, and assessment of spontaneous movements.
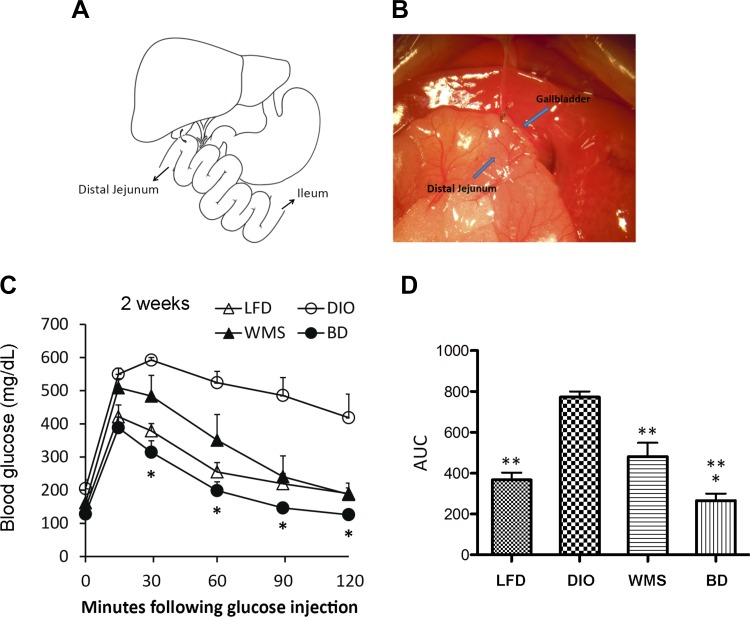
BD is depicted in Figure 1, A and B. In brief, the procedure requires anastomosis of the gallbladder in a side-to-side fashion to the distal jejunum at 10 cm distance to the Treitz ligament. For sham surgical procedures (in the WMS group), the stomach, duodenum, and jejunum were mobilized; and the esophagus, stomach, and jejunum were clamped without incision followed by closure of the abdomen. After recovery, mice were maintained on the HFD and had free access to diet and water for 1 wk followed by being housed individually to measure body weight and caloric restriction. All mice were administered buprenorphine (0.1 mg/kg sc, on the completion of surgery followed by every 12 h for 72 h) (55). At 8 wk after surgery the liver, epididymal WAT (eWAT), inguinal WAT (iWAT), BAT, duodenum and ileum tissues, blood from the portal vein and circulation, and cecal contents were collected after mice were killed under anesthesia with ketamine (100 mg/kg) and xylazine (5 mg/kg). Eight weeks was chosen as an experimental end point because no further metabolic benefits were observed following this time point (unpublished observation). All animal protocols were approved by the Institutional Animal Care and Use Committee at the University of Chicago.
Fig. 1.
BD improves body weight and glucose tolerance. A: BD mouse model. Cholecystoenterostomy is performed, and bile is drained to the distal jejunum (arrow). B: photograph of gallbladder-jejunal anastomosis. C: intraperitoneal glucose tolerance tests (IPGTTs) were performed at 2 wk postsurgery. *BD vs. WMS at 30, 60, 90, and 120 min, P < 0.05. D: area under the curve of IPGTT at 2 wk postsurgery. *BD vs. WMS, P < 0.05; **LFD, WMS, and BD vs. DIO, P < 0.01 (n = 5 per group). BD, bile diversion; DIO, diet-induced obesity; LFD, low-fat diet; WMS, weight-matched animals that underwent sham surgery.
Analyses of total bile acids and bile acid composition.
Total bile acids were quantified via enzymatic assay (80470; Crystal Chem, Downers Grove, IL) in peripheral and portal serum, and fecal lipid extracts, according to the manufacturer's instructions. For analysis of bile acid composition, 900 μl of methanol was added to 100-μl seral samples, vortexed, and incubated at room temperature for 20 min. Samples were centrifuged for 15 min at 4,000 g at room temperature, and supernatants were transferred to new tubes. Tubes were evaporated under N2, resuspended in 2.0 ml of H2O (pH 3.0), purified on C18 SPE columns, and eluted in methanol. The following standards from Sigma-Aldrich (St. Louis, MO) were used: tauro-conjugated cholic acid (TCA; T4009), CA (C1429), CDCA (C9377), tauro-conjugated chenodeoxycholic acid (TCDCA; T6260), lithocholic acid (LCA; L6250), deoxycholic acid (DCA; D2510), hyodeoxycholic acid (HDCA; H3878), taurochenodeoxycholic acid (TCDA; T0875), taurolithocholic acid (TLCA; T7515), ursodeoxycholic acid (UDCA; U5127); and two standards, tauro-β-muricholic acid (TβMCA; C1899) and β-muricholic acid (βMCA; C1895), were from Steraloids (New Port, RI). Samples (5.0 μl) were injected into a 6460 triple quadrupole liquid chromatography/mass spectrometry (LCMS/MS) system with 1290 UHPLC (Agilent Technologies). Respective bile acids were separated on a Zorbax eclipse XDB C18 column (Agilent Technologies) using ammonium acetate (15 mmol/l, pH 5.3) and methanol (100%) in a 65:35 (vol/vol) mixture.
Analysis of cecal content short-chain fatty acids.
Fresh cecal samples were collected, weighed, homogenized in water, and centrifuged at 13,000 g. Supernatants were acidified, and isobutyric acid (3 mM) was added (internal standard). Short-chain fatty acids (SCFAs) were extracted using diethyl ether, subsequently derivatized using MTBS-TFA, and then run on a Varian Saturn 2000 gas chromatography mass spectrometer.
Cecal content microbiota analysis.
Cecal content samples were collected at 8 wk postsurgery and stored at −80°C. To assess bacterial community structure, we used primers specific for the 16S rRNA V4–V5 region (forward, 338F: 5′-GTGCCAGCMGCCGCGGTAA-3′; reverse, 806R: 5′-GGACTACHVGGGTWTCTAAT-3′) that contained Illumina 3′ adapter sequences, and a 12-bp barcode. Sequences were generated by an Illumina MiSeq DNA platform at Argonne National Laboratory and analyzed by the program Quantitative Insights Into Microbial Ecology (QIIME) (9). Operational taxonomic units (OTUs) were picked at 97% sequence identity using open-reference OTU picking against the Greengenes database (27). OTUs were quality filtered on the basis of default parameters set in the open-reference OTU command in QIIME, and sequences were rarified to an equal sampling depth of 6,000 reads per sample. Representative sequences were aligned via PyNAST, taxonomy assigned using the RDP Classifier, and a phylogenetic tree was created using FastTree. Beta diversity is represented by measuring UniFrac distances calculated using weighted algorithms and visualized with PCoA plots generated in Emperor software. Prior to statistical analyses, OTUs occurring in less than 50% of samples were filtered from the OTU table (9). Significant changes in OTU abundance were assessed using a Kruskal Wallis test (false discovery rate adjusted at 0.05). Multivariate statistical tests includes ADONIS, ANOSIM, and PERMANOVA. Spearman correlations and principal component analysis were performed using MATLAB software.
Blood glucose and glucose/insulin tolerance analyses.
Blood glucose levels (mg/dl) were measured using a blood glucose meter (SureStep, LifeScan). Intraperitoneal glucose tolerance tests and insulin tolerance tests were performed. Mice were fasted for 4 h prior, and blood was sampled from the tail vein before and at 15, 30, 60, 90, and 120 min after intraperitoneal injection of dextrose (20%) at 2.0 mg/g body wt or human insulin at 0.05 mg/kg body wt.
Body composition.
Body composition was measured by dual-energy X-ray absorptiometry (Lunar PIXImus densitometer system, GE Healthcare) using PIXImus 2 software (3). The system was calibrated according to the manufacturer's instructions before the start of the experiment.
Energy expenditure.
Metabolic cage analysis of energy balance was carried out using metabolic cages (TSE Systems, Chesterfield, MO) (3). Mice were placed individually in a TSE Labmaster System for 4 days, and food and water intake, physical activity, and O2 uptake and CO2 production were analyzed after a 2-day acclimation period.
Multiplex immunoassay of plasma markers.
To measure total GLP-1, insulin, leptin, resistin, and ghrelin, a Bio-Plex Pro mouse diabetes immunoassay (Bio-Rad, Hercules, CA) was performed according to the manufacturer's instructions.
Real-time RT-PCR for quantification of gene expression.
Intestine, liver, and adipose tissues, including eWAT, iWAT, and BAT were collected and immediately placed in TRIzol reagent (Ambion, Austin, TX). RNA was isolated using the TRIzol and chloroform method, and RNA purity was validated through UV-Vis spectrophotometry using the Nanodrop Lite (Thermo Scientific, Wilmington, DE). Total RNA (1.0 μg) was reverse-transcribed to cDNA using the Transcriptor First-Strand cDNA Synthesis Kit (Roche, Indianapolis, IN) according to the manufacturer's instructions. RT-PCR amplification consisted of an initial denaturation step (95°C for 10 min), 45 cycles of denaturation (95°C for 10 s), annealing (55°C for 20 s), and extension (60°C for 30 s), followed by a final incubation at 55°C for 30 s and cooling at 40°C for 30 s. All measurements were normalized by expression of the GAPDH gene, which is considered to be a stable housekeeping gene. Gene expression was determined using the delta-delta Ct method: 2−ΔΔCT {ΔΔCT = [Ct(target gene) − Ct(GAPDH)]tested − [Ct(target gene) − Ct(GAPDH)]control} and displayed as relative mRNA levels. Primer sequences are provided in Table 1.
Table 1.
Primer sequences
| Gene Name | Forward Primer | Reverse Primer |
|---|---|---|
| Cyp7A1 | CATGCTTTGCATAAAGGGAA | GATCATTTTCAAGCTCTCACC |
| TGR5 | TACCACACCAGTAGCCAAT | TGCTGCTTCCCTAATTCAAG |
| PGC-1α | GACTGTAGTAAGACAGGTGC | GCTTTTTCAACTCCAATCCA |
| PGC-1β | CTCGTCCTTCTTCCTCAAC | CCAGAGTCCCCACCC |
| UCP-1 | CTGGGAGACCACGAATAAAA | AATAAAGTCAACGGAGCTGT |
| PRDM16 | CAGATCTCTGAAGACTTGGG | CTACACGGATGTACTTGAGC |
| PDGFRα | ATTACTGTTGGAGCTTGAGG | TACCCGGAGTGAAAAGTAAG |
| D2/Dio2 | CTCTGACTGATGGTTTGGAA | TTCAGTGGGACAGAAATCAG |
| FXRα | ACAGGTTTGTTAACTGAAATCC | TCACATTTTTCCTTAGCCGT |
| SHP | ACACTACTAACTGTCCAGCA | CTGGCTTGAAAGTACAGCTT |
| FGF21 | CTACCAAGCATACCCCATC | CTTGGTCGTCATCTGTGTAG |
| PPARα | GCTCCGAACATTGGTGT | AGTTCCAGGACTCCACG |
| GAPDH | AACCCTTAAGAGGGATGCTG | CATTTTGTCTACGGGACGAG |
Histological and immunofluorescence examination.
The liver, eWAT, iWAT, and BAT were collected at euthanasia and fixed overnight in 4% paraformaldehyde. Tissues were processed (Tissue-Tek V.I.P; Sakura Finetek, Torrance, CA) and embedded in paraffin. Samples were cut (5.0 μm) and placed on adhesive-coated slides (Newcomer Supply, Madison, WI), deparaffinized, rehydrated, and stained with hematoxylin and eosin. All samples (n = 5 per group) were imaged in triplicate, and representative images are shown. To assess cell proliferation, Ki-67 staining was used. Briefly, following rehydration, slides were heated in sodium citrate buffer (pH 6.0), blocked with blocking solution (x0909; Dako, Carpinteria, CA), and stained with rabbit anti-Ki-67 primary antibody (RM-9106; Thermo Scientific, Waltham, MA) in antibody diluent (S3022; Dako). Slides were washed and incubated with donkey anti-rabbit secondary antibody (A31572; Alexa Fluor Life Technologies) before being counterstained and coverslipped with ProLong Gold anti-fade with DAPI (P36931; Thermo Scientific).
3T3-L1 adipocyte culture.
3T3-L1 fibroblasts (CL-173; American Type Culture Collection) were grown in high-glucose DMEM + 10% calf serum with Pen/Strep/L-glutamine until confluent. Two days after confluence, cells were given high-glucose DMEM + 10% fetal bovine serum with Pen/Strep/L-glutamine (adipocyte media). Insulin was added again 3 days later, and cells were maintained in adipocyte media for 10 days. Oil red O staining was used to confirm lipid accumulation within adipocytes.
Statistical analysis.
Data from in vivo studies are presented as means ± SD; statistical significance was analyzed by ANOVA (StatView 4.5; Abacus Concepts, Berkeley, CA). A value of P < 0.05 was considered significant. For in vitro data, results are presented as means ± SE, and comparisons between the values were performed using the two-tailed Student's t-test; the level of significance was set at P < 0.05. Pearson correlation was used for regression analysis of circulating markers; significance was set at P < 0.05.
RESULTS
BD results in improved adiposity and glucose tolerance.
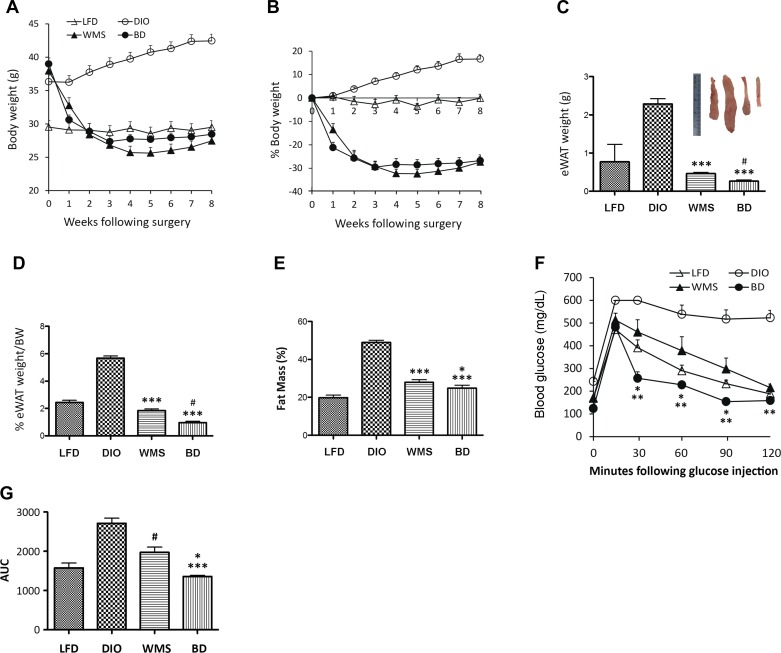
In the BD mouse model, the gallbladder is anastomosed to the distal jejunum 10 cm distal of the Treitz ligament, where the Roux limb is attached, mimicking the Roux-en-Y gastric bypass (RYGB) procedure without other rearrangements of the intestine (Fig. 1, A and B). A DIO mouse model was induced by feeding C57BL/6 male mice an HFD (60% kcal fat) for 10–12 wk until body weight reached ≥35 g. Following BD surgery, DIO mice lost 20% of body weight in the first 2 wk and stabilized in weight by 3 wk [in contrast to 40% weight loss that stabilized after 4 wk in the gallbladder-distal ileal anastomosis model (16)], compared with mice that were fed an LFD (Fig. 2, A and B). To test the body weight-independent effect of improved metabolic phenotype, a group of WMS mice was also included in this study. Mice in the WMS group were calorically restricted to consume 75% of the HFD (administered at 8:00 A.M.) compared with mice in the BD group. Body weights were comparable to those of the BD group, whereas eWAT (Fig. 2, C and D) and fat mass (Fig. 2E) were heavier in mice in the WMS group compared with the BD group.
Fig. 2.
BD improves obesity and glucose tolerance. A: BD and WMS animals had reduced body weight (in grams). B: percentage of reduced body weight in BD and WMS groups, n = 10 per group. C: BD reduces epididymal white adipose tissue (eWAT) (weight in grams). The inset photographs represent eWAT of LFD, DIO, WMS, and BD, respectively, collected at 8 wk postsurgery. *WMS and BD vs. DIO, P < 0.001; #BD vs. WMS, P = 0.0015. D: BD reduces eWAT weight (percentage of body weight). *BD and WMS vs. DIO, P < 0.001; #BD vs. WMS, P = 0.0002. E: BD improves fat mass. Whole body fat mass was measured by dual-energy X-ray absorptiometry (see materials and Methods). *BD vs. WMS, P < 0.05; ***WMS and BD vs. DIO, P < 0.001. F: IPGTT was performed at 8 wk postsurgery. *BD vs. WMS, P < 0.05; **vs. DIO, P < 0.01, n = 5 per group. G: area under the curve of IPGTT. *BD vs. WMS, P < 0.05; ***BD vs. DIO, P < 0.001, and #WMS vs. DIO, P < 0.05 (n = 5 per group). All values are presented as means ± SE.
Intraperitoneal glucose tolerance tests were performed at 2 and 8 wk. The HFD led to impaired glucose and insulin tolerance in DIO mice compared with mice that were fed the LFD, and BD resulted in significantly improved glucose tolerance at 2 wk (Fig. 1, C and D) and 8 wk (Fig. 2, F and G) postsurgery. Although body weights in WMS mice were comparable to those of BD mice, visceral fat mass was not significantly improved in WMS mice, which also had impaired glucose tolerance compared with the BD group, implying that elevated bile acids regulate glucose homeostasis following an HFD.
BD dramatically alters bile acid homeostasis.
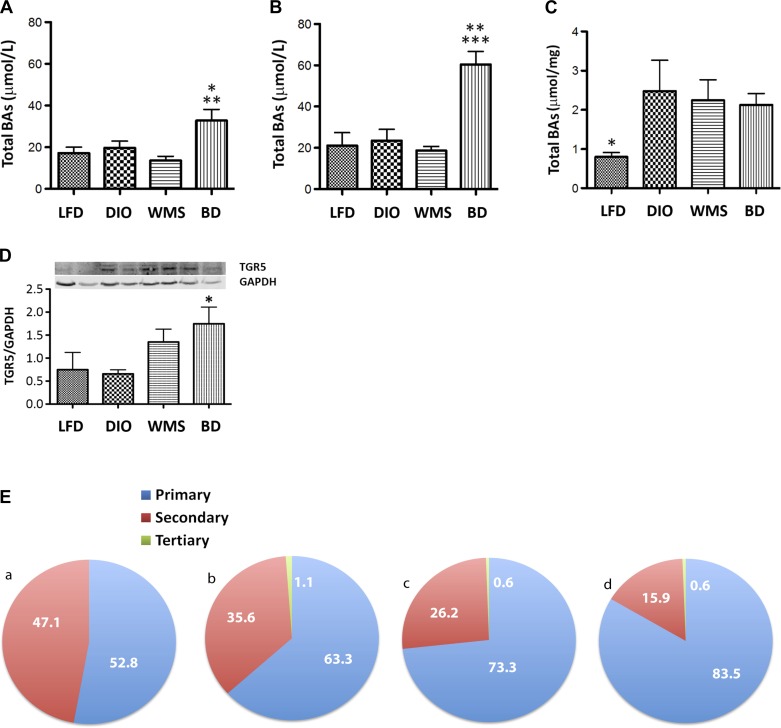
The BD procedure delivers high volumes of unmodified bile acids to the distal intestine, resulting in significant increases in total bile acids in both portal vein and peripheral compartments (Fig. 3, A and B). Furthermore, fecal bile acid (Fig. 3C) levels were not significantly different in mice in the BD group compared with those in the DIO and WMS groups, indicating that BD enhances bile acid enterohepatic circulation by elevating total circulating bile acids without inducing malabsorption. Expression of the ileal bile acid receptor TGR5 was increased in BD mice (Fig. 3D), which was consistent with elevated serum GLP-1 release from intestinal enteroendocrine L-cells.
Fig. 3.
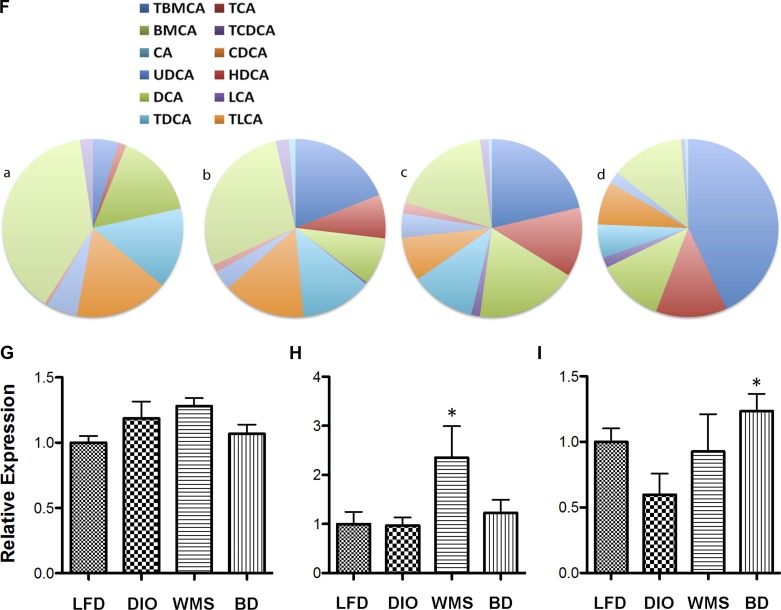
BD regulates bile acid homeostasis (at 8 wk postsurgery). A: total bile acids in peripheral circulation. *BD vs. LFD and DIO, P < 0.05; **BD vs. WMS, P < 0.01. B: total bile acids in portal vein. **BD vs. DIO, P < 0.01; ***BD vs. LFD and WMS, P < 0.001. C: total bile acids in feces. *LFD vs. DIO, WMS, and BD, P < 0.05. D: expression of TGR5 (G protein-coupled bile acid receptor 1) in ileum tissue (Western blot). *BD vs. DIO, P = 0.026. E: BD increased the relative percentage of circulating primary bile acids. F: BD increases the relative percentage of conjugated and unconjugated bile acids. a: LFD; b: DIO; c: WMS, and d: BD. The color code starts at the top and turns clockwise showing the bile acids designated by key: left→right, top→bottom. G: farnesoid X receptor (FXR) mRNA in the liver (P > 0.05 among groups). H: CYP7A1 mRNA in the liver (WMS vs. LFD, DIO, and BD, P < 0.05). I: small heterodimer partner (SHP) mRNA in the liver. *BD vs. DIO, P = 0.07. All values are presented as means ± SE.
Primary bile acids have been demonstrated to protect against obesity and insulin resistance (33, 36), whereas secondary bile acids are considered potentially toxic and associated with the development of certain cancers (4, 21, 37). However, it remains unclear whether the balance of primary vs. secondary bile acids is responsible for gastric bypass-mediated metabolic benefits. We analyzed the composition of bile acids in peripheral circulation and portal vein by triple quadrupole LCMS/MS. HFD promoted an increase in total circulating bile acids in mice in all three HFD groups compared with mice in the LFD group (Fig. 3A); however, we demonstrate that BD resulted in a dramatic increase in the relative composition of circulating primary bile acids compared with all other groups (83.5% in the BD group vs. 73.3 and 63.3% in the WMS and DIO groups, respectively, Fig. 3E). Higher primary bile acid levels included TβMCA, TCDCA, TCA, and CA. Following BD surgery, there was a significant decrease in the relative composition of secondary bile acids, which included DCA, LCA, and undetectable levels of HDCA (Fig. 3F and Table 2). Very little is known about the influence of tertiary bile acids on metabolism, and there were no significant differences in these bile acids among the groups in our study, but the mean level observed was greatest in mice in the DIO group, and it was decreased in the BD group.
Table 2.
Circulating bile acid composition
| Class | Composition | LFD | DIO | WMS | BD |
|---|---|---|---|---|---|
| Primary‡ | TβMCA | 4.63 ± 0.87 | 18.93 ± 10.17 | 21.31 ± 7.73 | 43.05 ± 4.45* |
| Primary‡ | TCA | 1.44 ± 0.64 | 7.95 ± 5.19 | 12.58 ± 4.92 | 12.74 ± 3.80* |
| Primary | βMCA | 15.41 ± 7.49 | 8.62 ± 1.60 | 18.23 ± 6.34 | 11.95 ± 3.25 |
| Primary‡ | TCDCA | 0 | 0.26 ± 0.26 | 1.56 ± 0.59* | 1.82 ± 0.76* |
| Primary | CA | 14.60 ± 3.38 | 12.82 ± 6.16 | 11.59 ± 2.95 | 6.10 ± 1.23* |
| Primary | CDCA | 16.75 ± 4.79 | 14.69 ± 3.67 | 7.98 ± 2.95 | 7.86 ± 2.05 |
| Secondary | UDCA | 5.53 ± 1.42 | 3.52 ± 2.21 | 4.44 ± 1.67 | 2.12 ± 0.67 |
| Secondary | HDCA | 0.52 ± 0.51 | 1.37 ± 1.36 | 1.91 ± 1.01 | 0 |
| Secondary | DCA | 38.78 ± 3.75 | 28.30 ± 7.03 | 18.27 ± 4.13* | 13.09 ± 3.55* |
| Secondary | LCA | 2.31 ± 0.32 | 2.37 ± 0.62 | 1.55 ± 0.47 | 0.66±.14*† |
| Tertiary | TDCA | 0 | 1.14 ± 0.71 | 0.56 ± 0.28 | 0.61 ± 0.38 |
| Total primary | 52.85 ± 5.40 | 63.29 ± 8.58 | 73.26 ± 6.04* | 83.52 ± 3.85*† | |
| Total secondary | 47.15 ± 5.40 | 35.56 ± 9.22 | 26.17 ± 6.24* | 15.88 ± 4.18* | |
| Total tertiary | 0 | 1.15 ± 0.71 | 0.56 ± 0.28 | 0.61 ± 0.38 | |
Values are presented as percentage of total measured bile acids in serum.
P < 0.05 vs. LFD.
P < 0.05 vs. DIO.
Indicates conjugated. LFD, low-fat diet; DIO, diet-induced obese; WMS, weight-matched DIO mice that underwent sham surgery; BD, bile diversion.
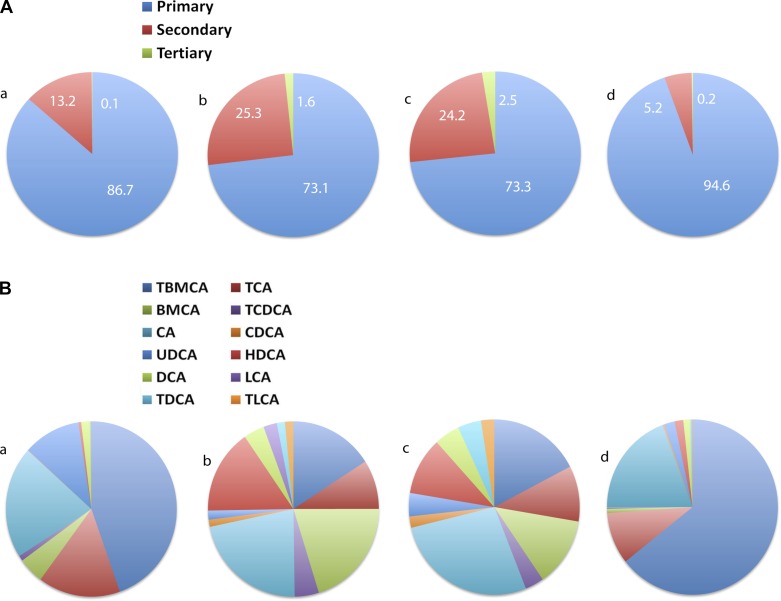
The composition of bile acid in general circulation was consistent with that of portal circulation. Strikingly, portal vein primary bile acids were significantly elevated (94.6%) in BD mice compared with LFD (86.7%), DIO (73.1%), and WMS (73.3%) mice, reflecting rapid reabsorption. In BD mice, 74.2% of bile acids were conjugated primary bile acids compared with 26.3% in DIO mice (Fig. 4, A and B, and Table 3), suggesting that conjugated primary bile acids are maintained after BD, which also limits microbial deconjugation through shortened enterohepatic circulation. Portal vein levels of the tertiary bile acid TDCA were elevated in DIO mice and significantly elevated in WMS mice, but remained low in the BD group compared with the LFD group.
Fig. 4.
A: BD increases relative percentage of primary bile acids in the portal vein. B: BD resulted in an increased relative percentage of conjugated and unconjugated bile acids in the portal vein. a: LFD; b: DIO; c: WMS, and d: BD. The color code starts at the top and turns clockwise showing the bile acids designated by key: left→right, top→bottom.
Table 3.
Portal vein bile acid composition
| Class | Composition | LFD | DIO | WMS | BD |
|---|---|---|---|---|---|
| Primary§ | TβMCA | 44.59 ± 10.2 | 15.90 ± 4.65 | 17.38 ± 2.40* | 64.35 ± 1.65†‡ |
| Primary§ | TCA | 15.56 ± 5.56 | 9.08 ± 2.49 | 10.27 ± 2.89 | 9.56 ± 1.38 |
| Primary | βMCA | 20.64 ± 11.21 | 21.96 ± 1.85 | 27.25 ± 4.73 | 19.33 ± 1.42 |
| Primary§ | TCDCA | 0.08 ± 0.08 | 1.32 ± 0.34* | 2.08 ± 0.65* | 0.30 ± 0.30 |
| Primary | CA | 4.85 ± 3.83 | 20.21 ± 5.42* | 12.78 ± 3.62 | 0.79 ± 0.46†‡ |
| Primary | CDCA | 0.98 ± 0.98 | 4.58 ± 1.38 | 3.54 ± 1.37 | 0.28 ± 0.28† |
| Secondary | UDCA | 0.19 ± 0.19 | 1.52 ± 0.59 | 4.45 ± 0.98* | 0.31 ± 0.31‡ |
| Secondary | HDCA | 1.59 ± 1.10 | 3.93 ± 1.13 | 4.82 ± 1.50 | 1.19 ± 0.56 |
| Secondary | DCA | 0.52 ± 0.52 | 15.66 ± 3.49* | 10.65 ± 1.65* | 1.65 ± 0.95†‡ |
| Secondary | LCA | 10.85 ± 3.93 | 1.67 ± 0.32* | 4.30 ± 0.41 | 2.00 ± 0.45*‡ |
| Secondary | GDCA | 0 | 2.55 ± 2.55 | 0 | 0 |
| Tertiary | TDCA | 0.13 ± 0.13 | 1.61 ± 0.67 | 2.49 ± 0.70* | 0.23 ± 0.23‡ |
| Total primary | 86.71 ± 3.48 | 73.05 ± 5.52 | 73.29 ± 3.01* | 94.62 ± 1.10*†‡ | |
| Total secondary | 13.16 ± 3.52 | 25.34 ± 6.06 | 24.21 ± 2.91* | 5.15 ± 1.09*†‡ | |
| Total tertiary | 0.13 ± 0.13 | 1.61 ± 0.68 | 2.49 ± 0.70* | 0.22 ± 0.22‡ | |
Values are presented as percentage of total measured bile acids in serum.
P < 0.05 vs. LFD.
P < 0.05 vs. DIO.
P < 0.05 vs. WMS.
Indicates conjugation.
Bile acids negatively regulate their own synthesis by repressing CYP7A1, an enzyme that governs the rate-limiting step in converting cholesterol to bile acids in the liver. An increase in bile acids activates FXR, which induces expression of fibroblast growth factor 19 (FGF19), a negative regulator of bile acid production by small heterodimer partner (SHP)-dependent and -independent mechanisms (22). Our findings show that BD induced no changes in liver FXR (Fig. 3G) or CYP7A1 (Fig. 3H), but SHP expression was significantly increased (Fig. 3I). In contrast, WMS mice under caloric restriction exhibited significantly elevated CYP7A1 expression, which is consistent with decreased recovery of bile acids from the bowel during periods of fasting (Fig. 3H), indicating an increase in bile acid synthesis. These data collectively show that BD delivers bile acids to the distal intestine and results in increased absorption of bile acids, predominately conjugated primary bile acids, which subsequently activate TGR5 and influence the feedback regulation of bile acid synthesis.
BD results in improved adipocyte hypertrophy and liver steatosis.
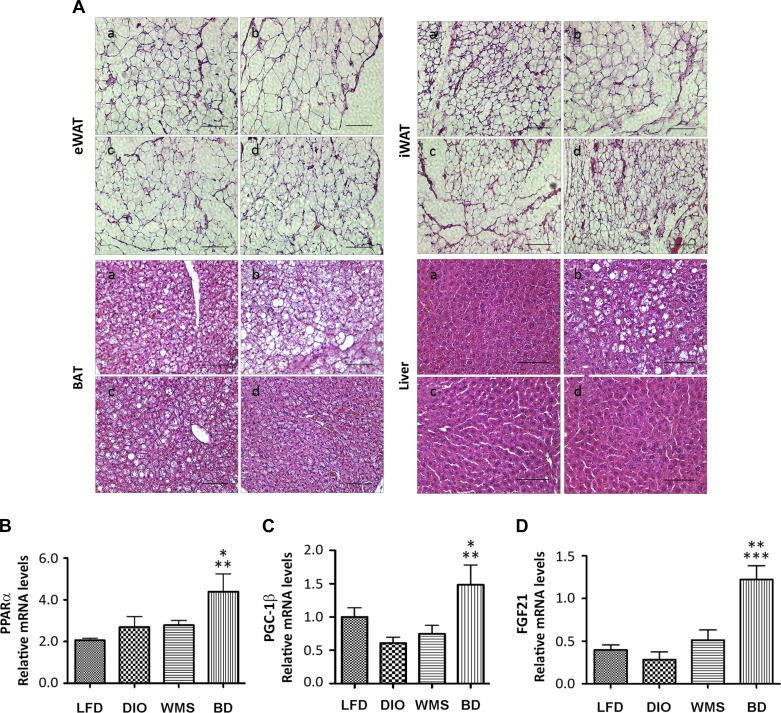
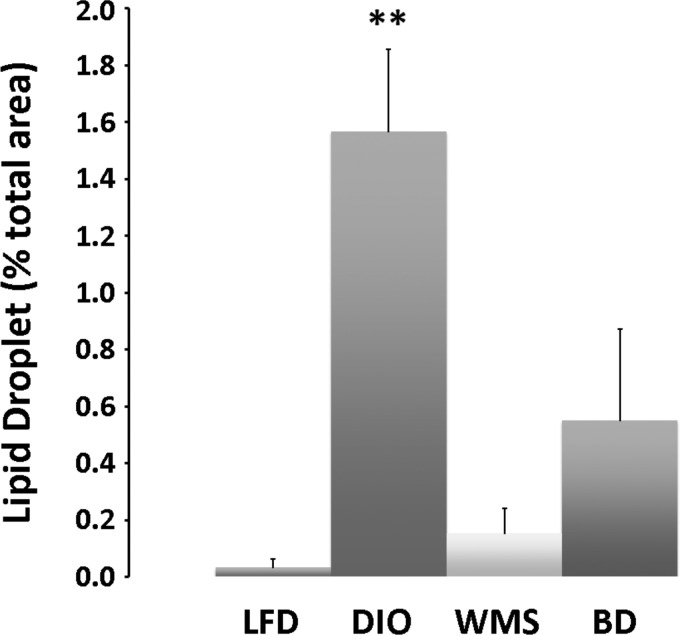
Expansion of WAT is associated with the greatest risk of developing obesity, T2D, and nonalcoholic fatty liver disease (NAFLD), whereas reduced capacity to expand WAT correlates with improvements in obesity, diabetes, and NAFLD (50). The HFD in our study induced adipocyte hypertrophy in eWAT, iWAT, and BAT tissues, and liver steatosis (Fig. 5A). Bile acids are essential for lipid absorption; thus although bile acids are diverted to the distal intestine, their absence in the proximal intestine in the BD group resulted in reduced lipid absorption. Both BD and caloric restriction (the WMS group) resulted in improved adipocyte hypertrophy and liver steatosis at 8 wk postsurgery (Fig. 5A and Fig. 6).
Fig. 5.
BD improves hypertrophy of adipocytes and liver steatosis. Epididymal WAT, inguinal WAT (iWAT), brown adipose tissue (BAT) and liver tissues were collected at 8 wk postsurgery and subjected to lipid and histological examinations and liver metabolic gene analysis. A: histological examinations of eWAT, iWAT, BAT, and liver in LFD (a), DIO (b), WMS (c), and BD (d) mice. B: peroxisome proliferator-activated receptor α (PPARα). *BD vs. DIO and WMS, P < 0.05; **BD vs. LFD, P < 0.01. C: peroxisome proliferator-activated receptor γ coactivator-1β (PGC-1β). *BD vs. WMS, P < 0.05; **BD vs. DIO, P < 0.01. D: fibroblast growth factor 21 (FGF21). **BD vs. WMS, P < 0.01; ***BD vs. LFD and DIO, P < 0.001 (n = 5 per group). All values presented as means ± SE.
Fig. 6.
BD reduces lipid droplets in the liver. Hepatic liver lipid droplet area was assessed in histology sections and normalized to total area. Compared with LFD, DIO resulted in dramatically induced steatosis that was prevented with caloric restriction (WMS) and BD surgery. **DIO vs. DIO, WMS, and BD, P < 0.01.
Peroxisome proliferator-activated receptor γ coactivator-1β (PGC-1β) regulates fatty acid oxidation and protects against liver steatosis (18). FGF21 is another liver target that plays an important role in protecting against obesity-induced hepatic metabolic stress by enhancing fatty acid oxidation and tricarboxylic acid cycle flux. FGF21 induces and activates peroxisome proliferator-activated receptor-α (PPARα), thereby ameliorating liver steatosis (34), and FGF21 deficiency augments hepatic lipid accumulation (8). Our results show that liver gene expression of PPARα (Fig. 5B), PGC-1β (Fig. 5C), and FGF21 (Fig. 5D) were significantly increased in the BD group compared with the DIO group, which is consistent with the histological changes we observed. Thus our data suggest that reduced lipid absorption and altered transcriptional factors in the liver following BD contribute to improved lipid profile, adiposity, and liver steatosis.
BD regulates circulating enterohormones.
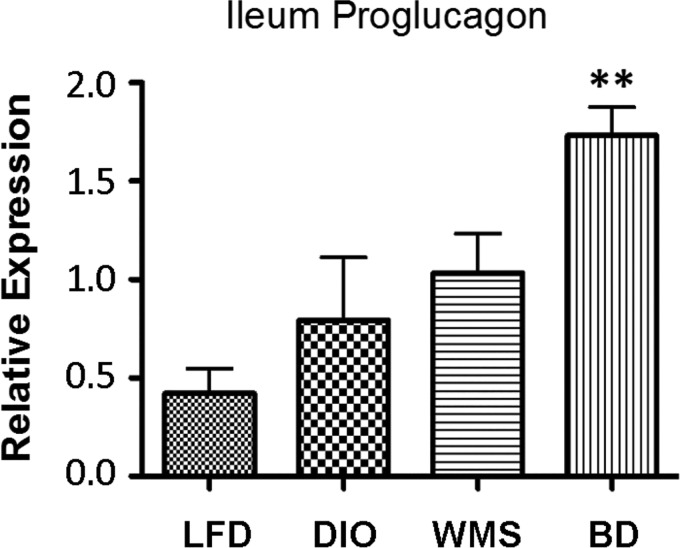
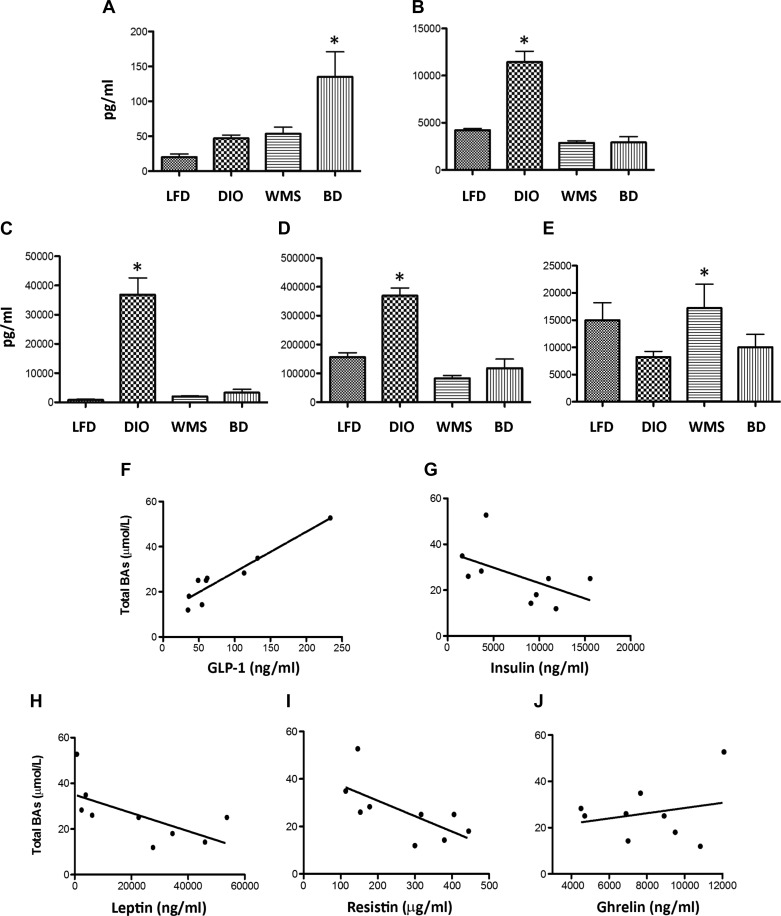
Thomas et al. (53) previously demonstrated that TGR5 activator (INT-77) induces GLP-1 secretion, which is blunted by TGR5-RNA interference. Our study shows that BD resulted in increased proglucagon gene expression, a precursor of GLP-1 (Fig. 7), and higher circulating GLP-1 levels (Fig. 8A), which is in line with increased TGR5 expression in the ileum (Fig. 3D). Overactivation of β-cells compensates for insulin resistance through insulin hypersecretion, resulting in hyperinsulinemia. Circulating insulin was significantly increased in untreated DIO mice, but it was reduced in BD and WMS mice (Fig. 8B). Leptin, secreted by adipocytes, is linked to obesity, insulin resistance, and inflammatory responses. HFD intake triggers increased circulating leptin, which was decreased in the BD and WMS groups, as shown in Figure 8C. Resistin, an inflammatory adipokine, was considered as a determinant of the emergence of insulin resistance in obesity and appeared as an important link between obesity and inflammatory processes. Resistin, an inflammatory adipokine, is considered an important determinant during insulin resistance in obesity and appears to be an important link between obesity and inflammatory processes. Resistin was increased in mice in the DIO group compared with the LFD group, but it was reduced in the BD and WMS groups (Fig. 8D). Circulating ghrelin, which is predominantly produced by the stomach to stimulate hunger, was not significantly different between mice in the BD and DIO groups, whereas, expectedly, caloric restriction (WMS mice) resulted in elevated ghrelin levels (Fig. 8E). To test whether increased bile acids were associated with changes in circulating enterohormones and adipokines, the relationships between circulating total bile acids and circulating GLP-1, leptin, insulin, resistin, and ghrelin were analyzed in mice in the DIO and BD groups. In our sample set, Pearson correlation analysis demonstrated that circulating total bile acid levels were positively correlated with circulating GLP-1 levels (Fig. 8F), and negatively correlated with circulating leptin (Fig. 8H) and resistin levels (Fig. 8I). There was no correlation between total bile acids and insulin (Fig. 8G) or ghrelin (Fig. 8J). These data suggest that activation of bile acid signaling promotes GLP-1 release and regulates leptin, resistin, and insulin secretion.
Fig. 7.
BD enhances expression of proglucagon mRNA in the ileum. BD resulted in an elevated expression of proglucagon, the glucagon-like peptide-1 (GLP-1) precursor gene, compared with other treatment groups. *BD vs. LFD, DIO, and WMS, P < 0.01.
Fig. 8.
BD regulates circulating enterohormones. Sera were collected at 8 wk postsurgery and subjected to enterohormone analysis by the Bio-Plex Pro Mouse Diabetes 8-Plex Assay kit (Bio-Rad). A: circulating GLP-1; *BD vs. all other groups, P < 0.05. B: circulating insulin; *DIO vs. all other groups, P < 0.05. C: circulating leptin; *DIO vs. all other groups, P< 0.05. D: circulating resistin; *DIO vs. all other groups, P < 0.05. E: circulating ghrelin; *WMS vs. DIO, P < 0.05. F: relationship between total bile acids and circulating GLP-1 levels in DIO and BD mice (P < 0.001). G: relationship between total bile acids and circulating insulin levels in DIO and BD mice (P = 0.13); H: relationship between total bile acids and leptin levels in DIO and BD mice (P = 0.05); I: relationship between total bile acids and resistin levels in DIO and BD mice (n = 5, P = 0.05); J: relationship between total bile acids and ghrelin levels in DIO and BD mice (P = 0.54); n = 9 in each group. All values are presented as means ± SE.
BD promotes proximal intestine proliferation, which is reversed when mice are fed bile acids.
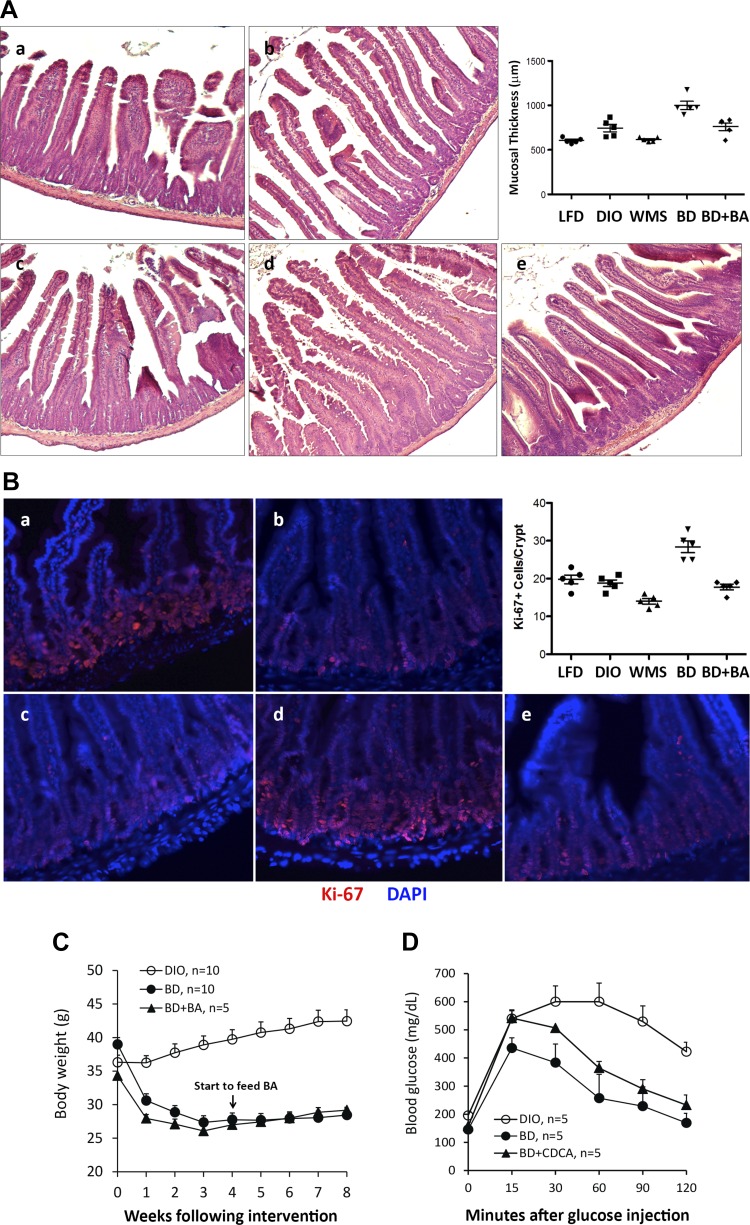
Previous reports have shown that gastric bypass induces epithelial proliferation and mucosal hypertrophy in the Roux limb as a result of stimulated nutrient sensing (29, 44). These findings led to the hypothesis that increased mucosal proliferation and potentially enhanced mucosal metabolism of nutrients contributed to an improved metabolic phenotype. We tested this hypothesis by first investigating whether the absence of bile acids contributes to intestinal hypertrophy by analyzing mucosal thickness and expression of the nuclear proliferation protein Ki-67, a marker of cellular proliferation. The duodenum was collected at 8 wk postsurgery and subjected to histological and immunofluorescence examination. Our findings demonstrate that duodenal mucosal thickness was significantly greater in mice in the BD group compared with those in the LFD, DIO, and WMS groups (Fig. 9A). Expression of Ki-67 in the duodenum of mice in the BD group was concomitantly increased compared expressions in DIO and WMS mice (Fig. 9B). Next, we tested whether administering bile acids to the proximal intestine by oral gavage resulted in altered duodenal cell proliferation, obesity phenotype, and glucose tolerance. Indeed, gavage of bile acids resulted in a reversal of duodenal cell proliferation (Fig. 9, A and B); however, this approach failed to abrogate reduced body weight or improve glucose tolerance induced by the BD procedure (Fig. 9, C and D). Our data suggest that an absence of bile acids triggers hypertrophy and proliferation in the proximal intestine; however, delivery of bile acids to the distal intestine, rather than resulting in hypertrophy and proliferation of the proximal intestine, is predominantly responsible for improved metabolic phenotype in our BD mouse model.
Fig. 9.
BD induces duodenal proliferation, which was reversed by bile acid administration. A: representative duodenal hematoxylin and eosin-stained duodenum with light photomicrograghs from LFD (a), DIO (b), WMS (c), BD (d), and BD + CDCA [BD mice were fed chenodeoxycholic acid (CDCA, 20 mg/kg) at the fourth week postsurgery for 4 wk] (e). The inset figure shows changes in mucosal thickness. B: representative duodenal immunohistochemical staining of Ki-67 in LFD (a), DIO (b), WMS (c), BD (d), and BD+CDCA (e) mice. The figure shows Ki-67-positive cells per crypt base. C: body weight changes after feeding CDCA (starting at the fourth week postsurgery). There was no statistical difference between BD and BD+CDCA groups (DIO, n = 10, BD, n = 10 and BD+CDCA, n = 5). D: IPGTT was performed at 8 wk postsurgery in BD mice with CDCA (20 mg/kg) for 4 wk (n = 5 per group). All values are presented as means ± SE.
BD promotes thermogenesis in WAT and enhances energy expenditure.
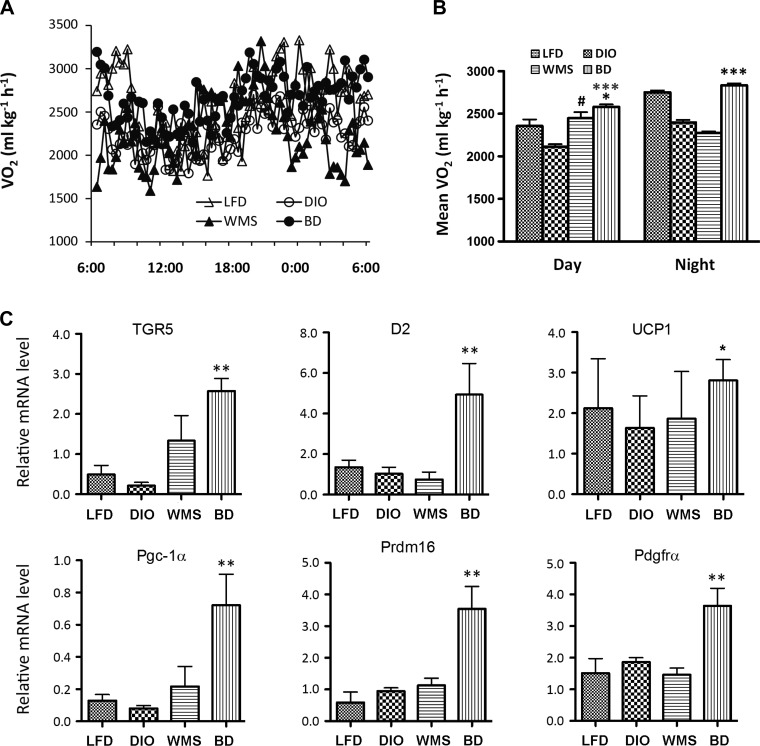
To test whether BD regulates energy expenditure, we next examined whether BD resulted in altered global energy expenditure; thus the mice were kept in an open-circuit calorimetry system for 72 h (TSE Systems, Chesterfield, MO). The results show that BD led to greater oxygen consumption and energy expenditure in DIO mice during both day and night compared with mice in the WMS and LFD groups (Fig. 10, A and B).
Fig. 10.
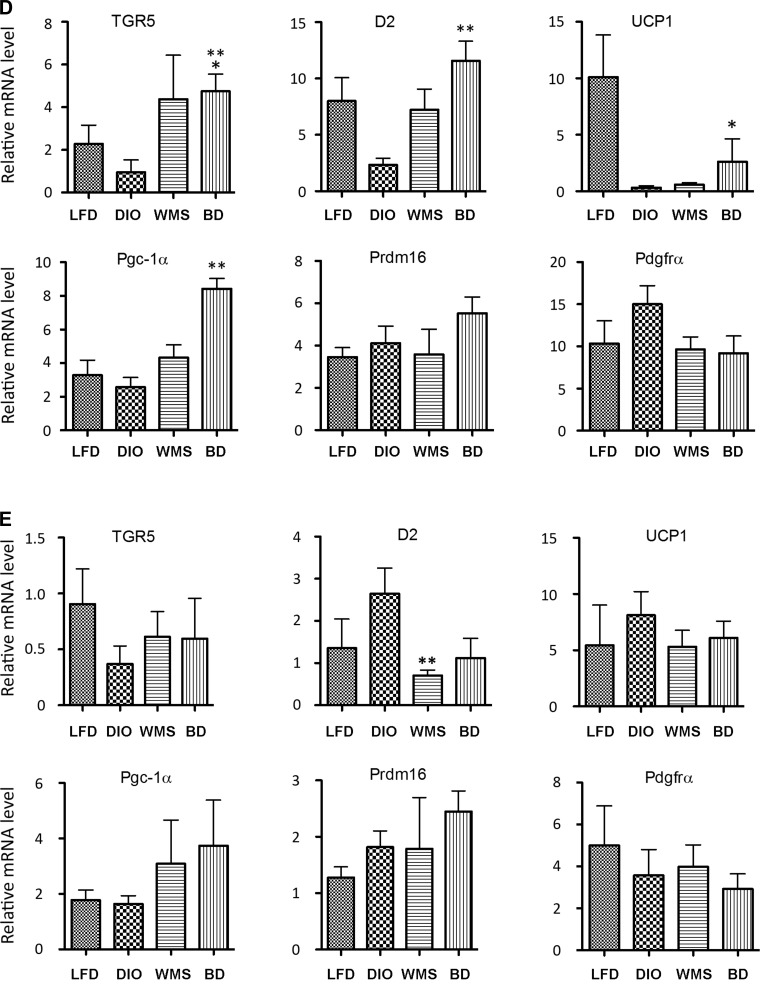
BD enhances energy expenditure and promotes thermogenesis. A: energy expenditure: 24-h oxygen consumption (n = 5 per group). B: energy expenditure: day and night oxygen consumption. Daytime, *BD vs. WMS P < 0.05; ***BD vs. DIO, P < 0.001; #WMS vs. DIO, P < 0.05. Nighttime, ***BD vs. DIO and WMS, P < 0.001, n = 5 per group. C: TGR5, type-2 iodothyronine deiodinase (D2), and thermogenic genes in eWAT. **BD vs. TGR5, LFD, and DIO, P < 0.01; D2, **BD vs. LFD, DIO, and WMS, P < 0.01; uncoupling protein 1 (UCP1), *BD vs. DIO, P < 0.05; PGC-1α, **BD vs. LFD and DIO, P < 0.01; PR domain-containing 16 (PRDM16), **BD vs. LFD, DIO, and WMS, P < 0.01; and platelet-derived growth factor receptor-α (PDGFRα), **BD vs. LFD, DIO, and WMS, P < 0.01. D: TGR5, D2, and thermogenic genes in iWAT. *BD vs. TGR5 and LFD, P < 0.05; BD vs. DIO, P < 0.01; D2, **BD vs. DIO, P < 0.01; UCP1, **BD vs. DIO, P < 0.01; BD vs. PGC-1α, LFD, WMS, and DIO, P < 0.01; and BD vs. PDGFRα, LFD, DIO, and WMS, P < 0.01. E: there is no statistical differences among all groups (P < 0.05 except D2, WMS vs. DIO, P < 0.01). All values are presented as means ± SE.
To investigate changes in adipocyte morphology, we focused on thermogenesis-related genes. Following bile acid stimulation, TGR5 activation enhances cAMP levels and activates D2, thereby promoting expression of UCP1 via the active metabolite T3, and thereby regulating energy homeostasis (59). We used quantitative RT-PCR to measure TGR5, D2, and thermogenic gene expression in fat samples. Our findings show that TGR5 and D2 expression were dramatically elevated in eWAT (Fig. 10C) in mice in the BD group compared with the other groups. TGR5 and D2 gene expression were both decreased in iWAT in mice in the DIO group compared with other treatments, reaching significance compared with BD (Fig. 10D). Gene expression for UCP1, PGC-1α, PR domain-containing 16 (PRDM16), and alpha-type platelet-derived growth factor receptor-α (PDGFα) were significantly increased in eWAT in BD mice, which is particularly resistant to browning induction (35) (Fig. 10C). UCP1 mRNA was increased in iWAT of BD mice compared with DIO mice, and PGC-1α was increased in iWAT of mice in the BD group compared with the LFD, DIO, and WMS groups (Fig. 10D). Interestingly, there were no significant increases in D2, TGR5, or thermogenic genes in BAT of mice in the BD group (Fig. 10E).
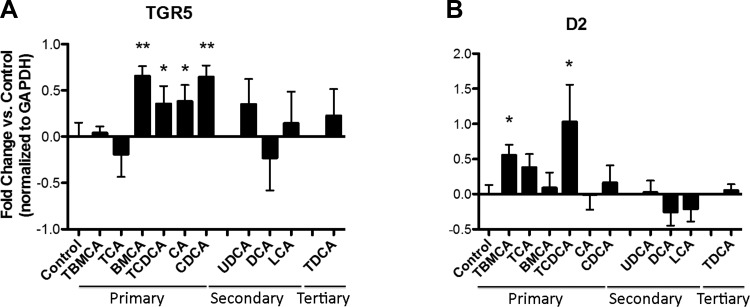
In line with in vivo observations, incubation of 3T3-L1 adipocytes with taurine resulted in conjugated primary bile acids, including TβMCA and TCDCA for 24 h (RPMI-1640 medium) and significantly increased expression of D2 mRNA, whereas expression of TCA was also increased but not to significant levels. Unconjugated and conjugated primary bile acids, including βMCA, CA, CDCA, and TCDCA promoted expression of TGR5 (Fig. 11, A and B).
Fig. 11.
Primary bile acids promote TGR5 and D2 mRNA expressions in 3T3-L1 adipocytes. A: β-muricholic acid (βMCA), tauro-conjugated chenodeoxycholic acid (TCDCA), cholic acid (CA), and chenodeoxycholic acid (CDCA) promote TGR5 mRNA expression (*P < 0.05, **P < 0.01). B: tauro-conjugated β-muricholic acid (TβMCA) and TCDCA significantly increased expression of D2 mRNA (P < 0.05), whereas TCA increased D2 expression, but not significantly (P = 0.10).
BD results in modulation of gut microbiota composition.
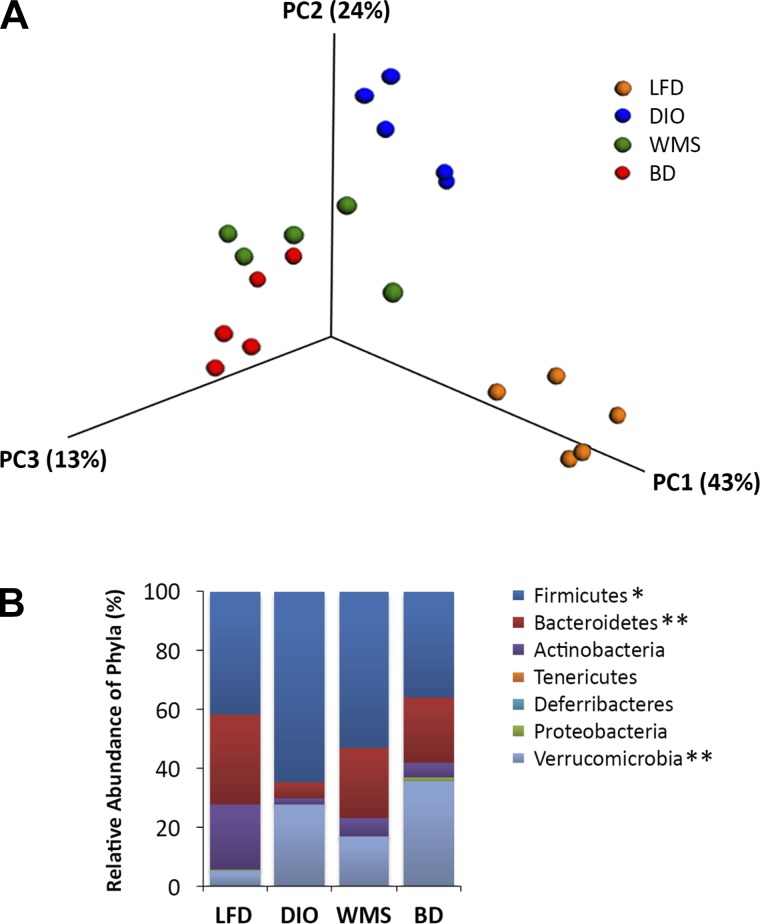
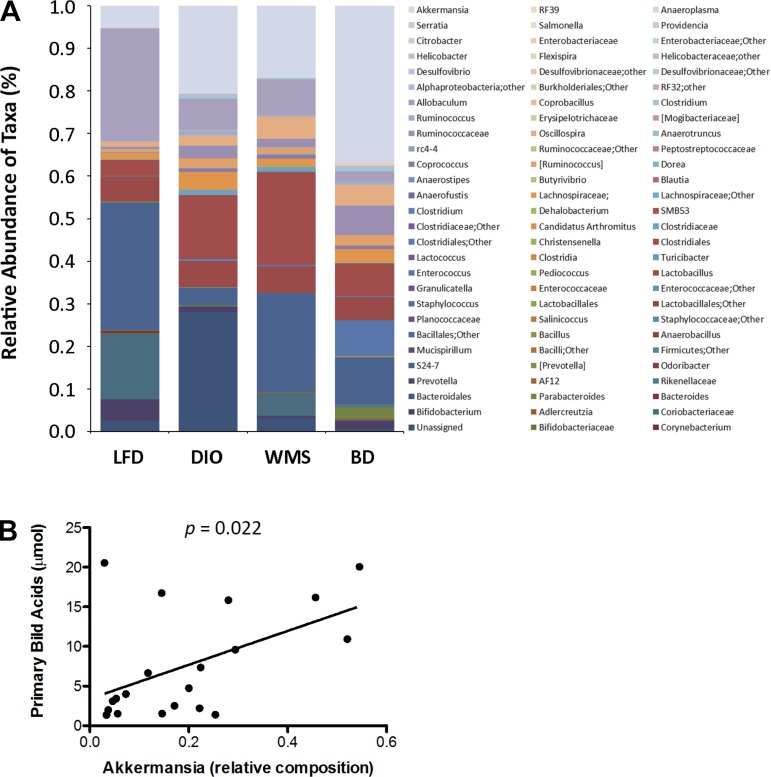
Given that bile acids influence the microbiome, we hypothesized that diversion of bile acids to the distal intestine would modulate the hindgut microbiota profile. Cecal contents were collected at 8 wk postsurgery and subjected to pyrosequencing; in particular targeting the V3–V4 region of the 16S rRNA gene (27). Weighted Unifrac analysis of beta diversity in Figure 12A revealed that mice in the DIO group exhibited a significantly different cluster than mice in the LFD group, and that mice in the BD group showed a cluster that was distinct from that of mice in the DIO group. Increased Firmicutes and decreased Bacteroidetes bacteria were observed in DIO mice, which is in accord with a previous report on obesity (30). Mice in the BD and WMS groups exhibited increased Bacteroidetes, whereas the most significant decrease in Firmicutes occurred in mice in the BD group, thus decreasing the ratio of Firmicutes/Bacteroidetes compared with that of mice in the DIO group. Interestingly, mice in the BD group exhibited a significant increase in phylum Verrucomicrobia relative to any other mouse groups (Fig. 12B), and within that, bacteria of the genus Akkermansia (37%) were significantly increased in mice in the BD group compared with increases in the LFD (5%), DIO (20%), and WMS (17%) groups (Fig. 13A). As shown in Figure 13B, circulating primary bile acids were positively correlated with increased cecal Akkermansia.
Fig. 12.
BD alters the phyla of the cecal content microbiome. A: cluster analysis of LFD, DIO, WMS, and BD mice (n = 5 per group). B: reconfiguration of the gut microbiota. *The phylum Firmicutes was decreased in BD mice (BD vs. DIO, P = 0.03). **The phylum Batcteroidetes was increased in WMS and BD groups (WMS and BD vs. DIO, P < 0.01 and P < 0.001), and the phylum Verrucomicrobia increased in BD mice (BD vs. DIO, P = 0.02, and BD vs. WMS P < 0.01, n = 5 per group). All values are presented as means ± SE.
Fig. 13.
BD alters the genera of the cecal content microbiome. A: Akkermansia (37%) was significantly increased in the BD group compared with LFD (5%), DIO (20%), and WMS (17%), P < 0.01 (n = 5 per group). B: circulating primary bile acids positively correlated with Akkermansia. The relationship between circulating primary bile acid levels and cecal Akkermansia relative composition was analyzed at 8 wk postsurgery (n = 20).
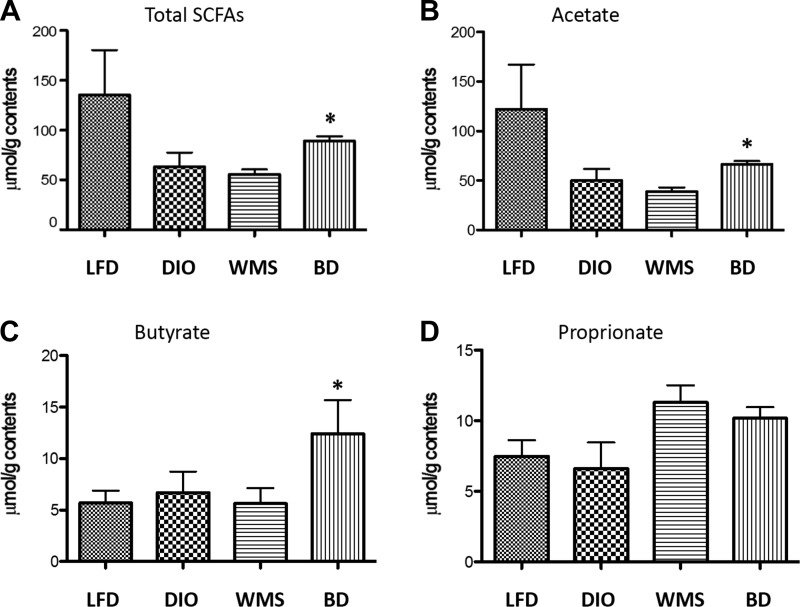
One important function of the gut microbiota is to catabolize dietary fibers that are fermented to SCFAs, which play important roles in regulation of metabolism and immunity at multiple levels. Whereas Firmicutes (producers of SCFAs) were reduced, Akkermansia, another producer of SCFAs, were increased. We found an increase in total SCFAs (Fig. 14A), in which acetate (Fig. 14B) and butyrate (Fig. 14C), but not proprionate (Fig. 14D), were significantly increased (P < 0.05) in mice in the BD group at 8 wk postsurgery. Our findings confirm that higher levels of bile acids in the distal intestine influence the gut microbiota composition and potentially function in a way that can influence host metabolism.
Fig. 14.
BD increases butyrate in cecal contents. A: total cecal short-chain fatty acids. *BD vs. DIO and WMS, P < 0.05. B: cecal acetate. *BD vs. DIO and WMS, P < 0.05. C: butyrate. *BD vs. LFD, DIO, and WMS, P < 0.05. D: cecal proprionate (P > 0.05 among all groups); (n = 5 in DIO, WMS, and BD groups, n = 3 in the LFD group).
DISCUSSION
Bile acids facilitate the uptake of lipids and fat-soluble vitamins. They also function as signaling molecules for enterohormone release, influence the intestinal microbiome, and alter peripheral energy homeostasis. Here, we tested the role of bile acid signaling in an effort to improve obesity and glycemic control using the newly developed BD mouse model. In the BD procedure, bile flow is diverted to the distal jejunum, and bile acids are absorbed predominately through enterohepatic circulation, resulting in increased circulating bile acid levels that mimic the RYGB procedure in which the Roux limb is attached to and allows bile flow into the distal jejunum (33). This optimized procedure differs from a previous biliary diversion model created by D.P. Yin (16), in which the gallbladder is anastomosed to the ileum, and significant malnutrition develops (40% weight loss at 4 wk postsurgery with elevated fecal lipids). The current model does not create significant negative consequences such as malnutrition and anemia. The mice that were calorically restricted and underwent sham surgery (WMS) consumed 75% of the HFD compared with mice in BD group so as to match and control for body weight effects. Although body weight was significantly reduced in mice in both the BD and WMS groups, the latter through direct caloric restriction, the WMS procedure was less efficient at improving white adipocyte hypertrophy, glucose tolerance, and expression of thermogenic genes in eWAT compared with that of mice in the BD group. Nevertheless, BD increases bile acid absorption, triggers enterohormone release, regulates metabolic gene expression in the liver, modulates the gut microbiota, and dramatically promotes thermogenesis, thereby improving obesity, insulin resistance, and energy expenditure in a very mechanistically distinct way from simple caloric restriction.
Higher levels of primary bile acids are associated with protection from obesity and insulin resistance, whereas secondary bile acids have been shown to potentiate certain cancers (4, 33). Administration of primary bile acids enhances energy expenditure, increases insulin sensitivity, and reduces liver inflammatory makers (59). TβMCA is increased in germ-free mice that are resistant to HFD-induced obesity and is reduced by the presence of a gut microbiota (45). Our findings show that taurine-conjugated bile acids such as TβMCA and TCDCA were increased in wild-type (WT) mice fed an HFD, and were further increased in mice in the BD group. In contrast, BD resulted in decreased secondary bile acids, including DCA, compared with secondary bile acid levels in mice in the LFD and DIO groups. There was no change in CYP7A1 expression in the livers of BD mice compared with those of DIO mice, suggesting that increased absorption, rather than increased synthesis, contributes to elevated circulating primary bile acids. In contrast, caloric restriction in WMS mice failed to increase bile acid levels in the portal vein; however, reduced bile acid absorption due to caloric restriction appears to promote CYP7A1 expression in the liver, resulting in increased bile acid synthesis.
TGR5 activation stimulates membrane depolarization that opens calcium-gated voltage channels and triggers the release of GLP-1 from enteroendocrine L-cells in the ileum and promotes expression of GLP-1 receptor, accounting for enhanced postprandial insulin secretion and improved glucose homeostasis (38, 52). The rapid passage of nutrients to the distal intestine from the stomach could plausibly enhance GLP-1 secretion during bariatric surgery. However, in our BD model, we note increased ileal TGR5 and proglucagon expression and circulating GLP-1 levels in BD mice, and total bile acid levels that have significant positive correlation with circulating GLP-1. This suggests that bile acid signaling triggers release of GLP-1, because the BD procedure does not otherwise manipulate gut anatomy. There was no significant increase in ileal FXR, which may be associated with increased TβMCA, a natural FXR antagonist (45).
β-Cell overactivation compensates for insulin resistance with hypersecretion of insulin, resulting in hyperinsulinemia. In our work, circulating insulin was significantly increased in DIO mice, but it was reduced by BD, which is consistent with our previous finding that the RYGB procedure improves β-cell viability (61). Leptin, secreted by adipocytes, is linked to obesity, insulin resistance, and inflammatory responses. An HFD triggers increased circulating leptin in DIO mice that was reduced in BD mice, which is in line with improved adiposity and reduced plasma insulin levels. Resistin, another inflammatory adipokine, was elevated in DIO mice, but BD resulted in resistin being maintained at levels that were compatible with those of mice in the LFD and WMS groups. Previous studies suggest that exclusion of the gastric fundus is responsible for lower ghrelin level efficacy in gastric bypass surgery (10); however, other data fail to support this because plasma ghrelin is increased or unchanged following surgical weight loss (17, 57, 60). In our work, we did not observe significant changes in circulating ghrelin in mice that underwent BD, whereas increased ghrelin was observed in mice in the WMS group, which is consistent with the notion of “hunger” in caloric-restricted mice. Therefore, increased bile acids in the distal intestine appear to improve glucose homeostasis and inhibit inflammatory response associated with the regulation of enterohormones, adipokines, and β-cell function.
Previous research has demonstrated that the Roux limb in RYGB-treated rats exhibits intestinal proliferation and reprogramming of glucose metabolism (44). A more recent report showed that intestinal gluconeogenesis and proliferation are increased in the intestine when it is devoid of bile acids (18). It is thought that these changes influence peripheral metabolism. We noted increased intestinal proliferation characterized by mucosal hypertrophy and elevated Ki-67 expression in the duodenum of mice that underwent BD, indicating that the absence of bile acids in the proximal intestine mediates intestinal hyperplasia in the presence of enteral nutrient stimulation. We tested this assumption by orally administering bile acids after BD surgery. We observed that oral gavage of primary bile acid (CDCA) reverses hypertrophy and reduces Ki-67-positive cells in the duodenum; however, this mechanism did not abrogate BD-induced systemic metabolic benefits. Our findings show that nutrients in the absence of bile acids within the proximal intestine induce intestinal proliferation, whereas higher levels of primary bile acids in the distal intestine mediate the improved metabolic phenotype.
Evidence has accumulated that BAT, or brown adipocytes in WAT, correlates with improved obesity and diabetes (6, 20, 39); thus enhancing the function of WAT browning is very attractive for the treatment of obesity and T2D. Previous findings have shown that bile acids are sensed by receptors in peripheral tissues, and that they regulate energy expenditure and thermogenesis (53). Bile acid-induced TGR5 activates D2, which increases conversion of the prohormone thyroxine (T4) to the active triiodothyronine (T3). T3 triggers the pgc1α promoter and increases PGC-1α expression. PGC-1α binds to PPARα or PPARγ to activate UCP1 expression, which is modulated by the BAT cofactor PRDM16, a critical transcriptional factor that controls a brown and brite adipocyte conversion. We found that higher levels of primary bile acids enhances gene expression of TGR5 and D2, and the thermogenic genes UCP1, PRDM16, PGC-1α, and PDGFRα in eWAT and iWAT of mice that underwent BD. Interestingly, there were no significant changes in TGR5, D2, or thermogenic genes in BAT of mice that underwent BD, suggesting that BD induces adipocyte browning not only in iWAT, but also in eWAT, which is resistant to browning induction. Liver steatosis-protected genes such as ACO, PPARα, PGC-1β, and FGF21 were increased in the livers of mice that underwent BD, indicating increased lipid oxidation and improved liver steatosis besides the promotion of thermogenesis (15). Moreover, conjugated and unconjugated primary bile acids have also promoted TGR5 and D2 expression in 3T3-L1 adipocyte cultures. Thus our study suggests that activation of bile acid signaling may have fundamentally important roles in the regulation WAT thermogenesis.
An increasing body of evidence shows the bidirectional interaction between bile acids and gut microbiota (i.e., bile acids influence the composition of the gut microbiota that in turn modify primary bile acids to generate secondary bile acids). Obesity, insulin resistance, and diabetes are associated with profound gut microbiota changes, and improved metabolic phenotype by gastric bypass is at least in part mediated by modulation of the gut microbiota (2, 33, 62). In line with previous reports in humans (31) and rodents (14, 56), our study shows that an HFD induces decreased Bacteroidetes and increased Firmicutes—with an elevated Firmicutes/Bacteroidetes ratio—which is reversible with BD. Surprisingly, BD also results in increased levels of Akkermansia muciniphila, which is demonstrated to play a key role in the integrity of the mucous layer found at lower levels of obesity (49). Furthermore, greater Akkermansia abundance positively correlates with higher levels of circulating primary bile acids, suggesting that primary bile acids might promote a relative increase in Akkermansia. In addition, BD-induced reshaping of the gut microbiota could be transferred into germ-free recipients and recapitulate the improved metabolic phenotype without influencing dietary intake.
An altered gut microbiota promotes generation of SCFAs, improves gut permeability, reduces gut-derived bacteria and bacterial components, and prevents inflammatory reactions, thereby improving insulin sensitivity. The uptake of acetate into the hypothalamus results in decreased food intake. Butyrate activates intestinal gluconeogenesis via a cAMP-dependent or a gut-brain neural circuit pathway, thus enhancing energy expenditure (12, 13). Butyrate also enhances the secretion of GLP-1 and peptide YY from L-cells via the SCFA receptors GPR41 (FFA3) and GPR43 (FFA2) (54). Indeed, increases in acetate and butyrate in BD cecal contents may explain decreased diet consumption and increased release of GLP-1; however, it does not explain the relationship between altered gut microbiota and specific SCFA generation.
In conclusion, delivery of primary bile acids to the distal jejunum significantly improves body weight, adiposity, liver steatosis, glucose tolerance, and energy expenditure. The magnitude of effect and mechanisms underlying metabolic benefits involves enhanced primary bile acid absorption and activated bile acid signaling, which regulates enterohormone release, modulates the gut microbiota profile, and promotes WAT browning. The absence of bile acids in the proximal intestine may reduce lipid absorption and promote intestinal hypertrophy, but this influence appears less important for metabolic benefits. Intriguingly, however, bile acids modulate the gut microbiota in profound ways that may alter microbiome function. Understanding the mechanisms underlying remission of obesity and insulin resistance by enhanced primary bile acid signaling provides the potential for novel pharmaceuticals and/or less invasive surgical approaches for the treatment of obesity and diabetes.
GRANTS
This study is supported in part by Clinical and Translational Science Award TR000430 to D.P. Yin; by National Institute of Diabetes and Digestive and Kidney Diseases Grants P30 DK-42086 (DDRCC), DK-097268, and T32 DK-07074 to E.B. Chang; F32 DK-105728-01A1 to J.F. Pierre; T32 DK-07074 to K.B. Martinez; and DK-020595 to the Animal Models and Physiology Core at the University of Chicago.
DISCLOSURES
No conflicts of interest, financial or otherwise, are declared by the authors.
AUTHOR CONTRIBUTIONS
E.B.C. and D.P.Y. conception and design of research; J.F.P., K.B.M., H.Y., A.N., T.C.M., J.Y., Q.W., N.P., and D.P.Y. performed experiments; J.F.P., K.B.M., A.N., T.C.M., and D.P.Y. analyzed data; E.B.C. and D.P.Y. interpreted results of experiments; J.F.P. and D.P.Y. prepared figures; D.P.Y. drafted manuscript; J.F.P. and D.P.Y. edited and revised manuscript; J.F.P., E.B.C., and D.P.Y. approved final version of manuscript.
REFERENCES
- 1.Ahmad NN, Pfalzer A, Kaplan LM. Roux-en-Y gastric bypass normalizes the blunted postprandial bile acid excursion associated with obesity. Int J Obes (Lond) 37: 1553–1559, 2013. [DOI] [PMC free article] [PubMed] [Google Scholar]
- 2.Aron-Wisnewsky J, Dore J, Clement K. The importance of the gut microbiota after bariatric surgery. Nat Rev Gastroenterol Hepatol 9: 590–598, 2012. [DOI] [PubMed] [Google Scholar]
- 3.Asayama K, Okada Y, Kato K. Peroxisomal beta-oxidation in liver and muscles of gold-thioglucose-induced obese mice: correlation with body weight. Int J Obes 15: 45–49, 1991. [PubMed] [Google Scholar]
- 4.Baptissart M, Vega A, Maqdasy S, Caira F, Baron S, Lobaccaro JM, Volle DH. Bile acids: from digestion to cancers. Biochimie 95: 504–517, 2013. [DOI] [PubMed] [Google Scholar]
- 5.Bartelt A, Bruns OT, Reimer R, Hohenberg H, Ittrich H, Peldschus K, Kaul MG, Tromsdorf UI, Weller H, Waurisch C, Eychmüller A, Gordts PL, Rinninger F, Bruegelmann K, Freund B, Nielsen P, Merkel M, Heeren J. Brown adipose tissue activity controls triglyceride clearance. Nat Med 17: 200–205, 2011. [DOI] [PubMed] [Google Scholar]
- 6.Bartelt A, Heeren J. Adipose tissue browning and metabolic health. Nat Rev Endocrinol 10: 24–36, 2014. [DOI] [PubMed] [Google Scholar]
- 7.Bianco AC, Sheng XY, Silva JE. Triiodothyronine amplifies norepinephrine stimulation of uncoupling protein gene transcription by a mechanism not requiring protein synthesis. J Biol Chem 263: 18168–18175, 1988. [PubMed] [Google Scholar]
- 8.Brestoff JR, Kim BS, Saenz SA, Stine RR, Monticelli LA, Sonnenberg GF, Thome JJ, Farber DL, Lutfy K, Seale P, Artis D. Group 2 innate lymphoid cells promote beiging of white adipose tissue and limit obesity. Nature 519: 242–246, 2015. [DOI] [PMC free article] [PubMed] [Google Scholar]
- 9.Caporaso JG, Kuczynski J, Stombaugh J, Bittinger K, Bushman FD, Costello EK, Fierer N, Peña AG, Goodrich JK, Gordon JI, Huttley GA, Kelley ST, Knights D, Koenig JE, Ley RE, Lozupone CA, McDonald D, Muegge BD, Pirrung M, Reeder J, Sevinsky JR, Turnbaugh PJ, Walters WA, Widmann J, Yatsunenko T, Zaneveld J, Knight R. QIIME allows analysis of high-throughput community sequencing data. Nat Methods 7: 335–336, 2010. [DOI] [PMC free article] [PubMed] [Google Scholar]
- 10.Cummings DE, Weigle DS, Frayo RS, Breen PA, Ma MK, Dellinger EP, Purnell JQ. Plasma ghrelin levels after diet-induced weight loss or gastric bypass surgery. N Engl J Med 346: 1623–1630, 2002. [DOI] [PubMed] [Google Scholar]
- 11.Dao MC, Everard A, Aron-Wisnewsky J, Sokolovska N, Prifti E, Verger EO, Kayser BD, Levenez F, Chilloux J, Hoyles L, MICRO-Obes Consortium, Dumas ME, Rizkalla SW, Dore J, Cani PD, Clément K. Akkermansia muciniphila and improved metabolic health during a dietary intervention in obesity: relationship with gut microbiome richness and ecology. Gut 65: 426–436, 2016. [DOI] [PubMed] [Google Scholar]
- 12.den Besten G, van Eunen K, Groen AK, Venema K, Reijngoud DJ, Bakker BM. The role of short-chain fatty acids in the interplay between diet, gut microbiota, and host energy metabolism. J Lipid Res 54: 2325–2340, 2013. [DOI] [PMC free article] [PubMed] [Google Scholar]
- 13.De Vadder F, Kovatcheva-Datchary P, Goncalves D, Vinera J, Zitoun C, Duchampt A, Bäckhed F, Mithieux G. Microbiota-generated metabolites promote metabolic benefits via gut-brain neural circuits. Cell 156: 84–96, 2014. [DOI] [PubMed] [Google Scholar]
- 14.Düfer M, Hörth K, Wagner R, Schittenhelm B, Prowald S, Wagner TF, Oberwinkler J, Lukowski R, Gonzalez FJ, Krippeit-Drews P, Drews G. Bile acids acutely stimulate insulin secretion of mouse beta-cells via farnesoid X receptor activation and K(ATP) channel inhibition. Diabetes 61: 1479–1489, 2012. [DOI] [PMC free article] [PubMed] [Google Scholar]
- 15.Ferreira AV, Menezes-Garcia Z, Mario EG, Delpuerto HL, Martins AS, Botion LM. Increased expression of oxidative enzymes in adipose tissue following PPARα-activation. Metabolism 63: 456–460, 2014. [DOI] [PubMed] [Google Scholar]
- 16.Flynn CR, Albaugh VL, Cai S, Cheung-Flynn J, Williams PE, Brucker RM, Bordenstein SR, Guo Y, Wasserman DH, Abumrad NN. Bile diversion to the distal small intestine has comparable metabolic benefits to bariatric surgery. Nat Commun 6: 7715, 2015. [DOI] [PMC free article] [PubMed] [Google Scholar]
- 17.Gelisgen R, Zengin K, Kocael A, Baysal B, Kocael P, Erman H, Taskin M, Uzun H. Effects of laparoscopic gastric band applications on plasma and fundic acylated ghrelin levels in morbidly obese patients. Obes Surg 22: 299–305, 2012. [DOI] [PubMed] [Google Scholar]
- 18.Goncalves D, Barataud A, De Vadder F, Vinera J, Zitoun C, Duchampt A, Mithieux G. Bile routing modification reproduces key features of gastric bypass in rat. Ann Surg 262: 1006–1015, 2015. [DOI] [PMC free article] [PubMed] [Google Scholar]
- 19.Harach T, Pols TW, Nomura M, Maida A, Watanabe M, Auwerx J, Schoonjans K. TGR5 potentiates GLP-1 secretion in response to anionic exchange resins. Sci Rep 2: 430, 2012. [DOI] [PMC free article] [PubMed] [Google Scholar]
- 20.Harms M, Seale P. Brown and beige fat: development, function and therapeutic potential. Nat Med 19: 1252–1263, 2013. [DOI] [PubMed] [Google Scholar]
- 21.Ignacio Barrasa J, Olmo N, Pérez-Ramos P, Santiago-Gómez A, Lecona E, Turnay J, Antonia Lizarbe M. Deoxycholic and chenodeoxycholic bile acids induce apoptosis via oxidative stress in human colon adenocarcinoma cells. Apoptosis 16: 1054–1067, 2011. [DOI] [PubMed] [Google Scholar]
- 22.Inagaki T, Choi M, Moschetta A, Peng L, Cummins CL, McDonald JG, Luo G, Jones SA, Goodwin B, Richardson JA, Gerard RD, Repa JJ, Mangelsdorf DJ, Kliewer SA. Fibroblast growth factor 15 functions as an enterohepatic signal to regulate bile acid homeostasis. Cell Metab 2: 217–225, 2005. [DOI] [PubMed] [Google Scholar]
- 23.Klingenspor M, Ivemeyer M, Wiesinger H, Haas K, Heldmaier G, Wiesner RJ. Biogenesis of thermogenic mitochondria in brown adipose tissue of Djungarian hamsters during cold adaptation. Biochem J 316, Pt 2: 607–613, 1996. [DOI] [PMC free article] [PubMed] [Google Scholar]
- 24.Knop FK. Bile-induced secretion of glucagon-like peptide-1: pathophysiological implications in type 2 diabetes? Am J Physiol Endocrinol Metab 299: E10–E13, 2010. [DOI] [PubMed] [Google Scholar]
- 25.Kohli R, Kirby M, Setchell KD, Jha P, Klustaitis K, Woollett LA, Pfluger PT, Balistreri WF, Tso P, Jandacek RJ, Woods SC, Heubi JE, Tschoep MH, D'Alessio DA, Shroyer NF, Seeley RJ. Intestinal adaptation after ileal interposition surgery increases bile acid recycling and protects against obesity-related comorbidities. Am J Physiol Gastrointest Liver Physiol 299: G652–G660, 2010. [DOI] [PMC free article] [PubMed] [Google Scholar]
- 26.Kohli R, Setchell KD, Kirby M, Myronovych A, Ryan KK, Ibrahim SH, Berger J, Smith K, Toure M, Woods SC, Seeley RJ. A surgical model in male obese rats uncovers protective effects of bile acids post-bariatric surgery. Endocrinology 154: 2341–2351, 2013. [DOI] [PMC free article] [PubMed] [Google Scholar]
- 27.Lee CK, Herbold CW, Polson SW, Wommack KE, Williamson SJ, McDonald IR, Cary SC. Groundtruthing next-gen sequencing for microbial ecology-biases and errors in community structure estimates from PCR amplicon pyrosequencing. PLoS One 7: e44224, 2012. [DOI] [PMC free article] [PubMed] [Google Scholar]
- 28.Lefebvre P, Cariou B, Lien F, Kuipers F, Staels B. Role of bile acids and bile acid receptors in metabolic regulation. Physiol Rev 89: 147–191, 2009. [DOI] [PubMed] [Google Scholar]
- 29.le Roux CW, Borg C, Wallis K, Vincent RP, Bueter M, Goodlad R, Ghatei MA, Patel A, Bloom SR, Aylwin SJ. Gut hypertrophy after gastric bypass is associated with increased glucagon-like peptide 2 and intestinal crypt cell proliferation. Ann Surg 252: 50–56, 2010. [DOI] [PubMed] [Google Scholar]
- 30.Ley RE, Backhed F, Turnbaugh P, Lozupone CA, Knight RD, Gordon JI. Obesity alters gut microbial ecology. Proc Natl Acad Sci USA 102: 11070–11075, 2005. [DOI] [PMC free article] [PubMed] [Google Scholar]
- 31.Ley RE, Turnbaugh PJ, Klein S, Gordon JI. Microbial ecology: human gut microbes associated with obesity. Nature 444: 1022–1023, 2006. [DOI] [PubMed] [Google Scholar]
- 32.Li T, Chiang JY. Bile acid signaling in metabolic disease and drug therapy. Pharmacol Rev 66: 948–983, 2014. [DOI] [PMC free article] [PubMed] [Google Scholar]
- 33.Liou AP, Paziuk M, Luevano JM Jr, Machineni S, Turnbaugh PJ, Kaplan LM. Conserved shifts in the gut microbiota due to gastric bypass reduce host weight and adiposity. Sci Transl Med 5: 178ra141, 2013. [DOI] [PMC free article] [PubMed] [Google Scholar]
- 34.Mottillo EP, Bloch AE, Leff T, Granneman JG. Lipolytic products activate peroxisome proliferator-activated receptor (PPAR) α and δ in brown adipocytes to match fatty acid oxidation with supply. J Biol Chem 287: 25038–25048, 2012. [DOI] [PMC free article] [PubMed] [Google Scholar]
- 35.Ohno H, Shinoda K, Spiegelman BM, Kajimura S. PPARγ agonists induce a white-to-brown fat conversion through stabilization of PRDM16 protein. Cell Metab 15: 395–404, 2012. [DOI] [PMC free article] [PubMed] [Google Scholar]
- 36.Ozcan U, Yilmaz E, Ozcan L, Furuhashi M, Vaillancourt E, Smith RO, Gorgun CZ, Hotamisligil GS. Chemical chaperones reduce ER stress and restore glucose homeostasis in a mouse model of type 2 diabetes. Science 313: 1137–1140, 2006. [DOI] [PMC free article] [PubMed] [Google Scholar]
- 37.Pai R, French D, Ma N, Hotzel K, Plise E, Salphati L, Setchell KD, Ware J, Lauriault V, Schutt L, Hartley D, Dambach D. Antibody-mediated inhibition of fibroblast growth factor 19 results in increased bile acids synthesis and ileal malabsorption of bile acids in cynomolgus monkeys. Toxicol Sci 126: 446–456, 2012. [DOI] [PubMed] [Google Scholar]
- 38.Parker HE, Wallis K, le Roux CW, Wong KY, Reimann F, Gribble FM. Molecular mechanisms underlying bile acid-stimulated glucagon-like peptide-1 secretion. Br J Pharmacol 165: 414–423, 2012. [DOI] [PMC free article] [PubMed] [Google Scholar]
- 39.Peirce V, Carobbio S, Vidal-Puig A. The different shades of fat. Nature 510: 76–83, 2014. [DOI] [PubMed] [Google Scholar]
- 40.Pournaras DJ, Glicksman C, Vincent RP, Kuganolipava S, Alaghband-Zadeh J, Mahon D, Bekker JH, Ghatei MA, Bloom SR, Walters JR, Welbourn R, le Roux CW. The role of bile after Roux-en-Y gastric bypass in promoting weight loss and improving glycaemic control. Endocrinology 153: 3613–3619, 2012. [DOI] [PMC free article] [PubMed] [Google Scholar]
- 41.Prawitt J, Abdelkarim M, Stroeve JH, Popescu I, Duez H, Velagapudi VR, Dumont J, Bouchaert E, van Dijk TH, Lucas A, Dorchies E, Daoudi M, Lestavel S, Gonzalez FJ, Oresic M, Cariou B, Kuipers F, Caron S, Staels B. Farnesoid X receptor deficiency improves glucose homeostasis in mouse models of obesity. Diabetes 60: 1861–1871, 2011. [DOI] [PMC free article] [PubMed] [Google Scholar]
- 42.Rosenwald M, Wolfrum C. The origin and definition of brite versus white and classical brown adipocytes. Adipocyte 3: 4–9, 2014. [DOI] [PMC free article] [PubMed] [Google Scholar]
- 43.Ryan KK, Tremaroli V, Clemmensen C, Kovatcheva-Datchary P, Myronovych A, Karns R, Wilson-Pérez HE, Sandoval DA, Kohli R, Bäckhed F, Seeley RJ. FXR is a molecular target for the effects of vertical sleeve gastrectomy. Nature 509: 183–188, 2014. [DOI] [PMC free article] [PubMed] [Google Scholar]
- 44.Saeidi N, Meoli L, Nestoridi E, Gupta NK, Kvas S, Kucharczyk J, Bonab AA, Fischman AJ, Yarmush ML, Stylopoulos N. Reprogramming of intestinal glucose metabolism and glycemic control in rats after gastric bypass. Science 341: 406–410, 2013. [DOI] [PMC free article] [PubMed] [Google Scholar]
- 45.Sayin SI, Wahlström A, Felin J, Jäntti S, Marschall HU, Bamberg K, Angelin B, Hyötyläinen T, Orešič M, Bäckhed F. Gut microbiota regulates bile acid metabolism by reducing the levels of tauro-beta-muricholic acid, a naturally occurring FXR antagonist. Cell Metab 17: 225–235, 2013. [DOI] [PubMed] [Google Scholar]
- 46.Schaap FG, Trauner M, Jansen PL. Bile acid receptors as targets for drug development. Nat Rev Gastroenterol Hepatol 11: 55–67, 2014. [DOI] [PubMed] [Google Scholar]
- 47.Schauer PR, Bhatt DL, Kirwan JP, Wolski K, Brethauer SA, Navaneethan SD, Aminian A, Pothier CE, Kim ES, Nissen SE, Kashyap SR; STAMPEDE . Investigators. Bariatric surgery versus intensive medical therapy for diabetes–3-year outcomes. N Engl J Med 370: 2002–2013, 2014. [DOI] [PMC free article] [PubMed] [Google Scholar]
- 48.Schneeberger M, Everard A, Gómez-Valadés AG, Matamoros S, Ramírez S, Delzenne NM, Gomis R, Claret M, Cani PD. Akkermansia muciniphila inversely correlates with the onset of inflammation, altered adipose tissue metabolism and metabolic disorders during obesity in mice. Sci Rep 5: 16643, 2015. [DOI] [PMC free article] [PubMed] [Google Scholar]
- 49.Shin NR, Lee JC, Lee HY, Kim MS, Whon TW, Lee MS, Bae JW. An increase in the Akkermansia spp. population induced by metformin treatment improves glucose homeostasis in diet-induced obese mice. Gut 63: 727–735, 2014. [DOI] [PubMed] [Google Scholar]
- 50.Smith U. Abdominal obesity: a marker of ectopic fat accumulation. J Clin Invest 125: 1790–1792, 2015. [DOI] [PMC free article] [PubMed] [Google Scholar]
- 51.Swann JR, Want EJ, Geier FM, Spagou K, Wilson ID, Sidaway JE, Nicholson JK, Holmes E. Systemic gut microbial modulation of bile acid metabolism in host tissue compartments. Proc Natl Acad Sci USA 108, Suppl 1: 4523–4530, 2011. [DOI] [PMC free article] [PubMed] [Google Scholar]
- 52.Thomas C, Gioiello A, Noriega L, Strehle A, Oury J, Rizzo G, Macchiarulo A, Yamamoto H, Mataki C, Pruzanski M, Pellicciari R, Auwerx J, Schoonjans K. TGR5-mediated bile acid sensing controls glucose homeostasis. Cell Metab 10: 167–177, 2009. [DOI] [PMC free article] [PubMed] [Google Scholar]
- 53.Thomas C, Gioiello A, Noriega L, Strehle A, Oury J, Rizzo G, Macchiarulo A, Yamamoto H, Mataki C, Pruzanski M, Pellicciari R, Auwerx J, Schoonjans K. TGR5-mediated bile acid sensing controls glucose homeostasis. Cell Metab 10: 167–177, 2009. [DOI] [PMC free article] [PubMed] [Google Scholar]
- 54.Tolhurst G, Heffron H, Lam YS, Parker HE, Habib AM, Diakogiannaki E, Cameron J, Grosse J, Reimann F, Gribble FM. Short-chain fatty acids stimulate glucagon-like peptide-1 secretion via the G-protein-coupled receptor FFAR2. Diabetes 61: 364–371, 2012. [DOI] [PMC free article] [PubMed] [Google Scholar]
- 55.Tubbs JT, Kissling GE, Travlos GS, Goulding DR, Clark JA, King-Herbert AP, Blankenship-Paris TL. Effects of buprenorphine, meloxicam, and flunixin meglumine as postoperative analgesia in mice. J Am Assoc Lab Anim Sci 50: 185–191, 2011. [PMC free article] [PubMed] [Google Scholar]
- 56.Vernay MC, Wellnitz O, Kreipe L, van Dorland HA, Bruckmaier RM. Local and systemic response to intramammary lipopolysaccharide challenge during long-term manipulated plasma glucose and insulin concentrations in dairy cows. J Dairy Sci 95: 2540–2549, 2012. [DOI] [PubMed] [Google Scholar]
- 57.Wang Y, Liu J. Plasma ghrelin modulation in gastric band operation and sleeve gastrectomy. Obes Surg 19: 357–362, 2009. [DOI] [PubMed] [Google Scholar]
- 58.Watanabe M, Horai Y, Houten SM, Morimoto K, Sugizaki T, Arita E, Mataki C, Sato H, Tanigawara Y, Schoonjans K, Itoh H, Auwerx J. Lowering bile acid pool size with a synthetic farnesoid X receptor (FXR) agonist induces obesity and diabetes through reduced energy expenditure. J Biol Chem 286: 26913–26920, 2011. [DOI] [PMC free article] [PubMed] [Google Scholar]
- 59.Watanabe M, Houten SM, Mataki C, Christoffolete MA, Kim BW, Sato H, Messaddeq N, Harney JW, Ezaki O, Kodama T, Schoonjans K, Bianco AC, Auwerx J. Bile acids induce energy expenditure by promoting intracellular thyroid hormone activation. Nature 439: 484–489, 2006. [DOI] [PubMed] [Google Scholar]
- 60.Ybarra J, Bobbioni-Harsch E, Chassot G, Huber O, Morel P, Assimacopoulos-Jeannet F, Golay A. Persistent correlation of ghrelin plasma levels with body mass index both in stable weight conditions and during gastric-bypass-induced weight loss. Obes Surg 19: 327–331, 2009. [DOI] [PubMed] [Google Scholar]
- 61.Yin DP, Gao Q, Ma LL, Yan W, Williams PE, McGuinness OP, Wasserman DH, Abumrad NN. Assessment of different bariatric surgeries in the treatment of obesity and insulin resistance in mice. Ann Surg 254: 73–82, 2011. [DOI] [PMC free article] [PubMed] [Google Scholar]
- 62.Zhang H, DiBaise JK, Zuccolo A, Kudrna D, Braidotti M, Yu Y, Parameswaran P, Crowell MD, Wing R, Rittmann BE, Krajmalnik-Brown R. Human gut microbiota in obesity and after gastric bypass. Proc Natl Acad Sci USA 106: 2365–2370, 2009. [DOI] [PMC free article] [PubMed] [Google Scholar]
- 63.Zhang Y, Lee FY, Barrera G, Lee H, Vales C, Gonzalez FJ, Willson TM, Edwards PA. Activation of the nuclear receptor FXR improves hyperglycemia and hyperlipidemia. Proc Natl Acad Sci USA 103: 1006–1011, 2006. [DOI] [PMC free article] [PubMed] [Google Scholar]


