

Abstract
The microbiota is a major source of protection against intestinal pathogens; however, the specific bacteria and underlying mechanisms involved are not well understood. As a model of this interaction, we sought to determine whether colonization of the murine host with symbiotic non‐toxigenic Bacteroides fragilis could limit acquisition of pathogenic enterotoxigenic B. fragilis. We observed strain‐specific competition with toxigenic B. fragilis, dependent upon type VI secretion, identifying an effector–immunity pair that confers pathogen exclusion. Resistance against host acquisition of a second non‐toxigenic strain was also uncovered, revealing a broader function of type VI secretion systems in determining microbiota composition. The competitive exclusion of enterotoxigenic B. fragilis by a non‐toxigenic strain limited toxin exposure and protected the host against intestinal inflammatory disease. Our studies demonstrate a novel role of type VI secretion systems in colonization resistance against a pathogen. This understanding of bacterial competition may be utilized to define a molecularly targeted probiotic strategy.
Keywords: colonization resistance, enterotoxigenic Bacteroides fragilis, in vivo strain competition, probiotics, type VI secretion
Subject Categories: Immunology; Microbiology, Virology & Host Pathogen Interaction
Introduction
Bacterial antagonistic relationships are appreciated as a critical factor in defining the dense ecosystem of the intestinal microbiota 1, 2. Pathogen exclusion through competition with the microbiota is a long understood mechanism of host protection, indicating that individual susceptibility to disease may in part be underpinned by these relationships 3, 4, 5, 6, 7, 8, 9. Enterotoxigenic Bacteroides fragilis (ETBF) cause acute diarrhea and are associated with active inflammatory bowel disease (IBD), late‐stage colon cancer, and sepsis through production of B. fragilis toxin (BFT) 10, 11, 12, 13, 14, 15, 16. Conversely, non‐toxigenic B. fragilis (NTBF) strains are symbiotic, protecting their host against inflammatory disease 17. Longitudinal human studies show stable predominance by either ETBF or NTBF in the B. fragilis population of an individual microbiota 18, suggesting a competitive interplay between these strains 7, 19. However, the determinants of this competition and susceptibility to ETBF colonization remain unknown, representing a unique model for the study of microbiota–pathogen interactions.
One mechanism of interbacterial competition is type VI secretion (T6S), whereby an attacking cell injects effector proteins through the membrane of a target organism 20, 21. Effector‐neutralizing immunity proteins encoded in the genome of the attacking strain prevent self‐intoxication 22, 23, 24. Differential encoding of effector–immunity pairs has been demonstrated to contribute to in vitro strain competition in Vibrio cholerae 25. Broad conservation of type VI secretion system (T6SS) loci was identified in the Bacteroidetes phylum, including B. fragilis, allowing for killing of the closely related B. thetaiotaomicron in vitro 3, 4, 5, 6, 7, 8, 9, 26, 27. Recent studies identified B. fragilis strain competition mediated by T6S both in vitro and in vivo 28, 29. As the Bacteroidetes comprise up to 50% of the human microbiota, T6S may play a key role in determining its composition. The complex biogeography of the intestinal ecosystem necessitates examination of the functional effects of putative competitive factors on the host 10, 11, 12, 13, 14, 15, 26, 30. The distinct biological properties of non‐toxigenic and toxigenic B. fragilis enable an examination of symbiont–pathogen competitive colonization in microbiota composition and disease susceptibility.
Results and Discussion
Strain competition reduces ETBF colonization through T6S
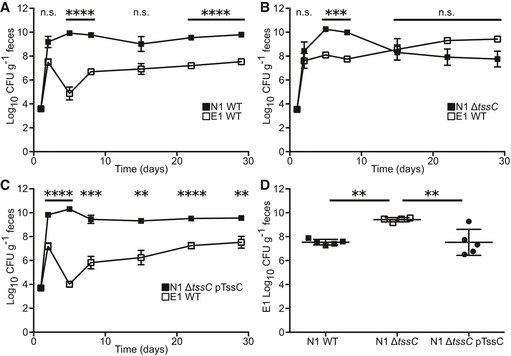
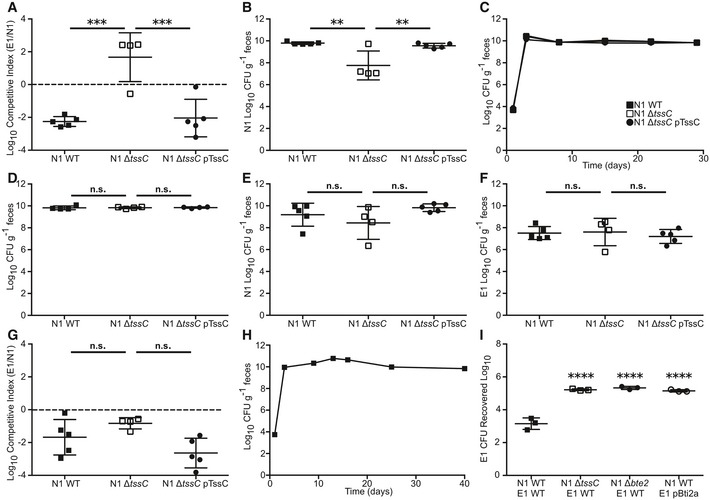
To understand competitive dynamics within the B. fragilis species, we utilized a co‐colonization system in specific pathogen‐free (SPF) C57BL/6J mice. Following orogastric delivery of B. fragilis, colonization by non‐toxigenic and enterotoxigenic strains of interest (Appendix Table S1) was monitored over time by fecal colony‐forming unit (CFU) recovery on selective media, utilizing plasmid‐encoded antibiotic resistance markers to distinguish strains 17, 31. Co‐colonization of mice with NTBF strain NCTC 9343 (N1) and ETBF strain ATCC 43858 (E1) resulted in a ~100 fold higher N1 colonization density relative to E1 over a 4‐week time period (Fig 1A). To examine the role of T6S in B. fragilis competition, we generated an N1 mutant harboring a genomic deletion of the tssC locus (N1 ΔtssC) that encodes an essential machinery component of the T6SS 7, 19, 26. Co‐colonization of N1 ΔtssC with E1 caused a loss of E1 repression (Figs 1B and EV1A) that was regained by plasmid‐based tssC complementation (N1 ΔtssC pTssC, Fig 1C). Analysis of bacterial recovery 4 weeks post co‐colonization demonstrated an increased E1 bacterial load achieved with loss of N1 T6SS function (Fig 1D), concomitant with a decrement in the colonization density achieved by N1 ΔtssC (Fig EV1B). Deletion of tssC did not affect N1 mono‐colonization (Fig EV1C and D) or bacterial recovery of N1 or E1 (Fig EV1E–G) 1 day following co‐colonization. As E1 mono‐colonization yielded 1010 CFU/g recovery in the feces (Fig EV1H), competition with N1 effectively reduced host exposure to toxin‐producing B. fragilis. In vitro plate competition assays revealed T6S‐dependent killing of E1 by N1, confirming a direct interaction between these strains (Fig EV1I).
Figure 1. NTBF strain dominance of ETBF through T6S.
-
A–CSPF C57BL/6J mice were co‐colonized with E1 and N1 wild type (WT, A, n = 5 mice), N1 T6SS mutant (ΔtssC, B, n = 4), or N1 complemented (ΔtssC pTssC, C, n = 5). Fecal CFU was quantified for E1 (open squares) and N1 (closed squares) weekly.
-
DFour weeks post‐colonization, E1 fecal recovery was compared between the N1 WT, ΔtssC, and ΔtssC pTssC groups.
Figure EV1. The N1 T6SS is required for strain dominance of E1 both in vivo and in vitro .
-
A, BSPF mice were co‐colonization with E1 WT and N1 WT (n = 5), T6SS mutant (ΔtssC, n = 4), or complemented (ΔtssC pTssC, n = 5). Fecal CFU was monitored for 4 weeks post‐colonization. N1 clone fecal CFU was compared between groups at the 4‐week time point (A) and the competitive index of E1 over N1 was determined for each mouse (B).
-
C, DMice (n = 4) were mono‐colonized with N1 WT, T6SS mutant (ΔtssC), or complemented (ΔtssC pTssC), and fecal CFU was determined for 4 weeks (C). Comparison of fecal CFU was made between groups after 4 weeks (D).
-
E–GSPF mice were co‐colonized with E1 and N1 WT (n = 5), T6SS mutant (ΔtssC, n = 4), or complemented (ΔtssC pTssC, n = 5). Fecal CFU at 1 day post co‐colonization was determined for N1 (E) and E1 (F) and competitive index of E1 over N1 was calculated for each mouse (G).
-
HSPF mice (n = 4) were mono‐colonized with E1 and fecal CFU determined over time.
-
IIn vitro competitions were performed between E1 WT and N1 WT, N1 ΔtssC, or N1 Δbte2, or between E1 Bti2a and N1 WT (n = 3 competitions). Recovered CFU of E1 was quantified after each competition, and statistical difference from E1 WT recovered after competition with N1 WT was determined.
A differentially encoded effector–immunity pair mediates T6S‐dependent strain competition
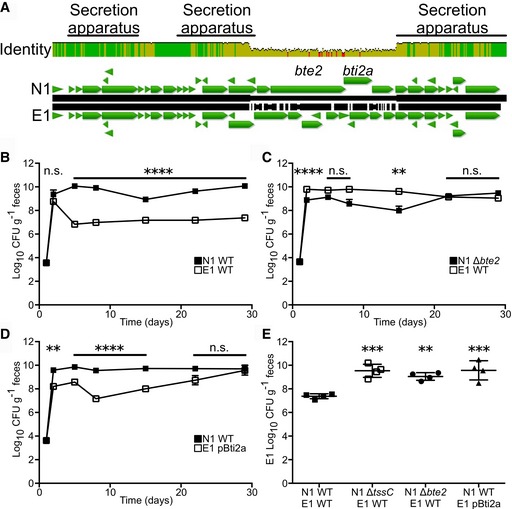
Alignment of the N1 and E1 T6SS loci revealed a non‐conserved region encoding a set of proteins that lack homology to documented T6SS effector or immunity domains (Fig 2A). We predicted that these proteins might determine intraspecific competition. Mass spectrometry analysis of the N1 secretome revealed decreased secretion of proteins encoded within the T6SS locus upon mutation of tssC (Table EV1), including T6S structural components (e.g., Hcp homologs and VgrG). BF9343_1928 demonstrated the greatest fold‐change in the secretome study, leading us to hypothesize that this protein is a putative effector and that BF9343_1927, encoded immediately downstream, is its cognate immunity protein (Fig 2A). Congruent with our studies, BF9343_1928 was demonstrated as a T6S effector, denoted as Bte2 (B. fragilis T6S effector 2) and BF9343_1927 as a cognate immunity protein named Bti2a (B. fragilis T6S immunity 2a) 28. In‐frame deletion of bte2 in N1 (N1 Δbte2) phenocopied the ΔtssC mutant during co‐colonization with E1, as N1 Δbte2 no longer demonstrated a competitive advantage against E1, permitting enhanced E1 colonization (Fig 2B, C and E). Heterologous expression of Bti2a in E1 (E1 pBti2a) conferred full restoration of E1 fecal CFU 4 weeks post co‐colonization with N1 WT (Fig 2D and E). These results were confirmed in vitro, where N1 Δbte2 exhibits reduced killing capacity against E1, and E1 pBti2a is protected from N1 WT (Fig EV1I). These data demonstrate the importance of a differentially encoded effector–immunity locus in modulation of the colonic microbiota composition, resulting in altered colonization by toxigenic B. fragilis.
Figure 2. An effector–immunity pair is required for E1 colonization resistance.
-
ANucleotide alignment of the T6SS locus from N1 and E1. Percent identity is indicated as height, green representing high homology with red highlighting non‐conserved regions.
-
B–ECo‐colonization of N1 WT (B and D, n = 4 mice) or N1 Δbte2 (C, n = 4) with E1 WT (B and C) or E1 overexpressing Bti2a (E1 pBti2a, D). Fecal CFU was monitored over time (B–D) and E1 CFU compared to N1 WT‐E1 WT group at 4 weeks post co‐colonization (E).
ETBF colonization resistance is strain‐ and order‐dependent
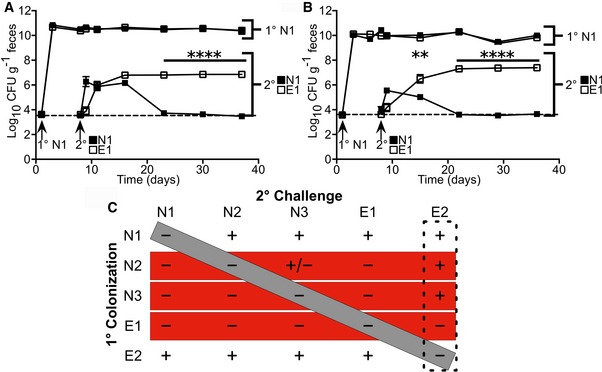
Colonization of gnotobiotic mice with N1 saturates the B. fragilis intestinal niche and prevents secondary challenge by the same strain 18, 31. To determine whether colonic establishment of N1 provides colonization resistance against E1, we examined the N1–E1 interaction in sequential colonization of gnotobiotic mice, monitoring fecal CFU of each strain through differential encoding of plasmid‐borne antibiotic resistance markers. Primary colonization with N1 restricted secondary challenge of N1, while E1 challenge produced stable colonization, suggesting strain‐specific colonization resistance within the B. fragilis species (Fig 3A). Results in SPF mice phenocopied the gnotobiotic competition (Fig 3B); we therefore utilized the SPF model to evaluate in vivo strain interactions for all subsequent studies. A broader pairwise analysis of five B. fragilis strains, three NTBF and two ETBF (N1, N2, N3, E1, and E2; Appendix Table S1), was performed to examine B. fragilis competition behavior. While each strain exhibited similar primary colonization (Fig EV2), we observed a distinct pattern of intraspecific niche competition between strains (Figs 3C and EV2), confirmed by PCR‐based genomic analysis of the colonizing strains (Appendix Fig S1). Intraspecific niche competition is characterized by full restriction of colonization by self‐secondary challenge (Fig 3C, gray box) and strain‐specific colonization resistance wherein some strains (N2, N3, and E1) exhibit a dominant exclusion phenotype (Fig 3C, red boxes). Our data show a strong priority effect of B. fragilis intestinal niche establishment, which can be overcome when challenged by E2 (Fig 3C, dashed box). This suggests that modular, genetically encoded factors and environmentally driven gene regulation mediate complex strain–strain interactions. In this context, host protection against ETBF colonization is dependent upon strain of initial exposure.
Figure 3. B. fragilis provides strain‐specific colonization resistance.
-
A, BInitial colonization of gnotobiotic (A) or SPF (B) mice (n = 4 mice per group) with N1 followed by secondary challenge with N1 (closed squares) or E1 (open squares). Fecal CFU was determined for the primary and secondary colonization strains through 4 weeks post‐secondary challenges.
-
CAll primary colonization and secondary challenge pairs were tested with 3 NTBF and 2 ETBF strains. Stable colonization of the secondary challenge strain significantly above the limit of detection is denoted as a “+” while non‐significance is denoted as a “−” (n = 4 mice per group). The diagonal gray bar indicates self‐secondary challenge, the horizontal red bars show strains that provide broad colonization resistance against non‐self strains, and the vertical dashed box indicates a strain that has an enhanced secondary colonization phenotype.
Figure EV2. Successful B. fragilis secondary challenge is strain‐dependent.

-
A–JMice (n = 4 per group) were initially colonized with N1 (A and B), N2 (C and D), N3 (E and F), E1 (G and H), or E2 (I and J) followed by secondary challenge by all strains or a mock inoculum at 1 week post‐primary colonization. Fecal CFU of primary and secondary strains were monitored for 4 weeks post‐secondary challenge (A, C, E, G, and I). At the last time point, the secondary challenge strain was tested for statistical significance above the mock‐inoculated group (B, D, F, H, and J).
T6S provides colonization resistance against challenge strains
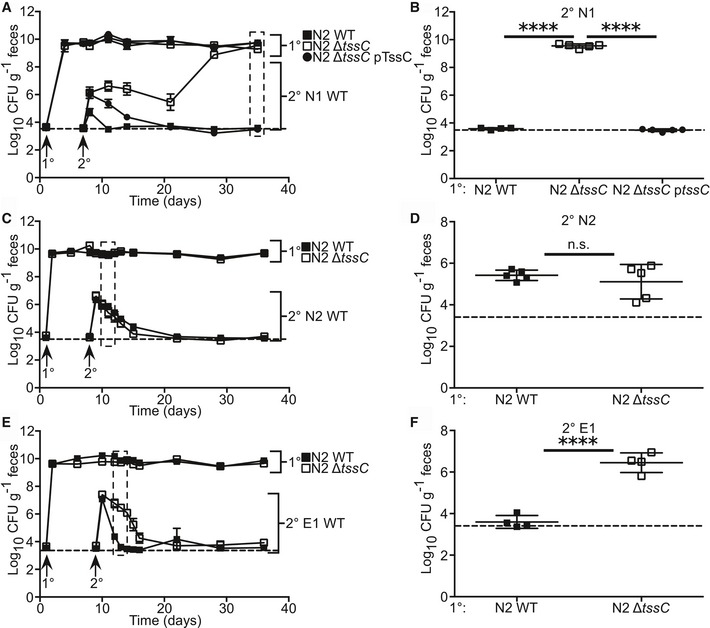
T6SSs have been implicated in colonization resistance against pathogen invasion 20, 21, 32; however, in vivo molecular evidence for this is lacking. The role of T6S observed in our co‐colonization study suggested that this system might govern intraspecific competition in secondary challenge. To examine this hypothesis, we generated a tssC deletion mutant in N2 (N2 ΔtssC), a strain that demonstrates broad colonization resistance (Fig 3C). Deletion of tssC relieved N2 colonization resistance against N1, which was restored upon plasmid‐based complementation (Fig 4A and B). Loss of tssC did not alter N2 primary colonization (Fig 4 and Appendix Fig S2A, C and E), or self‐secondary exclusion of N2 (Fig 4C and D). While N2 ΔtssC retained colonization resistance against E1, the rate of elimination was significantly reduced compared to wild‐type N2 (Fig 4E and F). Secondary strain recovery one day post‐challenge was not significantly different between groups, emphasizing the importance of the colonic environment in mediating competition (Appendix Fig S2B, D and F). These data show that T6S is important for non‐self‐colonization resistance in vivo and is a key contributor to strain stability in the microbiota 22, 23, 24, 25.
Figure 4. T6S is required for strain‐specific colonization resistance.
-
A–FPrimary colonization of SPF mice with N2 WT, T6SS mutant (ΔtssC), and complemented (ΔtssC pTssC) followed by secondary challenge with N1 WT (A and B, n = 5 mice), N2 WT (C and D, n = 5), or E1 WT (E and F, n = 4) was performed. Fecal CFU for primary and secondary strains was determined for 4 weeks post‐secondary challenge (A, C, E). Selected time points were tested for statistical difference of secondary challenge between groups. This includes 4 weeks post‐secondary challenge (B) and 3 days post‐challenge (D and F).
It is clear from these findings that T6S alone cannot explain the complex strain–strain interactions observed (Fig 3C). To date, one other antibacterial factor has been identified in B. fragilis. Bacteroidales secreted antimicrobial protein 1 (BSAP‐1) is a membrane attack complex/perforin (MACPF)‐containing protein, produced by N2 that displays N1 killing properties in vitro 1, 25. Mutation of bsap‐1 in N2 (N2 Δbsap‐1) had no effect on N2 colonization resistance against N1 in vivo (Appendix Fig S3), demonstrating the importance of the in vivo niche in defining factors that mediate intraspecific colonization resistance.
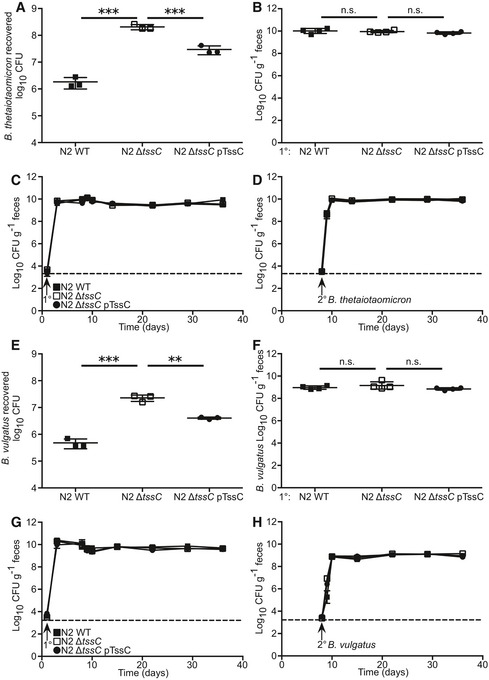
The commensal colonization factor (ccf) locus of B. fragilis enables niche occupancy within the colonic crypt and is required by N1 for self‐colonization resistance 31. Diverged ccf loci of B. thetaiotaomicron and B. vulgatus, two species closely related to B. fragilis, are suggested to define separate niches for those organisms, supported by the observation that N1 does not exhibit colonization resistance against either species 31. It is unknown whether these niches are spatially distinct from the B. fragilis niche or whether these Bacteroides species interact in the colon. N1 kills B. thetaiotaomicron through T6S in vitro 26, which we confirmed for N2 (Fig EV3A). N2, however, did not confer resistance against secondary challenge by B. thetaiotaomicron in vivo (Fig EV3B), indicating the species specificity of colonization resistance. Mutation of the T6SS of N2 had no effect on fecal recovery of B. thetaiotaomicron after secondary challenge (Fig EV3B–D). Similarly, despite T6S‐dependent killing of B. vulgatus in vitro (Fig EV3E), N2 did not restrict B. vulgatus in secondary challenge (Fig EV3F–H). As T6S is contact‐dependent, these data suggest a physical niche separation between these Bacteroides species and implies that intraspecies competition is a primary function of Bacteroides T6S in vivo.
Figure EV3. T6SS‐dependent colonization resistance does not extend to related Bacteroides species in vivo .
-
AB. thetaiotaomicron recovered after in vitro competition (n = 3 competitions) with N2 WT, N2 ΔtssC, or N2 ΔtssC pTssC.
-
B–DSPF mice (n = 4) were sequentially colonized with N2 WT, N2 ΔtssC, or N2 ΔtssC pTssC strains, followed by secondary challenge of B. thetaiotaomicron 1 week after primary colonization. Four weeks post‐secondary challenge, fecal CFU was determined for B. thetaiotaomicron (B). Fecal CFU for primary (C) and secondary strains (D) were determined for 4 weeks post‐secondary challenge.
-
EB. vulgatus recovered after in vitro competition with N2 WT, N2 ΔtssC, or N2 ΔtssC pTssC.
-
F–HSPF mice (n = 4) were sequentially colonized with N2 WT, N2 ΔtssC, or N2 ΔtssC pTssC followed by secondary challenge with B. vulgatus 1 week after primary colonization. Four weeks post‐secondary challenge, fecal CFU was determined for B. vulgatus (F). Fecal CFU for primary (G) and secondary strains (H) were determined for 4 weeks post‐secondary challenge.
NTBF protects the host from ETBF‐induced colitis via colonization resistance
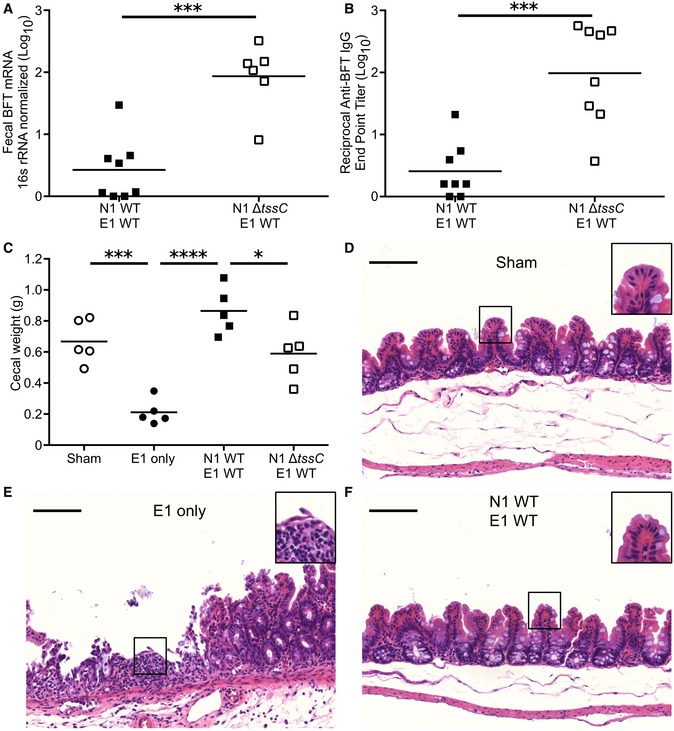
Enterotoxigenic Bacteroides fragilis colonization is associated with IBD and colitis in humans, experimentally validated in mouse model systems 15, 33, 34. We hypothesized that strain competition may favorably alter the health of the host through reduced exposure to toxigenic organisms. Co‐colonization of E1 with WT N1 reduced BFT transcript present in the feces by approximately 100‐fold relative to competition with N1 ΔtssC, congruent with the difference in E1 fecal CFU (Fig 5A; compare to Fig 1A, B and D). A concomitant decrease in mouse anti‐BFT serum IgG was observed, reminiscent of observations in ETBF‐exposed humans (Fig 5B) 34.
Figure 5. The N1 T6SS protects against ETBF‐induced disease.
-
AMice were co‐colonized with E1 and either N1 WT (n = 4) or N1 ΔtssC (n = 3). Five days post‐inoculation, fecal RNA was extracted and tested for BFT expression via qRT–PCR.
-
BFour weeks after co‐colonization with E1 and either N1 WT or N1 ΔtssC (n = 4 mice per group), the sera were collected, tested via ELISA for anti‐BFT IgG, and endpoint titer calculated.
-
C–FMice pre‐treated with DSS were inoculated with no organisms (sham), E1 only, or E1 competed with N1 WT or N1 ΔtssC. Five days post‐inoculation, the ceca were weighed (C) and fixed for histopathological examination after sham (D), E1 only (E) and E1‐N1 WT (F) colonizations. Scale bars denote 100 μm (main image) and 200 μm (inset).
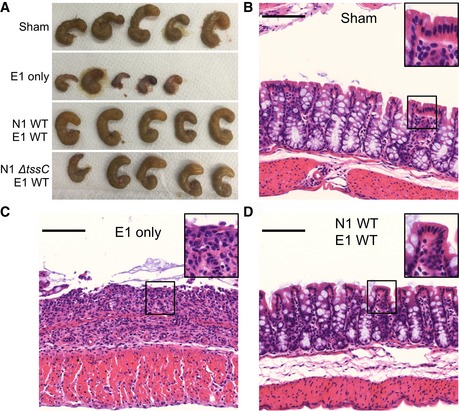
Infection of mice with ETBF exacerbates a BFT‐dependent, IBD‐like colitis induced by dextran sodium sulfate (DSS) administration 15. Colonization with E1 in this model causes significant intestinal injury, indicated by the presence of visible blood in the ceca, substantial tissue contraction, and reduced cecal weight relative to sham‐inoculated animals (Figs 5C and EV4A). We hypothesized that N1 competition would reduce the disease burden in this model, consistent with suppression of the E1 burden by WT N1 (Fig 1A). Indeed, co‐colonized mice did not exhibit evidence of cecal injury (Figs 5C and EV4A). Competition with N1 ΔtssC also reduced inflammation associated with E1 colonization, but not as effectively as N1 WT co‐colonization, indicating that T6S is required for full protection (Fig 5C). Examination of both cecal and colonic histopathology revealed severe ulcerations in mice mono‐colonized with E1, demonstrated by loss of crypts, epithelial denudation, and the presence of inflammatory cell infiltration (Figs 5D–F and EV4B–D). Competition of E1 with N1 WT provided complete protection from damage throughout the length of the cecum and colon. These data demonstrate that the N1 T6SS affords the host significant protection from E1 colonization and BFT‐induced injury.
Figure EV4. N1 protects from ETBF‐mediated intestinal damage via competition with E1 in DSS‐treated mice.
-
A–DMice pre‐treated with DSS were inoculated with no organisms (sham), E1 only, E1 with N1 WT, or E1 with N1 ΔtssC. Gross examination of ceca (A, n = 5 per group) and histopathological examination of colonic tissue (B–D, n = 5 per group) were performed after intestinal dissection. Scale bars (B–D) denote 100 μm (main image) and 200 μm (inset). Results are representative of three independent experiments.
Our data illustrate the importance of bacterial antagonistic factors in the composition and stability of the microbiota, providing a direct demonstration of T6S‐mediated competition in the intestine. In the context of both co‐colonization and colonization resistance, T6S is a mechanism of strain dominance. The Bacteroidetes are a resilient phylum within the human microbiota 35. Broad conservation of T6SSs within this phylum suggests that specific effector–immunity proteins are critical mediators of in vivo competition 26, 27. The uneven distribution of T6S within particular species (i.e., present in the majority of B. fragilis but absent in B. thetaiotaomicron 27) highlights the importance of microbial lifecycle and ecosystem, and underscores the need to define the molecular mechanisms by which strain‐specific effector modules govern competition 25. While plate‐based studies have identified antagonistic factors in Bacteroidetes 1, 26, our observations reveal that the biological relevance of competitive factors is manifest in the context of the intestine. This native environment is essential to provide the appropriate regulatory cues, biogeography, niche, and colonization order.
Membership in a predominant phylum and limitation of the B. fragilis lifecycle to the intestine make this organism an ideal model for deciphering the molecular features of microbiota competition. Strain‐dependent virulence properties of B. fragilis associated with human disease further heighten the import of understanding competition dynamics within this species. Our findings illustrate the strong influence that competitive factors have on host exposure to toxigenic organisms, revealing a specific mechanism by which the microbiota provides protection from toxin‐induced colitis. While eradication of ETBF through antimicrobial therapy protects susceptible mice from colon tumorigenesis 36, utilizing NTBF as a probiotic strategy to reduce the ETBF load may prove similarly effective, without the unwanted consequences of antibiotic use. As we find that a single non‐conserved effector–immunity pair can determine the outcome of NTBF‐ETBF competition, analysis of these loci in the native microbiota of human populations may reveal strains that provide enhanced protection against ETBF. As the colonization phenotypes exhibited by NTBF and ETBF include both exclusion and durability in human studies 18, early acquisition and deliberate re‐colonization with genetically modified NTBF strains may afford protection against ETBF‐mediated disease in a variety of clinical settings. Moreover, these principles may apply to other pathogenic bacteria with non‐toxigenic strains, including Clostridium difficile and Escherichia coli, for which the determinants of competitive colonization remain mostly undiscovered 7, 19, 37. The observed strain specificity and dependence on the order of colonization provide a necessary framework to advance molecular probiotic targeting toward rational, therapeutic manipulation of the pathogenic microbiota.
Materials and Methods
Bacterial culture and manipulation
Bacterial strains, culture conditions, and antibiotics
Bacteroides strains used in these studies include B. thetaiotaomicron ATCC 29148 and B. vulgatus ATCC 8482. B. fragilis strains are noted in Table EV1. B. fragilis, B. thetaiotaomicron, and B. vulgatus were grown in brain–heart infusion (BHI) broth anaerobically at 37°C with a gas mix of 5% H2, 10% CO2, and 85% N2. BHI was supplemented with 0.0005% hemin and 0.5 μg/ml vitamin K1 for optimal growth (BHIS). E. coli S17‐1λpir was used for cloning of shuttle and suicide plasmids and conjugation into B. fragilis. E. coli strains were grown in LB aerobically at 37°C. Antibiotics used were as follows: ampicillin (100 μg/ml), kanamycin (50 μg/ml), gentamicin (200 μg/ml), clindamycin (5 μg/ml), tetracycline (2 μg/ml), chloramphenicol (10 μg/ml), and rifampicin (20 μg/ml).
Conjugations
A method modified from previous studies was used for conjugations 38: appropriate B. fragilis and E. coli strains were grown to mid‐log phase in BHIS anaerobically and LB aerobically, respectively. Equal volumes of these cultures were sedimented into a single tube, resuspended in BHI, pooled onto a BHIS plate, and grown aerobically at 37°C overnight. This mix was spread onto a selective BHIS plate with gentamicin and clindamycin and grown anaerobically at 37°C.
Plasmids
pRK231 is a conjugation helper vector, used to increase transfer from E. coli to B. fragilis. Allelic exchange mutagenesis was completed with the suicide vector pKNOCK. The shuttle vector pFD340 provided antibiotic resistance against clindamycin (all pFD340‐based vectors), tetracycline (pFD340‐Tet), and chloramphenicol (pFD340‐CAT), as in previous studies 31. The pFD340‐based vectors were used in the B. fragilis strains N1, N2, N3, and E1 along with B. thetaiotaomicron and B. vulgatus. As we could not recover successful E2 conjugates with the pFD340‐based vectors, we generated the shuttle vector pAH2. This plasmid was made via cloning of the pFD340 replicon into the pKNOCK NotI restriction enzyme site. The primers for this and all other cloning are found in Appendix Table S2. The chloramphenicol resistance cassette with associated promoter and ribosomal binding site, called IS4351‐CAT, was cloned from pFD340‐CAT into the KpnI restriction enzyme site of pAH2 to generate pAH2‐CAT. Inserts for all newly generated constructs were sequence verified.
Mutants, complementation, and heterologous expression
In‐frame deletions were generated through allelic exchange using a protocol modified from previous studies 39. To generate tssC mutants, 1 kb upstream and 1 kb downstream of tssC were amplified from strains of interest and fused via overlap PCR. This construct was cloned into pKNOCK and conjugated into strains N1 and N2. Single clones resistant to clindamycin, indicating genomic integration, were passaged (1:100) daily without antibiotics. After 5–10 passages, single clones were patched onto selective (clindamycin) and non‐selective plates. Sensitive colonies were PCR screened for loss of tssC. Mutations in bsap‐1 in N2 and bte2 in N1 were generated in the same manner.
Mutation of tssC was complemented on pFD340 and pFD340‐CAT for N2 and N1, respectively. This was fused downstream of the B. fragilis glyceraldehyde‐3‐phosphate dehydrogenase (GAPDH) promoter and RBS and cloned into the KpnI restriction enzyme site of the aforementioned vectors. The resulting vectors were named pTssC and pTssC‐CAT. Generation of pBti2a to overexpress the bti2a locus was accomplished via fusion to the GAPDH promoter and RBS and was cloned into the KpnI restriction enzyme site of pFD340‐Tet.
Secretome mass spectrometry: peptide preparation
The secretomes of N1 WT and N1 ΔtssC were analyzed by mass spectrometry as follows: Overnight cultures were grown in BHIS, pelleted and washed in minimal media followed by 1:50 dilution into minimal media for overnight growth. Supernatant was collected and TCA precipitated. After a 1‐h incubation on ice, the precipitated protein was spun and washed twice with cold acetone. The dried pellet was resuspended in 7.5 mM TCEP, 8 M urea, 100 mM NH4HCO3 solution, and incubated for 1 h. This was spun on a 3K MWCO, mixed with 8 M urea, 100 mM NH4HCO3, 50 mM iodoacetamide solution, and incubated in the dark for 1 h. A total of 500 mM DTT was added to inactivate the iodoacetamide and the filter washed four times with 50 mM NH4HCO3. The remaining solution was trypsin treated overnight, acidified to 1% TFA and dried.
Secretome mass spectrometry: mass spectrometry
Peptide (5 μl) was introduced to a hybrid quadrupole‐orbitrap mass spectrometer (Orbitrap Elite, Thermo Fisher, San Jose, CA) coupled with a nanoflow LC system (NanoAcquity; Waters Corporation, Milford, MA). A 100 μm i.d. × 20 mm pre‐column was in‐house packed with 200 Å, 5 μm C18AQ particles (Michrom BioResources Inc., Auburn, CA, USA). A 75 μm i.d. × 180 mm analytical column was pulled using a Sutter Instruments P‐2000 CO2 laser puller (Sutter Instrument Company, Novato, CA) and packed with 100 Å, 5 μm C18AQ particles. Mobile phase A was composed of 0.1% formic acid in water. Mobile phase B was 0.1% formic acid in acetonitrile. For each injection, an amount of 5 μl of sample was loaded on the pre‐column at 4 μl/min for 10 min, using loading buffer of 5% acetonitrile and 0.1% formic acid. Peptide separation was performed at 250 nl/min flow rate in a 95 min gradient, in which mobile phase B started at 5%, increased to 35% at 60 min, 80% at 65 min, followed by a 5‐min wash at 80% and a 25‐min re‐equilibration at 5%.
Mass spectrometry data were collected in positive ionization mode using a data‐dependent acquisition method with a full MS scan for m/z range 350–2,000 in orbitrap at 120 K resolution. Consecutive MS/MS scans selected top 15 abundant ions in ion trap by rapid scan mode with a dynamic exclusion of 30 s. Precursor ions selected from the MS scan were isolated with an isolation width of 2 m/z for collision‐induced dissociation (CID) energy, NCE, at 35.
Secretome mass spectrometry: data analysis
MS data were analyzed by MaxQuant (version 1.5.0.25, 40) using standard settings and a UniprotKB database of Bacteroides fragilis. Peptide‐spectrum matches (PSM) and protein identifications were filtered at a false discovery rate of 0.01. Label‐free quantification of MS/MS spectral counts were extracted and used for statistical analysis of differential expression using QSpec tool (version 1.2.2, 41). Results are averaged from three technical replicates. The raw data can be found via Peptide Atlas, Dataset Identifier: PASS00882.
Bioinformatic analysis
T6SS loci of N1 and E1 were aligned in Geneious version 6.0.5. The alignment was performed with Geneious alignment software (cost matrix: 65% similarity, gap open penalty: 12, gap extension penalty: 3) and visualized in Geneious. The N1 T6SS locus was extracted from publicly available genome assembly, and the E1 T6SS locus was sequenced (Accession #KX279877).
In vitro competition
N1 clones (WT, ΔtssC, and Δbte2), N2 clones (WT, ΔtssC, and ΔtssC pTssC), E1 clones (WT and pBti2a), B. thetaiotaomicron, and B. vulgatus inocula were prepared in a similar manner to co‐colonization, excepting the final resuspension in PBS in place of sodium bicarbonate. N2 WT and ΔtssC were marked with pFD340 and N2 ΔtssC pTssC with pTssC; N1 clones, B. thetaiotaomicron, and B. vulgatus were marked with pFD340‐CAT; E1 clones (WT and pBti2a) with pFD340‐Tet and pBti2a, respectively. 108 CFU of N1 or N2 was competed against 107 CFU of E1 clones, B. thetaiotaomicron or B. vulgatus in a 10 μl spot on a BHIS plate with gentamicin and clindamycin. After overnight competition, these spots were resuspended in 1 ml of PBS and serial 10‐fold dilutions plated on BHIS with gentamicin, clindamycin, and chloramphenicol to quantify N1 clones, B. thetaiotaomicron, or B. vulgatus recovery while E1 clones were detected on BHIS with gentamicin, clindamycin, and tetracycline. Recovered CFU was computed from the various competitions.
Mouse modeling
All animal studies were conducted in accord with ethical regulations under protocols approved by the University of Chicago Animal Care and Use Committee and Institutional Biosafety Committee. SPF C57BL/6 mice were bred in‐house from mice originally purchased from Jackson Laboratory or purchased from Jackson Laboratory and maintained under SPF conditions for use in experimentation at 4 weeks of age. Gnotobiotic C57BL/6J mice were also bred in‐house, maintained in germ‐free conditions and used at 6 weeks of age. All experiments in SPF mice were performed with males while the gnotobiotic experiment with females. Sample size estimates for animal experiments were based on prior animal modeling studies utilized within the laboratory for investigation of colonization. At the time of weaning, animals were randomly distributed for use in experimentation. There was no investigator blinding in animal experimentation, and no animals were excluded from analysis.
Mono‐colonization and co‐colonization
SPF mice were pre‐treated with 100 mg/l clindamycin in their drinking water for 1 day prior to and throughout the course of infection to ensure plasmid retention. To prepare inocula, overnight cultures of B. fragilis were subcultured at a 1:50 ratio into fresh BHIS and grown until they reached OD600 ≈ 0.5. Bacteria from 50 ml culture were sedimented and resuspended in 10 ml PBS. These suspensions were adjusted by the addition of PBS until a 1:5 dilution yielded an OD600 = 0.55. Bacteria from 9 ml of suspensions were sedimented and resuspended in 1.8 ml 0.1 N sodium bicarbonate to yield a concentration of 1010 CFU/ml. For mono‐colonization, mice were inoculated via oral gavage with 108 CFU of E1 or N1 clones. For co‐colonization, mice were co‐colonized with 108 CFU each of E1 and N1 via oral gavage. E1 was marked with pFD340‐Tet or pBti2a, N1 WT, ΔtssC, and Δbte2 with pFD340‐CAT and N1 ΔtssC pTssC with pTssC‐CAT. To analyze fecal CFU following oral inoculation, fecal pellets were collected from individual mice, weighed, and vortexed in 1 ml PBS to achieve homogenization. Serial 10‐fold dilutions were plated on BHIS agar containing gentamicin and clindamycin plus either tetracycline, to monitor E1 recovery, or chloramphenicol, to determine N1 clone recovery. CFU/g feces for each clone was calculated, log10 transformed, and plotted over time.
Sequential colonization
Similar to co‐colonization experiments, SPF and gnotobiotic mice were pre‐treated with 100 mg/l clindamycin in drinking water for 1 day prior to and throughout the course of colonization to ensure plasmid retention. Inocula were prepared as in co‐colonization. Sequential colonization was performed with a modified protocol from previous studies 31. Primary colonization was achieved with 108 CFU of B. fragilis strains (N1, N2 WT, N2 ΔtssC, N3, E1) containing pFD340, N2 ΔtssC pTssC containing pTssC, or E2 containing pAH2 via oral gavage. After colonization for 7–10 days, secondary challenge was performed via oral gavage with 108 CFU of B. fragilis strains (N1, N2, N3, E1), B. thetaiotaomicron, or B. vulgatus containing pFD340‐CAT or E2 containing pAH2‐CAT. Fecal pellets were handled as noted in co‐colonization. Inherent antibiotic resistance (Appendix Table S1) was used to determine primary colonization fecal CFU; homogenized fecal pellets were plated onto BHIS plus gentamicin and clindamycin only (N1, E1), with tetracycline (N3, E2) or with rifampicin (N2). Secondary challenge CFU was determined by plating onto BHIS with gentamicin, clindamycin, and chloramphenicol. CFU/g feces were determined as noted in co‐colonization. Limit of detection is dependent upon the weight of each fecal pellet, indicated based on average fecal pellet weight at ~103.5.
B. fragilis genotyping
The identity of each strain was determined via PCR with three primer sets (Appendix Table S2), which distinguish the five B. fragilis strains (Appendix Fig S1). PCR was performed on successful secondary challenge strains from single colonies of each mouse. The identity of the strains was confirmed by banding pattern.
Fecal quantitative reverse transcription PCR
To test the transcription levels of BFT in the feces, quantitative reverse transcription PCR (qRT–PCR) was used. Fresh fecal pellets were collected, and RNA was extracted with the ZR soil/fecal RNA microprep kit (Zymo Research). RNase‐free DNase (Fisher) was used to digest contaminating genomic DNA in the samples. First‐strand cDNA synthesis was accomplished with iScript cDNA synthesis kit (Bio‐Rad), and qPCR was performed with SYBR Green (Bio‐Rad) on a Bio‐Rad CFX96 machine. BFT transcript was quantified with BFT‐specific primers (Appendix Table S2) and normalized to B. fragilis 16S rRNA. Efficiency for each primer set was determined to calculate accurate fold differences, and melt curves were used to test the specificity of each reaction.
Serum ELISA
Four weeks post‐colonization, mice were euthanized and blood was obtained via cardiac puncture. Blood was spun in serum collection tubes and stored for ELISA testing at −20°C. Recombinant, purified BFT 16 was coated onto Maxisorp plates (Nunc) at a concentration of 2 μg per well overnight in bicarbonate buffer (0.1 M) at 4°C. The plate was washed with ELISA buffer and blocked for 1 h with 2% BSA in PBS. Serum samples were diluted initially 1:10 and serially 1:4 to generate a dilution curve in PBS. After blocking, the plate was incubated with serum samples for 1 h. After 3 washes with ELISA buffer, secondary HRP‐conjugated anti‐mouse IgG antibody (Southern Biotech) was applied (1:10,000) for 1 h. After washing thrice, the ELISA was developed for 10 min and absorbance recorded on a Tecan Infinite M200pro plate reader. Data were analyzed with GraphPad Prism software to determine the endpoint titer through sigmoidal curve fit, with a cutoff set to double the background reading (no serum).
DSS colitis
To test the impact of B. fragilis competition on the health of the mouse, we used dextran sodium sulfate (DSS) as an inducer of colitis susceptibility. Mice were pre‐treated with DSS (2%, Fisher) and clindamycin in the drinking water for 5 days pre‐colonization. Mice were then either sham‐infected, colonized with E1 alone, with a competition of E1 and N1 WT or with a competition of E1 and N1 ΔtssC. Four days post‐colonization, the mice were euthanized, the ceca dissected, visualized, and weighed and the colons dissected. The intestinal tissue was fixed in 10% formalin, formed into Swiss rolls (colon), paraffin embedded, sectioned (5 μm), and H&E stained.
Statistical analysis
Statistical analysis was performed using GraphPad Prism software. Pairwise comparisons were performed using the unpaired, parametric, two‐tailed Student's t‐test. Sets of three groups or more were tested via one‐way ANOVA, with Tukey's multiple comparisons test used to compare between groups. Bonferroni correction was applied to account for multiple time points in colonization experiments. Comparison of variances was performed in GraphPad Prism software utilizing the F‐test, providing documentation of similar variance between groups.
Author contributions
ALH and JBW designed and analyzed the experiments. BWC provided conceptual support. ALH performed the experiments. BWC and ZME assisted with experiments. YAG and DRG performed mass spectrometry and analysis. ALH and JBW wrote the manuscript.
Conflict of interest
The authors declare that they have no conflict of interest.
Supporting information
Appendix
Expanded View Figures PDF
Table EV1
Review Process File
Acknowledgements
This work was supported by the Department of Pediatrics at the University of Chicago and a Pilot and Feasibility Award from the Digestive Diseases Research Core Center at the University of Chicago (NIDDK P30DK42086). J.B.W. is a recipient of a Burroughs Wellcome Foundation Investigators in the Pathogenesis of Infectious Disease Fellowship. A.L.H. is a trainee of the National Institutes of Health Medical Scientist Training Program at the University of Chicago (GM007281). We thank Dr. David Hecht for his guidance on the establishment of a B. fragilis program and for B. fragilis strain 638R/TM4000, Dr. Tomomi Kuwahara for B. fragilis strain YCH46, Dr. Jeffrey Gordon for the pKNOCK vector and E. coli S17 strain, Dr. Cathryn Nagler for providing gnotobiotic mice, Drs. Wei Ping Teoh and Stefan Pukatzki for comments on the manuscript, Nathania Hau for illustration expertise, and Dr. Vivian Choi for discussions on niche establishment.
EMBO Reports (2016) 17: 1281–1291
See also: M Sassone‐Corsi & M Raffatellu (September 2016)
References
- 1. Chatzidaki‐Livanis M, Coyne MJ, Comstock LE (2014) An antimicrobial protein of the gut symbiont Bacteroides fragilis with a MACPF domain of host immune proteins. Mol Microbiol 94: 1361–1374 [DOI] [PMC free article] [PubMed] [Google Scholar]
- 2. Kommineni S, Bretl DJ, Lam V, Chakraborty R, Hayward M, Simpson P, Cao Y, Bousounis P, Kristich CJ, Salzman NH (2015) Bacteriocin production augments niche competition by enterococci in the mammalian gastrointestinal tract. Nature 526: 719–722 [DOI] [PMC free article] [PubMed] [Google Scholar]
- 3. Sassone‐Corsi M, Raffatellu M (2015) No vacancy: how beneficial microbes cooperate with immunity to provide colonization resistance to pathogens. J Immunol 194: 4081–4087 [DOI] [PMC free article] [PubMed] [Google Scholar]
- 4. Buffie CG, Pamer EG (2013) Microbiota‐mediated colonization resistance against intestinal pathogens. Nat Rev Immunol 13: 790–801 [DOI] [PMC free article] [PubMed] [Google Scholar]
- 5. Lawley TD, Walker AW (2012) Intestinal colonization resistance. Immunology 138: 1–11 [DOI] [PMC free article] [PubMed] [Google Scholar]
- 6. Sekirov I, Tam NM, Jogova M, Robertson ML, Li Y, Lupp C, Finlay BB (2008) Antibiotic‐induced perturbations of the intestinal microbiota alter host susceptibility to enteric infection. Infect Immun 76: 4726–4736 [DOI] [PMC free article] [PubMed] [Google Scholar]
- 7. Leatham MP, Banerjee S, Autieri SM, Mercado‐Lubo R, Conway T, Cohen PS (2009) Precolonized human commensal Escherichia coli strains serve as a barrier to E. coli O157:H7 growth in the streptomycin‐treated mouse intestine. Infect Immun 77: 2876–2886 [DOI] [PMC free article] [PubMed] [Google Scholar]
- 8. Corr SC, Li Y, Riedel CU, O'Toole PW, Hill C, Gahan CGM (2007) Bacteriocin production as a mechanism for the antiinfective activity of Lactobacillus salivarius UCC118. Proc Natl Acad Sci USA 104: 7617–7621 [DOI] [PMC free article] [PubMed] [Google Scholar]
- 9. Endt K, Stecher B, Chaffron S, Slack E, Tchitchek N, Benecke A, Van Maele L, Sirard J‐C, Mueller AJ, Heikenwalder M et al (2010) The microbiota mediates pathogen clearance from the gut lumen after non‐typhoidal Salmonella Diarrhea. PLoS Pathog 6: e1001097 [DOI] [PMC free article] [PubMed] [Google Scholar]
- 10. Prindiville TP, Sheikh RA, Cohen SH, Tang YJ, Cantrell MC, Silva J (2000) Bacteroides fragilis enterotoxin gene sequences in patients with inflammatory bowel disease. Emerging Infect Dis 6: 171–174 [DOI] [PMC free article] [PubMed] [Google Scholar]
- 11. Boleij A, Hechenbleikner EM, Goodwin AC, Badani R, Stein EM, Lazarev MG, Ellis B, Carroll KC, Albesiano E, Wick EC et al (2015) The Bacteroides fragilis toxin gene is prevalent in the colon mucosa of colorectal cancer patients. Clin Infect Dis 60: 208–215 [DOI] [PMC free article] [PubMed] [Google Scholar]
- 12. Wu S, Rhee KJ, Albesiano E, Rabizadeh S, Wu X, Yen HR, Huso DL, Brancati FL, Wick E, McAllister F et al (2009) A human colonic commensal promotes colon tumorigenesis via activation of T helper type 17 T cell responses. Nat Med 15: 1016–1022 [DOI] [PMC free article] [PubMed] [Google Scholar]
- 13. Kato N, Kato H, Watanabe K, Ueno K (1996) Association of enterotoxigenic Bacteroides fragilis with bacteremia. Clin Infect Dis 23(Suppl 1): S83–S86 [DOI] [PubMed] [Google Scholar]
- 14. Sears CL (2009) Enterotoxigenic Bacteroides fragilis: a rogue among symbiotes. Clin Microbiol Rev 22: 349–369 [DOI] [PMC free article] [PubMed] [Google Scholar]
- 15. Rhee KJ, Wu S, Wu X, Huso DL, Karim B, Franco AA, Rabizadeh S, Golub JE, Mathews LE, Shin J et al (2009) Induction of persistent colitis by a human commensal, enterotoxigenic Bacteroides fragilis, in wild‐type C57BL/6 mice. Infect Immun 77: 1708–1718 [DOI] [PMC free article] [PubMed] [Google Scholar]
- 16. Choi VM, Herrou J, Hecht AL, Teoh WP, Turner JR, Crosson S, Bubeck Wardenburg J (2016) Activation of Bacteroides fragilis toxin by a novel bacterial protease contributes to anaerobic sepsis in mice. Nat Med 22: 563–567 [DOI] [PMC free article] [PubMed] [Google Scholar]
- 17. Mazmanian SK, Round JL, Kasper DL (2008) A microbial symbiosis factor prevents intestinal inflammatory disease. Nature 453: 620–625 [DOI] [PubMed] [Google Scholar]
- 18. Zitomersky NL, Coyne MJ, Comstock LE (2011) Longitudinal analysis of the prevalence, maintenance, and IgA response to species of the order Bacteroidales in the human gut. Infect Immun 79: 2012–2020 [DOI] [PMC free article] [PubMed] [Google Scholar]
- 19. Nagaro KJ, Phillips ST, Cheknis AK, Sambol SP, Zukowski WE, Johnson S, Gerding DN (2013) Nontoxigenic Clostridium difficile protects hamsters against challenge with historic and epidemic strains of toxigenic BI/NAP1/027 C. difficile . Antimicrob Agents Chemother 57: 5266–5270 [DOI] [PMC free article] [PubMed] [Google Scholar]
- 20. Pukatzki S, Ma AT, Sturtevant D, Krastins B, Sarracino D, Nelson WC, Heidelberg JF, Mekalanos JJ (2006) Identification of a conserved bacterial protein secretion system in Vibrio cholerae using the Dictyostelium host model system. Proc Natl Acad Sci USA 103: 1528–1533 [DOI] [PMC free article] [PubMed] [Google Scholar]
- 21. MacIntyre DL, Miyata ST, Kitaoka M, Pukatzki S (2010) The Vibrio cholerae type VI secretion system displays antimicrobial properties. Proc Natl Acad Sci USA 107: 19520–19524 [DOI] [PMC free article] [PubMed] [Google Scholar]
- 22. Brooks TM, Unterweger D, Bachmann V, Kostiuk B, Pukatzki S (2013) Lytic activity of the Vibrio cholerae type VI secretion toxin VgrG‐3 is inhibited by the antitoxin TsaB. J Biol Chem 288: 7618–7625 [DOI] [PMC free article] [PubMed] [Google Scholar]
- 23. Dong TG, Ho BT, Yoder‐Himes DR, Mekalanos JJ (2013) Identification of T6SS‐dependent effector and immunity proteins by Tn‐seq in Vibrio cholerae . Proc Natl Acad Sci USA 110: 2623–2628 [DOI] [PMC free article] [PubMed] [Google Scholar]
- 24. Fu Y, Waldor MK, Mekalanos JJ (2013) Tn‐Seq analysis of Vibrio cholerae intestinal colonization reveals a role for T6SS‐mediated antibacterial activity in the host. Cell Host Microbe 14: 652–663 [DOI] [PMC free article] [PubMed] [Google Scholar]
- 25. Unterweger D, Miyata ST, Bachmann V, Brooks TM, Mullins T, Kostiuk B, Provenzano D, Pukatzki S (2014) The Vibrio cholerae type VI secretion system employs diverse effector modules for intraspecific competition. Nat Commun 5: 3549 [DOI] [PMC free article] [PubMed] [Google Scholar]
- 26. Russell AB, Wexler AG, Harding BN, Whitney JC, Bohn AJ, Goo YA, Tran BQ, Barry NA, Zheng H, Peterson SB et al (2014) A type VI secretion‐related pathway in Bacteroidetes mediates interbacterial antagonism. Cell Host Microbe 16: 227–236 [DOI] [PMC free article] [PubMed] [Google Scholar]
- 27. Coyne MJ, Roelofs KG, Comstock LE (2016) Type VI secretion systems of human gut Bacteroidales segregate into three genetic architectures, two of which are contained on mobile genetic elements. BMC Genom 17: 58 [DOI] [PMC free article] [PubMed] [Google Scholar]
- 28. Wexler AG, Bao Y, Whitney JC, Bobay L‐M, Xavier JB, Schofield WB, Barry NA, Russell AB, Tran BQ, Goo YA et al (2016) Human symbionts inject and neutralize antibacterial toxins to persist in the gut. Proc Natl Acad Sci USA 113: 3639–3644 [DOI] [PMC free article] [PubMed] [Google Scholar]
- 29. Chatzidaki‐Livanis M, Geva‐Zatorsky N, Comstock LE (2016) Bacteroides fragilis type VI secretion systems use novel effector and immunity proteins to antagonize human gut Bacteroidales species. Proc Natl Acad Sci USA 113: 3627–3632 [DOI] [PMC free article] [PubMed] [Google Scholar]
- 30. Donaldson GP, Lee SM, Mazmanian SK (2016) Gut biogeography of the bacterial microbiota. Nat Rev Microbiol 14: 20–32 [DOI] [PMC free article] [PubMed] [Google Scholar]
- 31. Lee SM, Donaldson GP, Mikulski Z, Boyajian S, Ley K, Mazmanian SK (2013) Bacterial colonization factors control specificity and stability of the gut microbiota. Nature 501: 426–429 [DOI] [PMC free article] [PubMed] [Google Scholar]
- 32. Russell AB, Peterson SB, Mougous JD (2014) Type VI secretion system effectors: poisons with a purpose. Nat Rev Microbiol 12: 137–148 [DOI] [PMC free article] [PubMed] [Google Scholar]
- 33. Rabizadeh S, Rhee KJ, Wu S, Huso D, Gan CM, Golub JE, Wu X, Zhang M, Sears CL (2007) Enterotoxigenic Bacteroides fragilis: a potential instigator of colitis. Inflamm Bowel Dis 13: 1475–1483 [DOI] [PMC free article] [PubMed] [Google Scholar]
- 34. Sears CL, Islam S, Saha A, Arjumand M, Alam NH, Faruque AS, Salam MA, Shin J, Hecht D, Weintraub A et al (2008) Association of enterotoxigenic Bacteroides fragilis infection with inflammatory diarrhea. Clin Infect Dis 47: 797–803 [DOI] [PMC free article] [PubMed] [Google Scholar]
- 35. Faith JJ, Guruge JL, Charbonneau M, Subramanian S, Seedorf H, Goodman AL, Clemente JC, Knight R, Heath AC, Leibel RL et al (2013) The long‐term stability of the human gut microbiota. Science 341: 1237439–1237439 [DOI] [PMC free article] [PubMed] [Google Scholar]
- 36. DeStefano Shields CE, Van Meerbeke SW, Housseau F, Wang H, Huso DL, Casero RA, O'Hagan HM, Sears CL (2016) Reduction of murine colon tumorigenesis driven by enterotoxigenic Bacteroides fragilis using cefoxitin treatment. J Infect Dis 214: 122–129 [DOI] [PMC free article] [PubMed] [Google Scholar]
- 37. Buffie CG, Bucci V, Stein RR, McKenney PT, Ling L, Gobourne A, No D, Liu H, Kinnebrew M, Viale A et al (2015) Precision microbiome reconstitution restores bile acid mediated resistance to Clostridium difficile . Nature 517: 205–208 [DOI] [PMC free article] [PubMed] [Google Scholar]
- 38. Comstock LE, Coyne MJ, Tzianabos AO, Pantosti A, Onderdonk AB, Kasper DL (1999) Analysis of a capsular polysaccharide biosynthesis locus of Bacteroides fragilis . Infect Immun 67: 3525–3532 [DOI] [PMC free article] [PubMed] [Google Scholar]
- 39. Koropatkin NM, Cameron EA, Martens EC (2012) How glycan metabolism shapes the human gut microbiota. Nat Rev Microbiol 10: 323–335 [DOI] [PMC free article] [PubMed] [Google Scholar]
- 40. Cox J, Mann M (2008) MaxQuant enables high peptide identification rates, individualized p.p.b.‐range mass accuracies and proteome‐wide protein quantification. Nat Biotechnol 26: 1367–1372 [DOI] [PubMed] [Google Scholar]
- 41. Choi H, Fermin D, Nesvizhskii AI (2008) Significance analysis of spectral count data in label‐free shotgun proteomics. Mol Cell Proteomics 7: 2373–2385 [DOI] [PMC free article] [PubMed] [Google Scholar]
Associated Data
This section collects any data citations, data availability statements, or supplementary materials included in this article.
Supplementary Materials
Appendix
Expanded View Figures PDF
Table EV1
Review Process File