

Abstract
Sterol regulatory element binding protein (SREBP) is a major transcriptional regulator of the enzymes underlying de novo lipid synthesis. However, little is known about the SREBP-mediated control of processes that indirectly support lipogenesis, for instance, by supplying reducing power in the form of NAPDH or directing carbon flux into lipid precursors. Here, we characterize isocitrate dehydrogenase 1 (IDH1) as a transcriptional target of SREBP across a spectrum of cancer cell lines and human cancers. IDH1 promotes the synthesis of lipids specifically from glutamine-derived carbons. Neomorphic mutations in IDH1 occur frequently in certain cancers, leading to the production of the oncometabolite 2-hydroxyglutarate (2-HG). We found that SREBP induces the expression of oncogenic IDH1 and influences 2-HG production from glucose. Treatment of cells with 25-hydroxycholesterol or statins, which respectively inhibit or activate SREBP, further supports SREBP-mediated regulation of IDH1 and, in cells with oncogenic IDH1, carbon flux into 2-HG.
INTRODUCTION
The sterol regulatory element (SRE) binding protein (SREBP) family of transcription factors is activated by sterol depletion, growth factor signaling pathways, and oncogenes to induce the expression of genes encoding the major enzymes of de novo lipid synthesis (1–5). In sterol-replete conditions, inactive SREBP is held in the endoplasmic reticulum (ER). Upon sterol depletion, SREBP traffics from the ER to the Golgi apparatus, where it is proteolytically processed, leading to the release of a mature, active SREBP transcription factor (6, 7). The mature SREBP then translocates to the nucleus and binds SRE-containing gene promoters to induce transcription. The three SREBP isoforms are produced from two different genes: SREBF1, which encodes SREBP1a and SREBP1c, and SREBF2, which encodes SREBP2. Although studies of isoform-specific functions of the SREBPs in the liver have pointed to a role for SREBP1c in fatty acid and triglyceride synthesis and SREBP2 in cholesterol synthesis (8), SREBP targets appear to be more redundantly regulated in other settings (see, for example, references 3 and 4).
The transcriptional activation of de novo lipid synthesis genes by SREBP is well studied, but less is known about the regulation of auxiliary genes that indirectly support lipogenesis by providing NADPH or directing carbon flux into lipids (8). Overexpression of mature, active SREBP in the liver of mice increases the transcription of genes encoding glucose-6-phosphate dehydrogenase, 6-phosphogluconate dehydrogenase, and malic enzyme 1, which are all major sources of NADPH production (9, 10). Similarly, mature SREBP increases the expression of acetyl coenzyme A (acetyl-CoA) synthetase (ACSS2) and ATP-citrate lyase (ACLY), as well as the mitochondrial citrate transporter (SLC25A1), which facilitate the flux of carbons into lipids from acetate and citrate, respectively (11–14). Isocitrate dehydrogenase 1 (IDH1) is another enzyme that can support lipogenesis either through NADPH production or, through reductive carboxylation, facilitating the flux of carbon to lipids (15–17). The IDH1 promoter has an identifiable consensus SRE, and a previous study using in vitro electrophoretic mobility shift and reporter assays found that SREBP could bind directly to this sequence (18). However, the extent to which SREBP regulates IDH1 gene expression and the downstream consequences were not determined.
IDH1 catalyzes the reversible NADPH-dependent decarboxylation of cytosolic isocitrate to α-ketoglutarate (α-KG or oxoglutarate). This reaction is also carried out by IDH2 and IDH3 in the mitochondrial matrix as part of the tricarboxylic acid (TCA) cycle. Unlike IDH3, IDH1 and IDH2 can catalyze the reductive carboxylation of α-KG to isocitrate (16, 17, 19, 20). By bypassing the oxidative TCA cycle, reductive carboxylation creates a more direct flux of glutamine-derived carbons to produce the cytosolic acetyl-CoA required for de novo lipogenesis. In addition, IDH1 and IDH2 are oncogenes that are frequently mutated in low grade gliomas and leukemias, respectively (21, 22). The oncogenic mutations primarily affect the same catalytic arginine residue in IDH1 (R132) and IDH2 (R172) and are neomorphic in nature. Oncogenic IDH1 and IDH2 lose the ability to produce isocitrate and convert α-KG to 2-hydroxyglutarate (2-HG), the levels of which are greatly elevated in the tumors and plasma of patients harboring these mutations (23, 24). 2-HG is an oncometabolite closely resembling α-KG and therefore inhibits α-KG-dependent enzymes, which promote tumor development through epigenetic changes influencing cellular differentiation (25–27). Here, we present evidence for the transcriptional activation of IDH1 by SREBP in both wild-type and mutant IDH1 cells and human cancers and report on the metabolic effects of this regulation.
MATERIALS AND METHODS
Cell culture.
Human cell lines derived from different cancer lineages (denoted) were obtained from the American Type Culture Collection (ATCC). 786-O (renal cell adenocarcinoma), A375 (melanoma), HepG2 (hepatocellular carcinoma), HT1080 (fibrosarcoma), PC3 (prostate adenocarcinoma), SKMEL28 (melanoma), SW1353 (chondrosarcoma), U2OS (osteosarcoma), and U87MG (glioblastoma) cells were cultured in Dulbecco modified Eagle medium (DMEM; CellGro), whereas HCT116 (colorectal carcinoma) and MDA-MB-468 (breast adenocarcinoma) cells were cultured in RPMI 1640, both supplemented with 10% fetal bovine serum (FBS), at 37°C and 5% CO2. The isogenic IDH1+/+ and IDH1R132C/+ HCT116 cell lines were obtained from Horizon Discovery (HD 104-021 and HD PAR-073). Lipid-deficient FBS was made by mixing FBS with 20 mg/ml fumed silica (S5130; Sigma) for 3 h before removing the silica by centrifugation at 1,717 × g for 15 min. The cells were cultured in 10% lipid-deficient FBS for the duration of each experiment, or starting 24 h after small interfering RNA (siRNA) transfection for knockdown experiments. All siRNA experiments used ON-TARGETplus SMARTpool siRNAs (30 nM; GE/Dharmacon) targeting human SREBF1 (L-006891-00), SREBF2 (L-009549-00), or IDH1 (L-008294-01) for reverse transfection into cells using Lipofectamine RNAiMAX (Invitrogen), according to the manufacturer's instructions. 25-Hydroxycholesterol (H1015), Atorvastatin (PZ0001), and Simvastatin (S6196) were purchased from Sigma.
Immunoblotting.
Cells were lysed in ice-cold NP-40 buffer (40 mM HEPES [pH 7.4], 400 mM NaCl, 1 mM EDTA [pH 8.0], 1% NP-40 [CA-630; Sigma], 5% glycerol, 10 mM pyrophosphate, 10 mM β-glycerophosphate, 50 mM NaF, 0.5 mM orthovanadate) containing protease inhibitor cocktail (P8340; Sigma) and 1 mM dithiothreitol. The following antibodies were used for detection of proteins transferred to nitrocellulose membranes after SDS-PAGE: actin (A5316; Sigma), FASN (3180; Cell Signaling Technologies [CST]), IDH1 (8137; CST), IDH2 (ab55271; Abcam), SCD (2438; CST), SREBP1 (sc-8984; Santa Cruz), and SREBP2 (557037; BD Biosciences). SREBP blots are of the full-length precursor (P), unless indicated otherwise as the mature active form (M).
mRNA expression analysis.
Complementary DNA was synthesized with the Superscript III first-strand synthesis system (Invitrogen) from RNA isolated using an RNeasy minikit (Qiagen). SYBR green (Applied Biosystems) was used for quantitative reverse transcription-PCR (qRT-PCR) using an Applied Biosystems 7300 real-time PCR system. Each sample was run in technical triplicates and normalized to RPLP0 expression. The following forward (F) and reverse (R) primer sequences were used: RPLP0 (F, 5′-CAGATTGGCTACCCAACTGTT-3′; R, 5′-GGGAAGGTGTAATCCGTCTCC-3′), FASN (F, 5′-AAGGACCTGTCTAGGTTTGATGC-3′; R, 5′-TGGCTTCATAGGTGACTTCCA-3′), IDH1 (F, 5′-ATAATGTTGGCGTCAAATGTGC-3′; R, 5′-CTTGAACTCCTCAACCCTCTTC-3′), IDH2 (F, 5′-CGCCACTATGCCGACAAAAG-3′; R, 5′-ACTGCCAGATAATACGGGTCA-3′), LDLR (F 5′-TCTGCAACATGGCTAGAGACT-3′; R, 5′-TCCAAGCATTCGTTGGTCCC-3′), SCD (F, 5′-CCCAGCTGTCAAAGAGAAGG-3′; R, 5′-CAAGAAAGTGGCAACGAACA-3′), SREBF1 (F, 5′-TGCATTTTCTGACACGCTTC-3′; R, 5′-CCAAGCTGTACAGGCTCTCC-3′), and SREBF2 (F, 5′-TG GCTTCTCTCCCTACTCCA-3′; R, 5′-GAGAGGCACAGGAAGGTGAG-3′).
De novo lipid synthesis.
Cells were cultured in low glucose (1 mM) DMEM containing 10% lipid-deficient FBS and glutamine (4 mM) with medium changes every 12 h for 48 h prior to the extraction of lipids with 2:1 chloroform-methanol using the Folch method, as described previously (3, 28). Cells were labeled for the final 4 h with 5 μCi/ml [1-14C]acetate (NEC084H001MC; Perkin-Elmer) or [U-14C]glucose (NEC042V250UC; Perkin-Elmer). Cells labeled with [U-14C]glutamine (NEC451050UC; Perkin-Elmer) were cultured similarly but in the absence of cold glutamine during the 4-h labeling. Under all three labeling conditions, the culture medium was changed to fresh radioisotope-containing media 4 h prior to lipid extraction. Extracted 14C-labeled lipids were quantified from biological duplicates using a LS6500 scintillation counter (Beckman Coulter) and normalized to protein concentration. Data shown are the composite of two independent experiments.
Analysis of TCGA data.
TCGA gene expression data from the breast carcinoma (n = 1,100), prostate adenocarcinoma (n = 498), colorectal adenocarcinoma (n = 382), hepatocellular carcinoma (n = 373), lung adenocarcinoma (n = 517), cutaneous melanoma (n = 471), and lower-grade glioma (n = 530) data sets were downloaded from cBioPortal (29–36). Mutation data from TCGA was used to identify samples in the lower grade glioma data set with oncogenic mutations in IDH1 (n = 221). The SREBP gene signature was calculated using a cumulative average gene expression of ACACA, FASN, HMGCR, HMGCS1, and LDLR. Samples that were greater than or less than one standard deviation from the mean were considered “high” or “low,” respectively. The average RNA expression for IDH1, SCD, or IDH2 was calculated for samples in each category.
13C tracer metabolomics.
Prior to incubation with 13C tracers, cells were cultured in 10-cm dishes for 48 h under the same conditions described for the de novo lipid synthesis assay. For [U-13C]glucose tracing experiments, cells were washed with PBS prior to incubation for 20 min or 24 h, as indicated, in medium containing 4 mM [U-13C]glucose (CLM-1396-1; Cambridge Isotope Laboratories). Intracellular metabolites were extracted with −80°C methanol (80%) as described previously (37, 38). Briefly, cells were harvested from culture dishes after incubation with 80% methanol on dry ice for 20 min. Three extractions were performed in ice-cold 80% methanol, and the supernatants were pooled after each centrifugation. For [U-13C]glutamine tracing experiments, cells were washed with PBS prior to incubation for 2 h (an incubation time found to maximize acetyl-CoA labeling in a pilot experiment [data not shown]) in DMEM containing 10% lipid-deficient FBS, 1 mM glucose, and 4 mM [U-13C]glutamine (CLM-1822-H; Cambridge Isotope Laboratories). Intracellular metabolites were extracted using a previously described method (39) that was modified for adherent mammalian cell culture. Plates of cells were washed briefly with ice-cold saline (0.9% NaCl in water) and extracted with 3.5 ml of ice-cold 10% trichloroacetic acid in water on ice. Cells were then scraped into Eppendorf tubes, vortexed for 30 s, and centrifuged at 20,000 × g for 10 min at 4°C. Solid-phase, reverse-phase extraction columns (3 ml) were conditioned with 2 ml of high-pressure liquid chromatography (HPLC)-grade methanol and equilibrated with 2 ml of HPLC-grade water at room temperature. Sample supernatants were passed over these prepared cartridges using gravity flow. After complete flowthrough of the samples, the cartridges were washed once with 1 ml of water and eluted with two sequential applications of 0.6 ml of methanol containing 0.2% ammonium acetate into 50-ml tubes on ice. Collected supernatants or eluates were dried at room temperature in 50-ml tubes under a steady stream of nitrogen gas (N-EVAP; Organomation Associates, Inc.).
For liquid chromatography-tandem mass spectrometry (LC-MS/MS) analyses, dried pellets were resuspended in 15 to 20 μl of water just prior to injection of 5 μl into a 5500 QTRAP hybrid triple-quadrupole mass spectrometer (AB/SCIEX), with selected reaction monitoring (SRM) and polarity switching between positive and negative modes, coupled to a Prominence UFLC HPLC system (Shimadzu) with Amide XBridge HILIC chromatography (Waters). The peak area from the total ion current for each metabolite SRM transition was integrated using MultiQuant v2.1 software (AB/SCIEX). SRMs were created to detect native metabolites or the incorporation of 13C from glucose into 2-HG, citrate, and isocitrate and the incorporation of 13C from glutamine into acetyl-CoA using targeted LC-MS/MS (2-HG [M+0]: Q1 = 147.1, Q3 = 128.7, collision energy = −17; 13C2-2-HG [M+2]: Q1 = 149.1, Q3 = 130.7, collision energy = −17; citrate [M+0]: Q1 = 191.05, Q3 = 87, collision energy = −20; 13C2-citrate [M+2]: Q1 = 193.05, Q3 = 89, collision energy = −20; isocitrate [M+0]: Q1 = 191.02, Q3 = 117, collision energy = −17; 13C2-isocitrate [M+2]: Q1 = 193.02, Q3 = 119, collision energy = −17; acetyl-CoA [M+0]: Q1 = 810, Q3 = 303, collision energy = +28; 13C2-acetyl-CoA [M+2]: Q1 = 812, Q3 = 305, collision energy = +28). The percent fractional abundance was calculated by dividing the peak area of the labeled M+2 form by the sum of all detectable and distinguishable labeled and unlabeled forms of that metabolite (2-HG: M+0, M+1, and M+2; citrate: M+0, M+1, M+2, M+3, M+4, and M+5; isocitrate: M+0, M+1, and M+2; acetyl-CoA: M+0 and M+2).
Statistical analysis.
All data were analyzed with GraphPad Prism and are shown as means ± the standard errors of the mean (SEM). P values for qRT-PCR were calculated by one-way analysis of variance with a Tukey HSD post hoc test. The significance for all other experiments was calculated by using an unpaired two-tailed Student t test. In both cases, significance was reached if P was <0.05. The number of independent experiments (n) is provided in each figure legend, and composite data from these experiments are graphically presented, unless otherwise noted.
RESULTS
IDH1 expression is regulated by SREBP.
To determine whether SREBP regulates IDH1, a panel of 10 cancer cell lines from distinct cancer lineages was cultured in lipid-deficient media to facilitate activation of SREBP, and the effects of siRNA-mediated depletion of SREBP1, SREBP2, or both on gene expression were measured. The transcripts for canonical SREBP targets, SCD and LDLR, were significantly decreased upon SREBP isoform depletion in the majority of cell lines, with the relative contributions from SREBP1 and -2 varying between cell lines and the most pronounced decreases arising from knockdown of both isoforms (Fig. 1A). As we have found in other cancer cells (3), SREBP2 depletion significantly decreases expression of SREBP1 in a subset of cell lines (Fig. 1A and 2), an observation consistent with the existence of SREs in the promoter of the SREBF1 gene and cross regulation between these transcription factors (40). SCD expression was significantly decreased by SREBP-depletion in 9 of the 10 cell lines, whereas LDLR expression was significantly decreased in only 6 of the 10 lines. Consistent with IDH1 being a shared target of SREBP1 and -2 in these settings, transcript levels of IDH1 were significantly decreased by the combined knockdown of SREBP isoforms in 7 of the 10 cell lines tested (Fig. 1B). However, IDH2 expression was not affected by SREBP depletion in any of these cell lines. Corresponding to these transcriptional changes were decreases in the protein level of IDH1 but not IDH2 following SREBP knockdown (Fig. 2). Compared to the SCD protein, which turns over rapidly, the effects of SREBP depletion on IDH1 protein levels were more modest but at least as pronounced as the canonical SREBP target fatty acid synthase (FASN), which is very stable (41). Consistently, the few cell lines that did not show effects of SREBP knockdown on IDH1 transcript levels (Fig. 1B) also did not show decreases in IDH1 protein (Fig. 2) (e.g., MDA-468 and A375).
FIG 1.

SREBP1/2 depletion decreases IDH1 transcript expression in a panel of cancer cell lines. RNA isolated from cell lines 48 h posttransfection with nontargeting siRNAs or siRNAs targeting SREBP1, SREBP2, or both was used for qRT-PCR. (A) Transcript levels for SCD, LDLR, SREBF1, and SREBF2 after SREBP1/2 knockdown. (B) Transcript levels for IDH1 and IDH2 after SREBP1/2 knockdown. Transcript data are shown as means ± the SEM relative to cells transfected with nontargeting siRNAs (−) (n = 2; *, P > 0.05).
FIG 2.
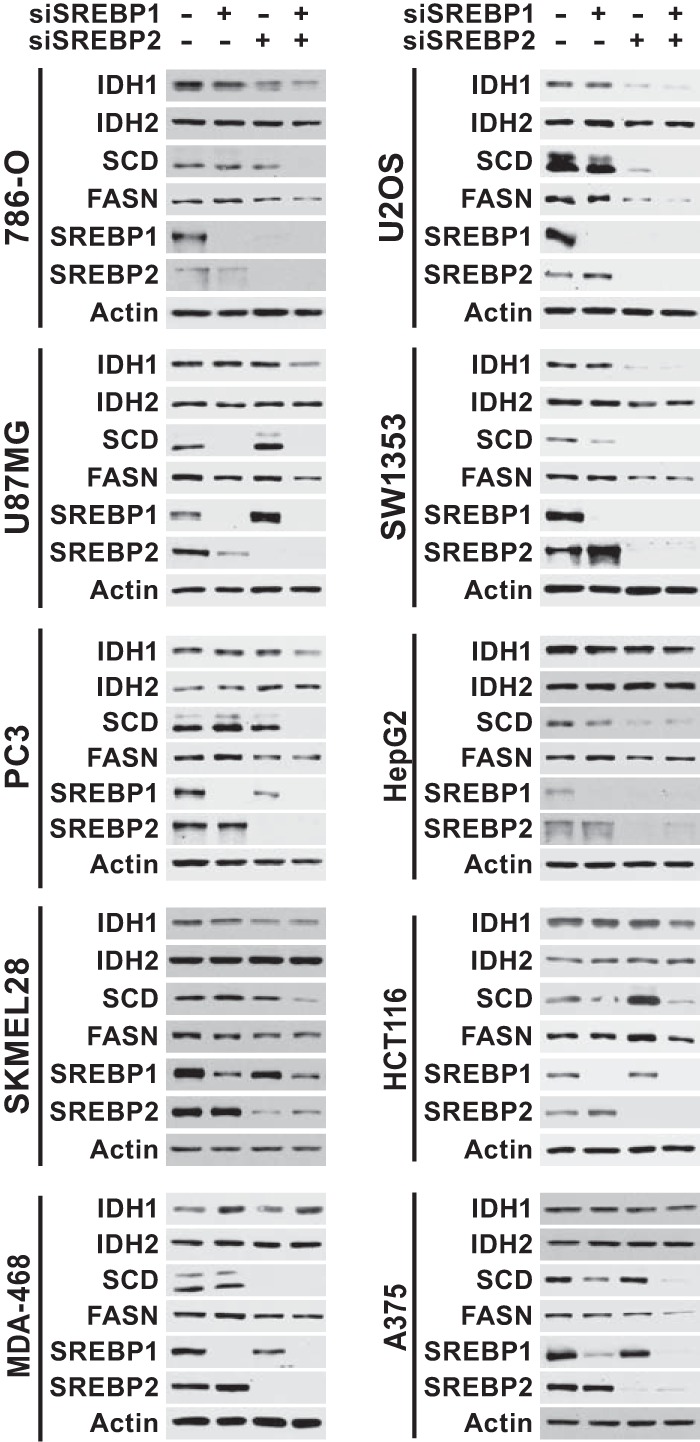
SREBP1/2 depletion decreases IDH1 protein expression in a panel of cancer cell lines. Immunoblots of lysates from cells 72 h posttransfection with siRNAs targeting SREBP1, SREBP2, or both are shown compared to control siRNAs (−) and are representative of at least two independent experiments for each cell line.
To assess whether IDH1 expression is associated with SREBP activation in human cancers, we analyzed publicly available gene expression data from six different cancer lineages (breast, prostate, colorectal, hepatocellular, lung, and melanoma) through The Cancer Genome Atlas (TCGA) (32–36). For these analyses, we used an SREBP gene signature based on five well-established SREBP1/2 gene targets (ACACA, FASN, HMGCR, HMGCS1, and LDLR). In five of the six cancer settings, tumors with high mRNA levels of canonical SREBP targets had significantly elevated expression of IDH1, as well as the established SREBP target SCD, relative to those with low expression of canonical SREBP targets (Fig. 3). However, IDH2 mRNA levels did not correlate with those of SREBP targets. These collective data are consistent with IDH1 being a transcriptional target of SREBP in the majority of cancer cell lines and human tumors.
FIG 3.
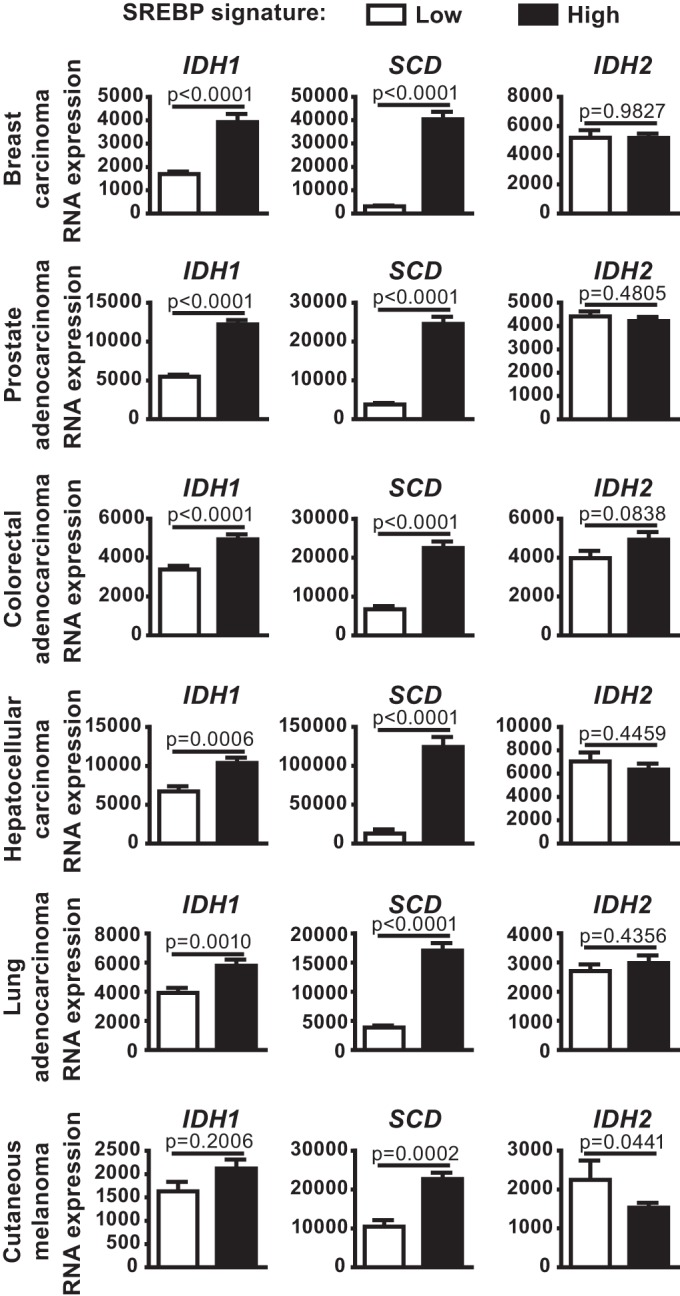
Expression of IDH1 in human cancers is associated with mRNA levels of canonical SREBP targets. IDH1, SCD, and IDH2 expression in tumors from TCGA data sets for each given cancer, comparing tumors with low and high expression of a defined set of established SREBP targets.
SREBP and IDH1 facilitate carbon flow from glutamine to lipids.
We hypothesized that IDH1, as a downstream target of SREBP, might contribute to de novo lipid synthesis from different carbon sources. Cells can produce the cytosolic acetyl-CoA required for lipid synthesis using carbons from exogenous glucose, glutamine, or acetate, among others (Fig. 4A). We compared the effects of siRNA-mediated depletion of SREBP1/2 or IDH1 on de novo lipogenesis from these carbon sources by labeling U87MG and U2OS cells with [14C]acetate, [14C]glucose, or [14C]glutamine. As expected, SREBP knockdown significantly decreased incorporation of 14C from all three carbon sources into lipids, with the most pronounced effects on acetate and glutamine labeling (Fig. 4B and C). However, IDH1 knockdown only decreased the incorporation of [14C]glutamine into lipids, without decreasing lipid synthesis from acetate or glucose. Interestingly, [14C]glucose-derived lipids were elevated by IDH1 depletion in the U87MG cells, suggesting possible compensation due to decreased flux from glutamine (Fig. 4B). Stable isotope tracing with [13C]glutamine further demonstrated a role for IDH1 in glutamine flux into acetyl-CoA (Fig. 4D), the essential precursor for de novo lipid synthesis. These data suggest that IDH1 is regulated by SREBP, at least in part, due to its role in facilitating carbon flux from glutamine into lipid.
FIG 4.
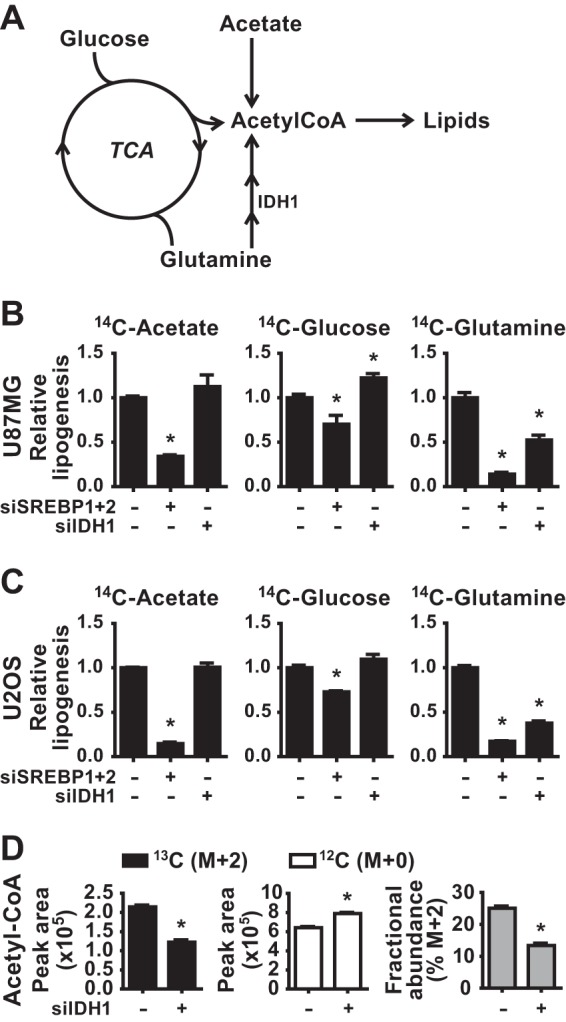
Effects of SREBP and IDH1 on de novo lipid synthesis from different carbon sources. (A) Diagram of the distinct paths of carbon from acetate, glucose, and glutamine to the acetyl-CoA required for lipid synthesis. (B and C) Incorporation of [1-14C]acetate, [U-14C]glucose, or [U-14C]glutamine into the lipid fraction was measured in U87MG (B) and U2OS (C) 72 h posttransfection with siRNAs targeting SREBP1 and -2 or IDH1. (D) Normalized peak areas of 13C-labeled (M+2) and unlabeled (M+0) acetyl-CoA and the fractional abundance of 13C-labeled acetyl-CoA M+2 measured by LC-MS/MS in metabolite extracts from U2OS cells 72 h posttransfection with nontargeting control siRNAs (−) or siRNAs targeting IDH1. Cells were labeled with [U-13C]glutamine for 2 h. Data are representative of two independent experiments. In panels B to D, the data are presented as means ± the SEM (n = 2; *, P < 0.05 relative to cells transfected with control siRNAs).
The SREBP-regulating compounds 25-hydroxycholesterol and statins exert reciprocal effects on IDH1 expression.
Since SREBP processing and activity are strongly affected by sterol abundance in cells, we tested the effects of exogenous cholesterol and inhibitors of cholesterol synthesis (i.e., statins) on IDH1 expression (Fig. 5A). 25-Hydroxycholesterol (25-HC) potently inhibits SREBP processing, while statins activate SREBP by reducing intracellular cholesterol through inhibition of 3-hydroxy-3-methylglutaryl (HMG)-CoA reductase (HMGCR), a key enzyme in the sterol synthesis pathway (42). Culturing three distinct cell lines (U87MG, U2OS, and HCT116) in the presence of 25-HC for 2 days suppressed the expression of the canonical SREBP targets SCD and LDLR (Fig. 5B), a finding consistent with the inhibition of SREBP processing (Fig. 5C). Importantly, 25-HC also suppressed the expression of IDH1 transcripts, without any effects on IDH2 expression (Fig. 5B). A time course study of 25-HC treatment demonstrated that protein levels of IDH1 but not IDH2 were substantially reduced by 2 to 3 days, similar to FASN in these cell lines (Fig. 5C). While the U87MG cells failed to respond to statins for effects on SREBP (data not shown), treatment of U2OS and HCT116 cells with either atorvastatin (Fig. 5D) or simvastatin (Fig. 5E) induced SREBP processing (Fig. 5F) and increased expression of SCD and LDLR. Likewise, IDH1 transcript levels were modestly increased by both statins (Fig. 5D and E). This effect was also reflected in increased IDH1 protein abundance starting 24 h after statin treatment (Fig. 5F), with atorvastatin more potently inducing increases in both IDH1 and SCD. As seen with 25-HC, neither IDH2 transcript nor protein levels were affected by statin treatment. These findings support the siRNA-depletion data above and further establish a role for SREBP in promoting IDH1 expression.
FIG 5.

Reciprocal regulation of SREBP processing by 25-hydroxycholesterol or statins respectively inhibits or activates IDH1 expression. (A) Diagram of the effects of cholesterol and statins on SREBP processing. (B) qRT-PCR analyses of RNA from the given cells treated with 25-HC (1 μg/ml) for 48 h. (C) Cells were treated for 0, 1, 2, or 3 days with 25-HC prior to lysis for immunoblot analysis. (D and E) Cells were treated with (D) atorvastatin (5 μM) or (E) simvastatin (5 μM) for 48 h prior to qRT-PCR analysis. (F) Cells were treated for 0, 1, or 2 days with atorvastatin or simvastatin prior to lysis for immunoblot analysis. (B, D, and E) All transcript levels are shown as means ± the SEM relative to untreated cells (n ≥ 2; *, P < 0.05). (C and F) Immunoblots shown are representative of at least two independent experiments. (P), precursor, full-length SREBP2; (M), mature, active SREBP2.
SREBP regulates oncogenic IDH1.
We next wanted to determine whether SREBP also influenced expression of the IDH1 oncogene. Given that IDH1 mutations occur in more than 70% of low-grade glioma, we analyzed publicly available data to determine whether IDH1 expression correlates with an SREBP activation gene signature in these tumors (31, 43). Consistent with data from other cancers (Fig. 3), low-grade glioma samples with high mRNA levels of canonical SREBP targets had significantly higher IDH1 and SCD expression relative to those with low expression of SREBP targets (Fig. 6A). Importantly, this association was also observed when analyzing only those low-grade glioma samples with known IDH1 mutations (Fig. 6B). In both analyses, IDH2 mRNA levels did not correlate with levels of SREBP targets. These data suggest that the activation state of SREBP might influence expression of the IDH1 oncogene.
FIG 6.
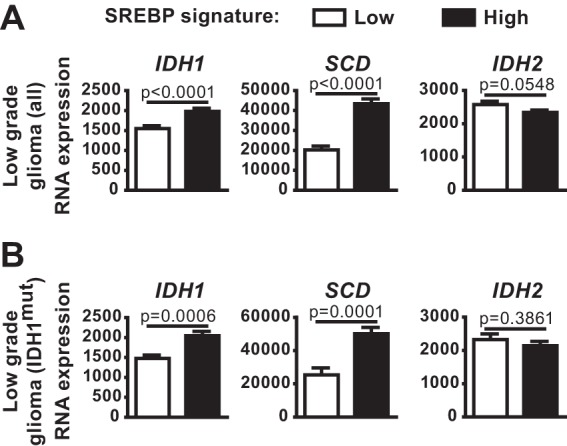
Expression of IDH1 in low-grade glioma is associated with mRNA levels of canonical SREBP targets. (A and B) IDH1, SCD, and IDH2 expression in tumors from either the entire lower-grade glioma TCGA data set (A) or the subset of these with oncogenic mutations in IDH1 (B), comparing tumors with low and high expression of a defined set of established SREBP targets.
Established glioma cell lines with IDH1 mutations are not readily available. Therefore, to address whether SREBP can influence the expression of oncogenic IDH1, we used both a fibrosarcoma-derived cell line with a naturally occurring IDH1R132C mutation (HT1080) and an engineered HCT116 line with a knockin of the same mutation. As observed in wild-type IDH1 cells, SREBP depletion decreased SCD and LDLR transcript levels, with the strongest effect resulting from the combined SREBP1/2 double knockdown (Fig. 7A). IDH1 transcript levels were also decreased by SREBP knockdown in these lines (Fig. 7B). Consistent with these mRNA changes, SREBP1/2 knockdown decreased IDH1 and SCD protein levels and, to a lesser extent, FASN levels (Fig. 7C). The effects of SREBP depletion on the protein levels of these SREBP targets were more modest in the engineered HCT116-IDH1R132C/+ line. IDH2 transcript and protein levels were unchanged in the HCT116-IDH1R132C/+ cells and were significantly increased, rather than decreased, by SREBP1 knockdown in the HT1080 cells (Fig. 7B and C).
FIG 7.

SREBP regulates IDH1 expression in IDH1R132C mutant cells. (A and B) qRT-PCR analysis of RNA isolated from the given cells 48 h posttransfection with nontargeting siRNAs or siRNAs targeting both SREBP1 and SREBP2. (A) Transcript levels for SCD, LDLR, SREBF1, and SREBF2 after SREBP1/2 knockdown. (B) Transcript levels for IDH1 and IDH2 following SREBP1/2 knockdown. (C) Cells transfected with nontargeting control siRNAs (−) or those targeting SREBP1, SREBP2, or both were lysed 72 h posttransfection for immunoblot analysis. Immunoblots shown are representative of at least two independent experiments. (A and B) Transcript levels are shown as means ± the SEM relative to cells transfected with nontargeting siRNA (n = 2).
To determine whether regulation of SREBP activation by sterols was also able to affect IDH1 expression in IDH1 mutant cells, HT1080 and HCT116-IDH1R132C/+ cells were cultured in the presence of 25-HC or statins for 2 days. As expected, SCD and LDLR mRNA expression were decreased by 25-HC treatment (Fig. 8A). IDH1 expression was likewise decreased by 25-HC, while IDH2 expression remained unchanged. As in other cellular settings (Fig. 5), blocking SREBP processing with 25-HC decreased SCD protein levels by 24 h, whereas a decrease in FASN protein was only detectable after 2 or 3 days (Fig. 8B). 25-HC decreased IDH1 protein levels after 1 day, with a more substantial decrease by 2 or 3 days, without effects on IDH2. Conversely, statin-mediated promotion of SREBP activation increased IDH1 transcript levels, as well as SCD and LDLR, in the IDH1 mutant cell lines treated with either atorvastatin (Fig. 8C) or simvastatin (Fig. 8D). Immunoblots confirmed that statin treatment increased SREBP processing and SCD protein levels in both cell lines, but FASN protein levels were only increased in the statin-treated HT1080 cells and not the HCT116-IDH1R132C/+ cells (Fig. 8E). Similarly, IDH1 protein levels were increased in both cell lines after 1 day of treatment with statins, with more pronounced changes in the HT1080 cells. Collectively, these data indicate that SREBP can promote IDH1 expression in cells with both wild-type and oncogenic IDH1.
FIG 8.

Reciprocal regulation of SREBP processing by 25-hydroxycholesterol or statins respectively inhibits or activates IDH1 expression in IDH1R132C mutant cells. (A and B) Cells were treated with 25-HC (1 μg/ml) for 48 h prior to RNA isolation for analysis by qRT-PCR (A) or 0, 1, 2, or 3 days prior to lysis for immunoblot analysis (B). (C to E) Cells were cultured in the presence of atorvastatin at 5 μM (C) or simvastatin at 5 μM (D) for 48 h prior to RNA extraction for qRT-PCR analysis or for 0, 1, or 2 days prior to lysis for immunoblot analysis (E). In panels A, C, and D, the transcript levels are shown as means ± the SEM relative to untreated cells (n = 3; *, P < 0.05). In panels B and E, the immunoblots shown are representative of at least two independent experiments. (P), precursor, full-length SREBP2; (M), mature, active SREBP2.
Since the IDH1R132C mutant produces the oncometabolite 2-HG and SREBP can regulate the expression of this oncogene, we tested whether SREBP could affect 2-HG production in IDH1-mutant cells. We depleted SREBP1/2 or IDH1 using siRNAs in the IDH1-mutant HT1080 and HCT116 cells (Fig. 9A). To detect changes in 2-HG production, we used stable-isotope tracer analysis to measure incorporation of carbon from [U-13C]glucose into 2-HG (Fig. 9B). 2-HG derived from the labeled glucose contains two additional atomic mass units (or daltons), which can be measured and distinguished from unlabeled 2-HG by LC-MS/MS. As confirmation that this approach is measuring cellular oncogenic IDH1 activity, the relative levels and fractional abundance of 13C-labeled (M+2), as well as unlabeled (M+0), 2-HG were significantly decreased by IDH1 knockdown in HT1080 cells (Fig. 9C). Furthermore, 13C tracing into 2-HG was nearly 30-fold higher in the HCT116-IDH1R132C/+ cells than in their isogenic wild-type counterparts, and IDH1 knockdown decreased this labeling (Fig. 9D). In HT1080 cells depleted of SREBP1/2, [13C]glucose labeling revealed a significant decrease in levels and fractional abundance of 13C-labeled (M+2) 2-HG relative to control knockdowns (Fig. 9C). In HCT116-IDH1R132C/+ cells, SREBP1/2 knockdown resulted in a more modest decrease in 2-HG (M+2) labeling and fractional abundance (Fig. 9D). The degree of decrease in 2-HG labeling measured in these experiments was proportional to IDH1 protein levels, which are much more strongly reduced by knockdown of IDH1 than SREBP1/2 (Fig. 9A). Importantly, the effects of SREBP depletion on glucose-derived 2-HG was not due to defects in glucose flux into the TCA cycle, as labeling of citrate and isocitrate was either unchanged or increased upon SREBP knockdown in these two cell lines (Fig. 9C and D). These data suggest that the SREBP-mediated regulation of oncogenic IDH1 can influence its production of 2-HG.
FIG 9.
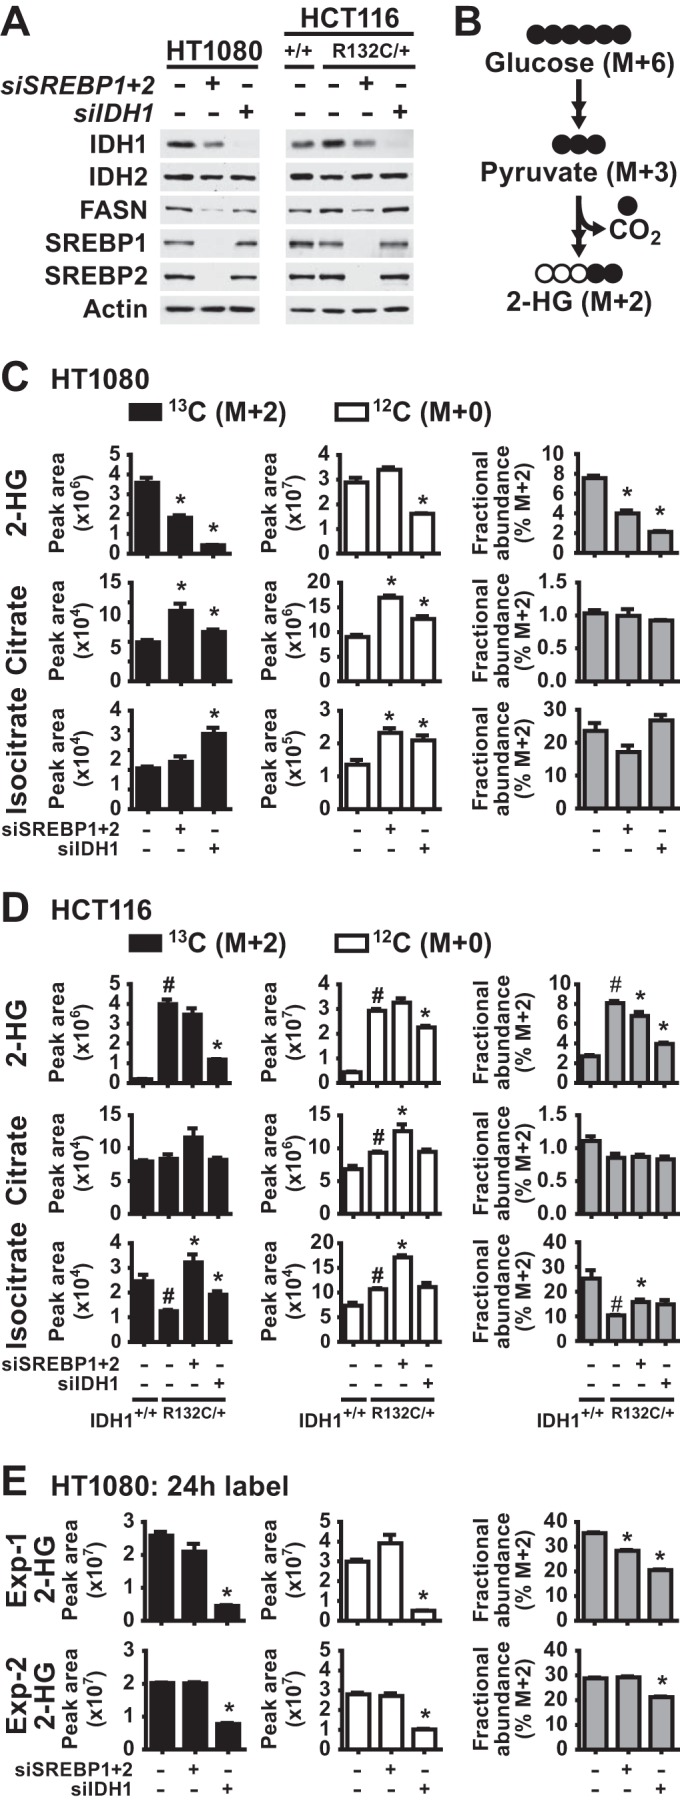
SREBP promotes 2-hydroxyglutarate production in IDH1R132C mutant cells. (A) Cells were lysed for immunoblotting at 72 h posttransfection with nontargeting siRNAs (−) or siRNAs targeting SREBP1 and SREBP2 or IDH1. (B) Diagram of carbon flux from [U-13C]glucose into 13C-2-HG (M+2). Filled and empty circles represent 13C and 12C carbons, respectively, with M+6 and M+2 referring to the mass increase from the stable isotope carbons. (C to E) Normalized peak areas of 13C-labeled (M+2) and unlabeled (M+0) metabolites and the fractional abundance of 13C-labeled M+2 metabolites measured by LC-MS/MS in metabolite extracts from cells at 72 h posttransfection with nontargeting control siRNAs (−) or siRNAs targeting SREBP1 and SREBP2 or IDH1. HT1080 cells (C) and isogenic HCT116 cells with wild-type (+/+) or mutant (R132C/+) IDH1 (D) were labeled with [U-13C]glucose for 20 min. For panel E, HT1080 cells were labeled with [U-13C]glucose for 24 h, and the results of two experiments are shown. In panels C and D, the data are representative of at least two independent experiments. In panels C, D, and E, the data are presented as means ± the SEM of biological triplicates (*, P < 0.05 relative to cells transfected with control siRNAs; #, P < 0.05 relative to wild-type HCT116 cells).
It is worth noting that steady state, unlabeled levels of 2-HG were unaffected by SREBP depletion in these experiments (Fig. 9C and D). IDH1 knockdown also had a less-pronounced effect on the total pool of unlabeled 2-HG in these cells compared to that produced from the labeled substrate. This effect is likely due to the fact that the steady-state levels of 2-HG reflect not just IDH1-mediated synthesis but also the turnover and release into the extracellular media of this metabolite. Consistent with a lack of effects on steady-state 2-HG upon SREBP knockdown, we also did not detect reproducible changes in labeled 2-HG in 24-hour labeling experiments, with one experiment showing a modest decrease in labeling and fractional abundance and the other showing no change (Fig. 9E). IDH1 knockdown gave a modest but significant decrease in fractional abundance in both experiments.
To test whether regulation of SREBP processing by sterols, which influences the expression of oncogenic IDH1 (Fig. 8), can affect 2-HG production, we cultured HT1080 cells in the presence of 25-HC or atorvastatin for 2 days, to respectively inhibit or activate SREBP, and measured incorporation of labeled carbon from [U-13C]glucose into 2-HG. Treatment with 25-HC significantly decreased the flux of glucose into 2-HG, whereas atorvastatin treatment significantly increased it (Fig. 10A). The unlabeled pool of 2-HG was significantly increased by atorvastatin treatment but was unaffected by 25-HC treatment. The 25-HC-induced decrease in 2-HG labeling was not due to decreased flux of glucose into the TCA cycle intermediates citrate or isocitrate, which were increased in M+2 labeling. However, atorvastatin increased glucose flux into these intermediates, similar to its effects on 2-HG. This finding raises the possibility that this effect of atorvastatin, together with its induction of oncogenic IDH1 expression (Fig. 8), contributes to its promotion of 2-HG production. These data lend further support for the activation state of SREBP influencing 2-HG production from glucose in cells with oncogenic IDH1 mutations.
FIG 10.
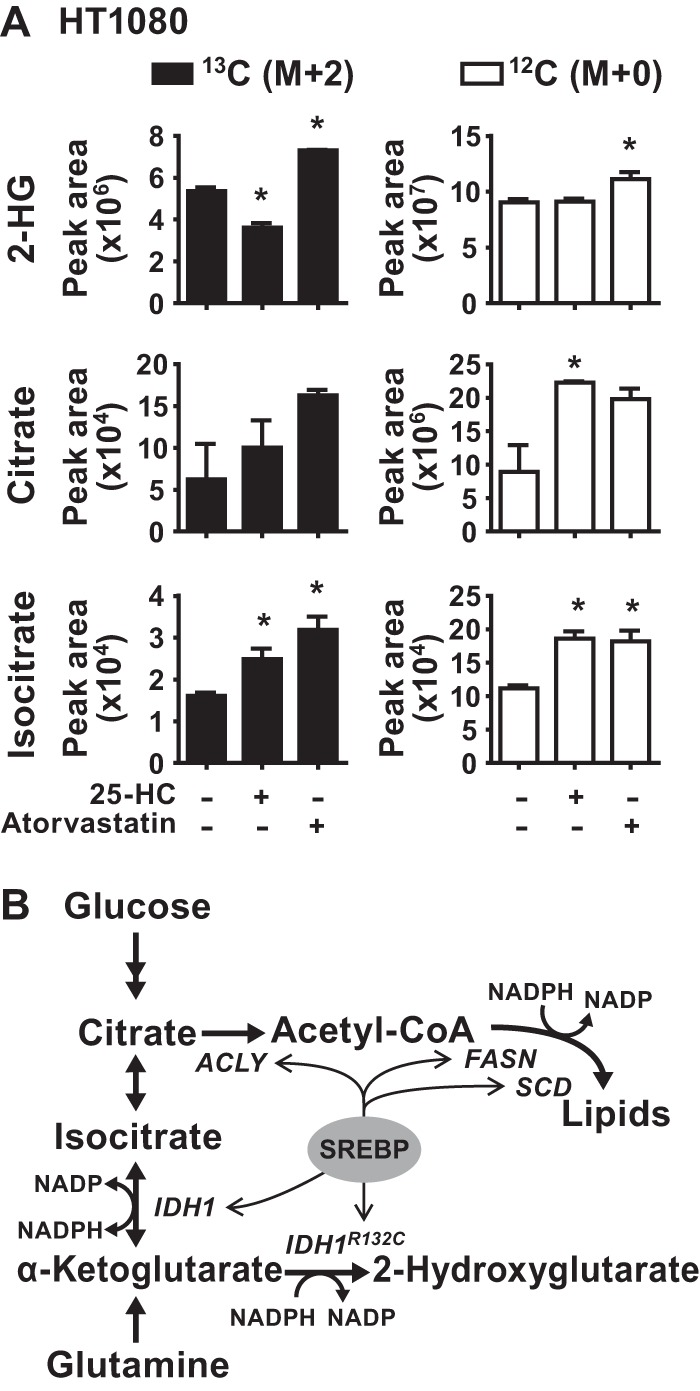
Reciprocal regulation of 2-hydroxyglutarate production by 25-hydroxycholesterol or statins in IDH1R132C-mutant cells. (A) Normalized peak areas of 13C-labeled (M+2) or unlabeled (M+0) metabolites measured by LC-MS/MS in metabolite extracts from HT1080 cells cultured for 48 h in the presence of 25-HC (1 μg/ml) or atorvastatin (5 μM) and pulse-labeled with [U-13C]glucose for 20 min. The data are presented as the means ± the SEM of biological triplicates and are representative of two independent experiments (*, P < 0.05 relative to untreated cells). (B) Model of SREBP-mediated control of wild-type and oncogenic IDH1, their metabolic functions, and de novo lipid synthesis.
DISCUSSION
The SREBP transcription factors have emerged as major drivers of lipid synthesis in the liver and in cancer (3, 8, 44, 45). Since de novo lipogenesis consumes large quantities of carbon and reducing power in the form of NADPH, cells must adapt their metabolism to provide the necessary substrates. However, little is known about how SREBP coordinates its regulation of lipogenic genes with these auxiliary support processes. In the present study, we demonstrate that SREBP activates IDH1 expression in a variety of cell settings. We show that IDH1 supports de novo lipogenesis by facilitating the flow of carbons from glutamine to lipids (Fig. 10B). Furthermore, we reveal that, in IDH1 mutant cells, SREBP can activate expression of oncogenic IDH1 and regulate the production of the oncometabolite 2-HG.
SREBP appears to regulate IDH1 expression in a contextual manner, suggesting that other transcription factors are also impinging on its regulation in some settings. Consistent with our findings, a review of supplemental data from a transgenic mouse study of SREBP targets in the liver reveals that IDH1 expression was increased by active versions of either SREBP1 or SREBP2 and was decreased in livers lacking SCAP, which is required for SREBP activation (13). The transcription factors CHOP and C/EBPβ have been proposed to activate IDH1 expression in response to ER stress, although neither affected basal IDH1 expression (46). Another study found that the forkhead box O (FOXO) family transcription factors can directly regulate IDH1 expression in certain settings, including the HT1080 cells used in the present study (47). In addition to intracellular sterol levels, reported here, the differential regulation of IDH1 expression is likely to be dictated by the status of upstream signaling networks in a given setting, since SREBP and FOXO family members are generally activated at opposing times due to their reciprocal regulation by the PI3K-Akt pathway.
The transcriptional control of IDH1 by SREBP is consistent with the central role of SREBP in controlling the expression of enzymes directly and indirectly involved in de novo lipogenesis. Under optimal growth conditions, a high ratio of citrate to α-ketoglutarate drives the IDH1 reaction toward production of NADPH (48, 49). However, under conditions of hypoxia or mitochondrial dysfunction, the IDH1 reaction is reversed, favoring the reductive carboxylation of α-ketoglutarate to produce isocitrate (16, 17, 19). Here, we found that IDH1 is required for de novo lipid synthesis when glutamine is the primary lipogenic carbon source. Consistent with the IDH1 and IDH2 enzymes playing a minor role in cellular NADPH/NADP+ homeostasis (50), NADPH production by IDH1 does not appear to be a major contributor to lipogenesis in our experimental settings, given that glucose- and acetate-derived lipogenesis are unaffected by IDH1 knockdown.
Oncogenic hot spot mutations in IDH1 disrupt its normal homeostatic role, since the mutant enzyme is unable to catalyze the reductive carboxylation reaction and the alternative reaction producing 2-HG consumes NADPH (23, 51). In line with previous work showing that transcriptional regulation of oncogenic IDH1R132C can disrupt 2-HG production (47), we show that SREBP activation and inhibition reciprocally increase and decrease IDH1-dependent 2-HG production in IDH1R132C cells. With multiple transcription factors converging on IDH1 expression, it will be particularly important to determine its primary mode of regulation in low grade glioma, where it is the major driving oncogene. Our analyses of available gene expression data suggest an association between SREBP activation and IDH1 expression in these tumors. Given that IDH1 mutations only occur in a specific subset of cancers, it is perhaps not surprising that the degree of SREBP effects on 2-HG production differs between the HT1080 fibrosarcoma cells that have a spontaneous IDH1R132C mutation and the genome-edited HCT116 colorectal cancer cells engineered to express this same mutation. In cells with mutant IDH1, de novo lipid synthesis and 2-HG production likely compete for the same pool of carbons, and SREBP controls both of these processes (Fig. 10B), which perhaps underlies these variable outcomes. Together with this dual regulation by SREBP, the rate of 2-HG turnover and forces affecting the equilibrium between the intracellular and extracellular pools could contribute to the differences in short- and long-term glucose tracing into 2-HG that we observe. As other spontaneous IDH1 mutant cell lines become available, it will be interesting to identify the metabolic factors that account for this variability. Intriguingly, exogenous overexpression of mutant IDH1 in U87MG cells has been reported to activate expression of SREBP and its targets (52, 53). Likewise, in the isogenic HCT116 cells used here, the protein levels of the SREBP targets, including IDH1 and FASN, were higher in the IDH1 mutant cells than in the wild type (Fig. 9A). These observations suggest that a feed-forward loop between mutant IDH1 and SREBP might occur in certain settings, perhaps due to depletion of specific lipid species due to the diversion of carbon flux or consumption of NADPH.
Our collective data show that SREBP can stimulate IDH1 expression and that this regulation can influence lipid synthesis in IDH1 wild-type cells and 2-HG production in IDH1 mutant cells. These findings add to the functional repertoire of SREBP, which has diverse physiological and pathological roles in the control of cellular metabolism.
ACKNOWLEDGMENTS
We thank Min Yuan and Susanne Breitkopf for technical assistance and members of the Manning Lab for thoughtful discussions and advice.
REFERENCES
- 1.Goldstein JL, DeBose-Boyd RA, Brown MS. 2006. Protein sensors for membrane sterols. Cell 124:35–46. doi: 10.1016/j.cell.2005.12.022. [DOI] [PubMed] [Google Scholar]
- 2.Jeon T, Osborne TF. 2011. SREBPs: metabolic integrators in physiology and metabolism. Trends Endocrinol Metab 23:65–72. doi: 10.1016/j.tem.2011.10.004. [DOI] [PMC free article] [PubMed] [Google Scholar]
- 3.Ricoult SJH, Yecies JL, Ben-Sahra I, Manning BD. 2016. Oncogenic PI3K and K-Ras stimulate de novo lipid synthesis through mTORC1 and SREBP. Oncogene 35:1250–1260. doi: 10.1038/onc.2015.179. [DOI] [PMC free article] [PubMed] [Google Scholar]
- 4.Düvel K, Yecies JL, Menon S, Raman P, Lipovsky AI, Souza AL, Triantafellow E, Ma Q, Gorski R, Cleaver S, Vander Heiden MG, MacKeigan JP, Finan PM, Clish CB, Murphy LO, Manning BD. 2010. Activation of a metabolic gene regulatory network downstream of mTOR complex 1. Mol Cell 39:171–183. doi: 10.1016/j.molcel.2010.06.022. [DOI] [PMC free article] [PubMed] [Google Scholar]
- 5.Porstmann T, Santos CR, Griffiths B, Cully M, Wu M, Leevers S, Griffiths JR, Chung Y-L, Schulze A. 2008. SREBP activity is regulated by mTORC1 and contributes to Akt-dependent cell growth. Cell Metab 8:224–236. doi: 10.1016/j.cmet.2008.07.007. [DOI] [PMC free article] [PubMed] [Google Scholar]
- 6.Sakai J, Duncan EA, Rawson RB, Hua X, Brown MS, Goldstein JL. 1996. Sterol-regulated release of SREBP-2 from cell membranes requires two sequential cleavages, one within a transmembrane segment. Cell 85:1037–1046. doi: 10.1016/S0092-8674(00)81304-5. [DOI] [PubMed] [Google Scholar]
- 7.Wang X, Sato R, Brown MS, Hua X, Goldsteln JL. 1994. SREBP-1, a membrane-bound transcription factor released by sterol-regulated proteolysis. Cell 77:53–62. doi: 10.1016/0092-8674(94)90234-8. [DOI] [PubMed] [Google Scholar]
- 8.Horton JD, Goldstein JL, Brown MS. 2002. SREBPs: activators of the complete program of cholesterol and fatty acid synthesis in the liver. J Clin Invest 109:1125–1131. doi: 10.1172/JCI0215593. [DOI] [PMC free article] [PubMed] [Google Scholar]
- 9.Amemiya-kudo M, Shimano H, Hasty AH, Yahagi N, Yoshikawa T, Matsuzaka T, Okazaki H, Tamura Y, Iizuka Y, Ohashi K, Osuga J, Harada K, Gotoda T, Sato R, Kimura S, Ishibashi S, Yamada N. 2002. Transcriptional activities of nuclear SREBP-1a, -1c, and -2 to different target promoters of lipogenic and cholesterogenic genes. J Lipid Res 43:1220–1235. [PubMed] [Google Scholar]
- 10.Shimomura I, Shimano H, Korn BS, Bashmakov Y, Horton JD. 1998. Nuclear sterol regulatory element-binding proteins activate genes responsible for the entire program of unsaturated fatty acid biosynthesis in transgenic mouse liver. J Biol Chem 273:35299–35306. doi: 10.1074/jbc.273.52.35299. [DOI] [PubMed] [Google Scholar]
- 11.Luong A, Hannah VC, Brown MS, Goldstein JL. 2000. Molecular characterization of human acetyl-CoA synthetase, an enzyme regulated by sterol regulatory element-binding proteins. J Biol Chem 275:26458–26466. doi: 10.1074/jbc.M004160200. [DOI] [PubMed] [Google Scholar]
- 12.Infantino V, Iacobazzi V, De Santis F, Mastrapasqua M, Palmieri F. 2007. Transcription of the mitochondrial citrate carrier gene: Role of SREBP-1, upregulation by insulin and downregulation by PUFA. Biochem Biophys Res Commun 356:249–254. doi: 10.1016/j.bbrc.2007.02.114. [DOI] [PubMed] [Google Scholar]
- 13.Horton JD, Shah NA, Warrington JA, Anderson NN, Park SW, Brown MS, Goldstein JL. 2003. Combined analysis of oligonucleotide microarray data from transgenic and knockout mice identifies direct SREBP target genes. Proc Natl Acad Sci U S A 100:12027–12032. doi: 10.1073/pnas.1534923100. [DOI] [PMC free article] [PubMed] [Google Scholar]
- 14.Sato R, Okamoto A, Inoue J, Miyamoto W, Sakai Y, Emoto N, Shimano H, Maeda M. 2000. Transcriptional regulation of the ATP citrate-lyase gene by sterol regulatory element-binding proteins. J Biol Chem 275:12497–12502. doi: 10.1074/jbc.275.17.12497. [DOI] [PubMed] [Google Scholar]
- 15.Koh H-J, Lee S-M, Son B-G, Lee S-H, Ryoo ZY, Chang K-T, Park J-W, Park D-C, Song BJ, Veech RL, Song H, Huh T-L. 2004. Cytosolic NADP+-dependent isocitrate dehydrogenase plays a key role in lipid metabolism. J Biol Chem 279:39968–39974. doi: 10.1074/jbc.M402260200. [DOI] [PubMed] [Google Scholar]
- 16.Metallo CM, Gameiro PA, Bell EL, Mattaini KR, Yang J, Hiller K, Jewell CM, Johnson ZR, Irvine DJ, Guarente L, Kelleher JK, Vander Heiden MG, Iliopoulos O, Stephanopoulos G. 2011. Reductive glutamine metabolism by IDH1 mediates lipogenesis under hypoxia. Nature 481:380–384. doi: 10.1038/nature10602. [DOI] [PMC free article] [PubMed] [Google Scholar]
- 17.Filipp FV, Scott DA, Ronai ZA, Osterman AL, Smith JW. 2012. Reverse TCA cycle flux through isocitrate dehydrogenases 1 and 2 is required for lipogenesis in hypoxic melanoma cells. Pigment Cell Melanoma Res 25:375–383. doi: 10.1111/j.1755-148X.2012.00989.x. [DOI] [PMC free article] [PubMed] [Google Scholar]
- 18.Shechter I, Dai P, Huo L, Guan G. 2003. IDH1 gene transcription is sterol regulated and activated by SREBP-1a and SREBP-2 in human hepatoma HepG2 cells: evidence that IDH1 may regulate lipogenesis in hepatic cells. J Lipid Res 44:2169–2180. doi: 10.1194/jlr.M300285-JLR200. [DOI] [PubMed] [Google Scholar]
- 19.Mullen AR, Wheaton WW, Jin ES, Chen P-H, Sullivan LB, Cheng T, Yang Y, Linehan WM, Chandel NS, DeBerardinis RJ. 2011. Reductive carboxylation supports growth in tumour cells with defective mitochondria. Nature 481:385–388. doi: 10.1038/nature10642. [DOI] [PMC free article] [PubMed] [Google Scholar]
- 20.Wise DR, Ward PS, Shay JES, Cross JR, Gruber JJ, Sachdeva UM, Platt JM, Dematteo RG, Simon MC, Thompson CB. 2011. Hypoxia promotes isocitrate dehydrogenase-dependent carboxylation of α-ketoglutarate to citrate to support cell growth and viability. Proc Natl Acad Sci U S A 108:19611–19616. doi: 10.1073/pnas.1117773108. [DOI] [PMC free article] [PubMed] [Google Scholar]
- 21.Parsons DW, Jones S, Zhang X, Lin JC, Leary RJ, Angenendt P, Mankoo P, Carter H, Siu I, Gallia GL, Olivi A, Mclendon R, Rasheed BA, Keir S, Nikolskaya T, Nikolsky Y, Busam DA, Tekleab H, LA D Jr, Hartigan J, Smith DR, Strausberg RL, Kazue S, Marie N, Mieko S, Shinjo O, Yan H, Riggins GJ, Bigner DD, Velculescu VE, Kinzler KW. 2008. An integrated genomic analysis of human glioblastoma multiforme. Science 321:1807–1812. doi: 10.1126/science.1164382. [DOI] [PMC free article] [PubMed] [Google Scholar]
- 22.Mardis ER, Ding L, Dooling DJ, Larson DE, McLellan MD, Chen K, Koboldt DC, Fulton RS, Delehaunty KD, McGrath SD, Fulton LA, Locke DP, Magrini VJ, Abbott RM, Vickery TL, Reed JS, Robinson JS, Wylie T, Smith SM, Carmichael L, Eldred JM, Harris CC, Walker J, Peck JB, Du F, Dukes AF, Sanderson GE, Brummett AM, Clark E, McMichael JF, Meyer RJ, Schindler JK, Pohl CS, Wallis JW, Shi X, Lin L, Schmidt H, Tang Y, Haipek C, Wiechert ME, Ivy JV, Kalicki J, Elliott G, Ries RE, Payton JE, Westervelt P, Tomasson MH, Watson MA, Baty J, Heath S, Shannon WD, Nagarajan R, Link DC, Walter MJ, Graubert TA, DiPersio JF, Wilson RK, Ley TJ. 2009. Recurring mutations found by sequencing an acute myeloid leukemia genome. N Engl J Med 361:1058–1066. doi: 10.1056/NEJMoa0903840. [DOI] [PMC free article] [PubMed] [Google Scholar]
- 23.Dang L, White DW, Gross S, Bennett BD, Bittinger MA, Driggers EM, Fantin VR, Jang HG, Jin S, Keenan MC, Marks KM, Prins RM, Ward PS, Yen KE, Liau LM, Rabinowitz JD, Cantley LC, Thompson CB, Vander Heiden MG, Su SM. 2009. Cancer-associated IDH1 mutations produce 2-hydroxyglutarate. Nature 465:739–744. doi: 10.1038/nature09132. [DOI] [PMC free article] [PubMed] [Google Scholar]
- 24.Ward PS, Patel J, Wise DR, Abdel-Wahab O, Bennett BD, Coller HA, Cross JR, Fantin VR, Hedvat CV, Perl AE, Rabinowitz JD, Carroll M, Su SM, Sharp KA, Levine RL, Thompson CB. 2010. The common feature of leukemia-associated IDH1 and IDH2 mutations is a neomorphic enzyme activity converting a-ketoglutarate to 2-hydroxyglutarate. Cancer Cell 17:225–234. doi: 10.1016/j.ccr.2010.01.020. [DOI] [PMC free article] [PubMed] [Google Scholar]
- 25.Flavahan WA, Drier Y, Liau BB, Gillespie SM, Venteicher AS, Stemmer-Rachamimov AO, Suvà ML, Bernstein BE. 2015. Insulator dysfunction and oncogene activation in IDH mutant gliomas. Nature 529:110–114. doi: 10.1038/nature16490. [DOI] [PMC free article] [PubMed] [Google Scholar]
- 26.Xu W, Yang H, Liu Y, Yang Y, Wang PP, Kim S-H, Ito S, Yang C, Xiao M-T, Liu L, Jiang W, Liu J, Zhang J, Wang B, Frye S, Zhang Y, Xu Y, Lei Q, Guan K-L, Zhao S, Xiong Y. 2011. Oncometabolite 2-hydroxyglutarate is a competitive inhibitor of α-ketoglutarate-dependent dioxygenases. Cancer Cell 19:17–30. doi: 10.1016/j.ccr.2010.12.014. [DOI] [PMC free article] [PubMed] [Google Scholar]
- 27.Koivunen P, Lee S, Duncan CG, Lopez G, Lu G, Ramkissoon S, Losman JA, Joensuu P, Bergmann U, Gross S, Travins J, Weiss S, Looper R, Ligon KL, Verhaak RGW, Yan H, Kaelin WG. 2012. Transformation by the (R)-enantiomer of 2-hydroxyglutarate linked to EGLN activation. Nature 483:484–488. doi: 10.1038/nature10898. [DOI] [PMC free article] [PubMed] [Google Scholar]
- 28.Folch J, Lees M, Stanley GHS. 1957. A simple method for the isolation and purification of total lipids from animal tissues. J Biol Chem 226:497–509. [PubMed] [Google Scholar]
- 29.Cerami E, Gao J, Dogrusoz U, Gross BE, Sumer SO, Aksoy BA, Jacobsen A, Byrne CJ, Heuer ML, Larsson E, Antipin Y, Reva B, Goldberg AP, Sander C, Schultz N. 2012. The cBio cancer genomics portal: an open platform for exploring multidimensional cancer genomics data. Cancer Discov 2:401–404. doi: 10.1158/2159-8290.CD-12-0095. [DOI] [PMC free article] [PubMed] [Google Scholar]
- 30.Gao J, Aksoy BA, Dogrusoz U, Dresdner G, Gross B, Sumer SO, Sun Y, Jacobsen A, Sinha R, Larsson E, Cerami E, Sander C, Schultz N. 2013. Integrative analysis of complex cancer genomics and clinical profiles using the cBioPortal. Sci Signal 6:pl1. doi: 10.1126/scisignal.2004088. [DOI] [PMC free article] [PubMed] [Google Scholar]
- 31.The Cancer Genome Atlas Network. 2015. Comprehensive, integrative genomic analysis of diffuse lower-grade gliomas. N Engl J Med 372:2481–2498. doi: 10.1056/NEJMoa1402121. [DOI] [PMC free article] [PubMed] [Google Scholar]
- 32.The Cancer Genome Atlas Network. 2015. The molecular taxonomy of primary prostate cancer. Cell 163:1011–1025. doi: 10.1016/j.cell.2015.10.025. [DOI] [PMC free article] [PubMed] [Google Scholar]
- 33.The Cancer Genome Atlas Network. 2012. Comprehensive molecular characterization of human colon and rectal cancer. Nature 487:330–337. doi: 10.1038/nature11252. [DOI] [PMC free article] [PubMed] [Google Scholar]
- 34.The Cancer Genome Atlas Network. 2015. Genomic classification of cutaneous melanoma. Cell 161:1681–1696. doi: 10.1016/j.cell.2015.05.044. [DOI] [PMC free article] [PubMed] [Google Scholar]
- 35.The Cancer Genome Atlas Network. 2012. Comprehensive molecular portraits of human breast tumours. Nature 490:61–70. doi: 10.1038/nature11412. [DOI] [PMC free article] [PubMed] [Google Scholar]
- 36.The Cancer Genome Atlas Network. 2014. Comprehensive molecular profiling of lung adenocarcinoma. Nature 511:543–550. doi: 10.1038/nature13385. [DOI] [PMC free article] [PubMed] [Google Scholar]
- 37.Ben-Sahra I, Howell JJ, Asara JM, Manning BD. 2013. Stimulation of de novo pyrimidine synthesis by growth signaling through mTOR and S6K1. Science 339:1323–1328. doi: 10.1126/science.1228792. [DOI] [PMC free article] [PubMed] [Google Scholar]
- 38.Yuan M, Breitkopf SB, Yang X, Asara JM. 2012. A positive/negative ion-switching, targeted mass spectrometry-based metabolomics platform for bodily fluids, cells, and fresh and fixed tissue. Nat Protoc 7:872–881. doi: 10.1038/nprot.2012.024. [DOI] [PMC free article] [PubMed] [Google Scholar]
- 39.Park JW, Jung WS, Park SR, Park BC, Yoon YJ. 2007. Analysis of intracellular short organic acid-coenzyme A esters from actinomycetes using liquid chromatography-electrospray ionization-mass spectrometry. J Mass Spectrom 42:1136–1147. doi: 10.1002/jms.1240. [DOI] [PubMed] [Google Scholar]
- 40.Amemiya-Kudo M, Shimano H, Yoshikawa T, Yahagi N, Hasty AH, Okazaki H, Tamura Y, Shionoiri F, Iizuka Y, Ohashi K, Osuga J, Harada K, Gotoda T, Sato R, Kimura S, Ishibashi S, Yamada N. 2000. Promoter analysis of the mouse sterol regulatory element-binding protein-1c gene. J Biol Chem 275:31078–31085. doi: 10.1074/jbc.M005353200. [DOI] [PubMed] [Google Scholar]
- 41.Tweto J, Liberati M, Larrabee A. 1971. Protein turnover and 4′-phosphopantetheine exchange in rat liver fatty acid synthetase. J Biol Chem 246:2468–2471. [PubMed] [Google Scholar]
- 42.Goldstein JL, Brown MS. 1990. Regulation of the mevalonate pathway. Nature 343:425–430. doi: 10.1038/343425a0. [DOI] [PubMed] [Google Scholar]
- 43.Yan H, Parsons W, Jin G, McLendon R, Rasheed A, Yuan W, Kos I, Batinic-Haberle I, Jones S, Riggins GJ, Friedman H, Friedman A, Reardon D, Herndon J, Kinzler KW, Velculescu VE, Vogelstein B, Bigner DD. 2009. IDH1 and IDH2 mutations in gliomas. N Engl J Med 360:765–773. doi: 10.1056/NEJMoa0808710. [DOI] [PMC free article] [PubMed] [Google Scholar]
- 44.Lewis CA, Brault C, Peck B, Bensaad K, Grif B, Mitter R, Chakravarty P, East P, Dankworth B, Alibhai D, Harris AL, Schulze A. 2015. SREBP maintains lipid biosynthesis and viability of cancer cells under lipid- and oxygen-deprived conditions and defines a gene signature associated with poor survival in glioblastoma multiforme. Oncogene 34:5128–5140. doi: 10.1038/onc.2014.439. [DOI] [PubMed] [Google Scholar]
- 45.Williams KJ, Argus JP, Zhu Y, Wilks MQ, Marbois BN, York AG, Kidani Y, Pourzia AL, Akhavan D, Lisiero DN, Komisopoulou E, Henkin AH, Soto H, Chamberlain BT, Vergnes L, Jung ME, Torres JZ, Liau LM, Christofk HR, Prins RM, Mischel PS, Reue K, Graeber TG, Bensinger SJ. 2013. An essential requirement for the SCAP/SREBP signaling axis to protect cancer cells from lipotoxicity. Cancer Res 73:2850–2862. doi: 10.1158/1538-7445.AM2013-2850. [DOI] [PMC free article] [PubMed] [Google Scholar]
- 46.Yang X, Du T, Wang X, Zhang Y, Hu W, Du X, Miao L, Han C. 2015. IDH1, a CHOP and C/EBPβ-responsive gene under ER stress, sensitizes human melanoma cells to hypoxia-induced apoptosis. Cancer Lett 365:201–210. doi: 10.1016/j.canlet.2015.05.027. [DOI] [PubMed] [Google Scholar]
- 47.Charitou P, Rodriguez-colman M, Gerrits J, Van Triest M, Groot M, Hornsveld M, Holstege F, Verhoeven-duif NM, Burgering BM. 2015. FOXOs support the metabolic requirements of normal and tumor cells by promoting IDH1 expression. EMBO Rep 16:456–466. doi: 10.15252/embr.201439096. [DOI] [PMC free article] [PubMed] [Google Scholar]
- 48.Itsumi M, Inoue S, Elia AJ, Murakami K, Sasaki M, Lind EF, Brenner D, Harris IS, Chio IIC, Afzal S, Cairns RA, Cescon DW, Elford AR, Ye J, Lang PA, Li WY, Wakeham A, Duncan GS, Haight J, You-Ten A, Snow B, Yamamoto K, Ohashi PS, Mak TW. 2015. Idh1 protects murine hepatocytes from endotoxin-induced oxidative stress by regulating the intracellular NADP+/NADPH ratio. Cell Death Differ 22:1837–1845. doi: 10.1038/cdd.2015.38. [DOI] [PMC free article] [PubMed] [Google Scholar]
- 49.Fendt S-M, Bell EL, Keibler MA, Olenchock BA, Mayers JR, Wasylenko TM, Vokes NI, Guarente L, Vander Heiden MG, Stephanopoulos G. 2013. Reductive glutamine metabolism is a function of the α-ketoglutarate to citrate ratio in cells. Nat Com 4:2236. doi: 10.1038/ncomms3236. [DOI] [PMC free article] [PubMed] [Google Scholar]
- 50.Fan J, Ye J, Kamphorst JJ, Shlomi T, Thompson CB, Rabinowitz JD. 2014. Quantitative flux analysis reveals folate-dependent NADPH production. Nature 510:298–302. doi: 10.1038/nature13236. [DOI] [PMC free article] [PubMed] [Google Scholar]
- 51.Leonardi R, Subramanian C, Jackowski S, Rock CO. 2012. Cancer-associated isocitrate dehydrogenase mutations inactivate NADPH-dependent reductive carboxylation. J Biol Chem 287:14615–14620. doi: 10.1074/jbc.C112.353946. [DOI] [PMC free article] [PubMed] [Google Scholar]
- 52.Miyata S, Urabe M, Gomi A, Nagai M, Yamaguchi T, Tsukahara T, Mizukami H, Kume A, Ozawa K, Watanabe E. 2013. An R132H mutation in isocitrate dehydrogenase 1 enhances p21 expression and inhibits phosphorylation of retinoblastoma protein in glioma cells. Neurol Med Chir 53:645–654. doi: 10.2176/nmc.oa2012-0409. [DOI] [PMC free article] [PubMed] [Google Scholar]
- 53.Zhu J, Cui G, Chen M, Xu Q, Wang X, Zhou D, Lv S, Fu L, Wang Z, Zuo J. 2012. Expression of R132H mutational IDH1 in human U87 glioblastoma cells affects the SREBP1a pathway and induces cellular proliferation. J Mol Neurosci 50:165–171. doi: 10.1007/s12031-012-9890-6. [DOI] [PubMed] [Google Scholar]