

Abstract
25-Hydroxyvitamin D (25D) circulates bound primarily to serum vitamin D binding protein (DBP), with DBP showing higher binding affinity for 25D3 than 25D2. We therefore hypothesized that vitamin D2 (D2) promotes higher serum levels of unbound 25D (free 25D), with different functional responses, relative to vitamin D3 (D3). Week 3 C56BL/6 mice were placed on diets containing either D2 or D3 alone (both 1000 IU/kg). At week 8 and week 16, D2 mice had only 25D2 in circulation (26.6 ± 1.9 and 33.3 ± 4.4 ng/mL), and D3 mice had only 25D3 (28.3 ± 2.0 and 31.7 ± 2.1 ng/mL). At week 8 (44.5 ± 6.4 vs 62.4 ± 11.6 pg/mL, P < .05) and week 16 (78.4 ± 12.6 vs 95.5 ± 11.6), D2 mice had lower serum 1,25-dihydroxyvitamin D relative to D3 mice. By contrast, measured free 25D was significantly higher in D2 mice at week 8 (16.8 ± 0.65 vs 8.4 ± 0.63 pg/mL, P < .001) and week 16 (17.4 ± 0.43 vs 8.4 ± 0.44, P < .001). A two-way ANOVA of bone histomorphometry showed that week 8 D2 mice had significantly higher osteoclast surface/bone surface, eroded surface/bone surface, and mineral apposition rate compared with D3 mice. Osteoblast surface/bone surface was higher in week 8 D2 females but not week 8 D2 males. At week 16, D2 mice had significantly higher bone volume/total volume and trabecular number compared with D3 mice. Differences in bone phenotype were observed despite D2 mice reaching similar serum 25D levels and lower 1,25D levels compared with D3 mice. These data indicate that 25D2 binds less well to DBP than 25D3, with resulting higher levels of free 25D promoting differential effects on bone in mice exposed to D2 alone.
In recent years there has been considerable debate concerning the role of vitamin D in human health. A key feature of this has been the definition of optimal levels of vitamin D and the potential impact of vitamin D-deficiency on human disease (1). At present the vitamin D status of any given individual is determined by the total serum concentration of prohormone 25-hydroxyvitamin D (25D) (2). However, this parameter remains controversial, with target levels for circulating 25D varying considerably, depending on the population and clinical end point being studied (3, 4). It is also unclear how total serum 25D levels relate to physiological or disease responses, given that 25D is an inactive form of vitamin D that must be metabolized to active 1,25-dihydroxyvitamin D (1,25D) to initiate transcriptional responses via the nuclear vitamin D receptor (VDR). This may be particularly important for the many nonclassical, extraskeletal effects of 1,25D that have been reported in recent years (5–8), in which conversion of 25D to 1,25D and subsequent VDR signaling may take place in a tissue-specific manner (9).
In serum, vitamin D metabolites are bound primarily to the serum vitamin D binding (DBP) (10, 11). This association is central to the reabsorption of 25D in the proximal nephron and its subsequent metabolism to active 1,25D via the enzyme 1α-hydroxylase (CYP27B1) (12, 13), but binding to DBP does not appear to underpin the entry of 25D into many other tissues. Instead, for most extrarenal tissues, the general assumption is that vitamin D metabolites are biologically active when they are free of serum binding, even though this fraction may be very small (11, 14). This is likely to be crucial to vitamin D physiology because of the widespread extrarenal expression of CYP27B1 (15), in which localized synthesis of 1,25D and associated VDR responses may be highly dependent on the tissue availability of 25D that is not bound to DBP (16). The so-called free-hormone hypothesis (17, 18) has questioned the validity of total serum 25D measurement as an accurate marker of vitamin D function (19) and revived interest in DBP as a pivotal component of vitamin D physiology.
Genome-wide association studies have underlined the link between the DBP genotype, circulating levels of DBP, and serum 25D status (20). However, studies of Dbp knockout mice showed that, although these mice had almost undetectable serum levels of total 25D, the mice were phenotypically normal when raised on a normal vitamin D diet (21). A potential explanation for this is that despite lower circulating levels of total 25D, Dbp−/− mice have similar serum concentrations of free 25D relative to wild-type mice. With this observation in mind, we developed an alternative strategy for comparing the relative importance of total vs free serum 25D based on the differential binding affinity of vitamin D metabolites for DBP. Previous studies have shown that relative to 25D3, 25D2 has a lower binding affinity for DBP (22–24). This appears to be a key factor in the decreased serum half-life of 25D2 compared with 25D3 (25) and the increasing reluctance to use vitamin D2 for supplementation studies (26). To further characterize the relative impact of these two forms of 25D on physiological responses in vivo, we used mouse models in which the animals were raised from weaning on diets containing exclusively vitamin D2 or vitamin D3.
Materials and Methods
Cell culture
Studies in vitro were carried out using the MG63 human osteoblast cell line (American Type Culture Collection) cultured in DMEM with 10% fetal bovine serum and incubated at 37°C. For dose response to 25D2/D3 studies, cells were incubated in 2% human serum (HS) or 10% BSA for 6 hours. After treatment, the media were removed and TRIzol (Thermo Fisher, Waltham, MA) was added to extract RNA, cDNA was generated by SuperScript III reverse transcriptase with random primers according to suggested manufacturer procedures. RT-PCR was used to amplify cDNA and quantify genes of interest. Cycle threshold values were determined by instrument software for genes of interest and were subtracted by the cycle threshold (Ct) values of 18S rRNA to yield δCt values. Data are expressed as δδCt relative to vehicle-treated cultures.
Mice
Three-week-old male and female C57BL/6 mice were obtained from Jackson Laboratories and placed on the AIN-76A diet supplemented with either 1000 IU/kg vitamin D2 (D2) or vitamin D3 (D3) (Research Diets, Inc) until euthanasia at week 8 or week 16 of age. Protocols were approved by the Office of Animal Research Oversight at University of California, Los Angeles (University of California, Los Angeles Chancellor's Animal Research Committee, 2013–113-01). For each time point, eight male and eight female mice were allocated to D2 and D3 mice, with sample size based on previous studies of vitamin D-sufficient and -deficient mice (27). Each animal was an experimental unit, but mice were housed four animals per cage, and entry into the study was staggered so that only eight mice were killed on any given week. For serum vitamin D metabolites, bone histomorphometry and spleen immune cell, and gene expression studies, samples were analyzed blind. The primary outcome of this approach was to assess total and free serum concentrations of 25D2 and 25D3, with secondary outcomes being changes in bone and spleen markers.
Mice were housed within the CHS B-Floor mouse-only, barrier-specific, pathogen-free facility at the University of California, Los Angeles, which uses static microisolator and ventilated racks with β-chip and/or corn cob bedding material for mouse cages. All operations staff were dedicated to this facility only. Mice received D2- or D3-specific chow, and filtered tap water was provided via water bottles. Investigators had direct access to (Thermo Fisher) the mice, and all manipulations were carried out in a cage change station. Investigators provided fresh diet on a twice-weekly basis (Monday and Friday). Vivarium staff changed water and bedding weekly and, along with investigators, observed mice for general health and well-being. Automatic light cycles (12 h light, 12 h dark) are installed in all animal holding rooms along with 24 hours a day, 7 days a week room environment monitoring devices.
Analysis of mouse serum
Serum concentrations of 25D2 and 25D3 were analyzed by liquid chromatography-tandem mass spectrometry methods at Heartland Assays. Serum concentrations of 1,25D were assessed by a RIA (Heartland Assays). Serum-free 25D was quantified by an immunoassay at Future Diagnostics. This assay has 77% cross-reactivity with 25D2. PTH 1–84 was measured by an ELISA (Immutopics International. Serum DBP was measured using a mouse DBP serum quantikine ELISA kit (R&D Systems, according to the manufacturer's instructions.
Gene expression assays
Mouse kidney and spleen RNA was isolated by Trizol extraction and cDNA synthesized with SuperScript III reverse transcriptase according to the manufacturer protocols (Invitrogen Thermo Fisher Scientific) with random primers. Quantitative RT-PCR analysis was performed on an MX-3005P instrument (Agilent) using TaqMan system reagents. Specific probe/primer sets were as follows (all Invitrogen Thermo Fisher Scientific): human osteocalcin (BGLAP, Hs01587814_g1); mouse 25-hydroxyvitamin D-1α-hydroxylase (Cyp27b1) (Mm01165918_g1); mouse vitamin D-24-hydroxylase (Cyp24a1) (Mm00487244_m1); mouse vitamin D receptor (Vdr) (Mm00437297_m1); CD11b (Mm00434455_m1); CD14 (Mm00438094_g1); and receptor activator of nuclear factor-κB ligand (RANKL) (Mm00441906_m1). Eukaryotic 18S rRNA (probe/primer 4319413E) was used as an internal calibrator housekeeping gene. Reactions were carried out as described previously (27).
Bone histomorphometry
Static and dynamic histomorphometry was carried out on 8- and 16-week-old mice. Mice were injected ip in the afternoon with (12 mg/mL) calcein (Sigma-Aldrich) at 20 mg/kg body weight 7 and 2 days prior to euthanasia as recommended by the University of California, Los Angeles, Bone Histomorphometry Core Laboratory. Right femurs were collected from each animal, fixed in 70% ethanol, dehydrated with xylene, and embedded in methyl methacrylate. Longitudinal sections (5 μm) of the femur were prepared on a Microm microtome (Richard-Allan Scientific) and stained with toluidine blue. Static parameters of bone formation and resorption were measured in a defined area between 181 μm and 725 μm from the growth plate using an OsteoMeasure morphometry system (Osteometrics). Dynamic histomorphometry, mineralizing surface per bone surface, and the mineral apposition rate were measured in unstained sections under UV light, using a B-2A set long-pass filter consisting of an excitation filter ranging from 450 to 490 nm, a barrier filter at 515 nm, and a dichroic mirror at 500 nm. Bone formation rate was a calculated parameter. The terminology and units used are those recommended by the Histomorphometry Nomenclature Committee of the American Society for Bone and Mineral Research (28).
Microcomputed tomography (μCT) analyses
After euthanasia, left femurs were harvested, the attached soft tissues carefully removed, and the bones fixed in 10% buffered formalin phosphate and then stored in 70% ethanol at 4°C. μCT scans (model 1172; Skyscan) were acquired at 55 kVp and 72 μA at a resolution of 12 μm. Volumetric analysis was performed using the Skyscan software. For trabecular bone analyses, 200 slices per femur were measured, covering a total of 2.4 mm from the proximal growth plate to the shaft distally. The analysis of the secondary spongiosa begins at 0.048 mm below the most distal point of the primary spongiosa, which was defined as directly distal to the most distal portion of the growth plate. Nomenclature for the bone morphology parameters is as described (29).
Statistical analysis
Data for serum vitamin D metabolites and serum PTH as well as tissue gene expression data were analyzed by a Student's t test on Excel (Microsoft). Bone histomorphometry parameters were analyzed by a two-way ANOVA on Prizm 5 (GraphPad). Tables of data were presented as mean values ± SEM, and error bars in the graphs were SD or SEM as indicated in the figure legends.
Results
Differential potency of 25D2 and 25D3 in vitro
Consistent with previous studies of human monocytes (16), analysis of MG63 osteoblastic cells in vitro showed that these cells were more sensitive to 25D (25D2 or 25D3) when cultured in the medium lacking serum (2% human serum, 2% HS) (Figure 1). Furthermore, MG63 cells cultured in 2% HS showed greater sensitivity to 25D2 relative to 25D3 when measuring induction of the mRNA for osteocalcin (Figure 1A). However, both 25D2 and 25D3 were equally effective in stimulating osteocalcin mRNA when MG63 cells were cultured in serum-free medium (Figure 1B). These data supported the overarching hypothesis that 25D2 has greater biological potency in the presence of serum proteins such as DBP.
Figure 1.

Effects of 25D2 or 25D3 on osteocalcin mRNA in osteoblastic cells. MG63 cells were treated with 25D2 (○) or D3 (●) (0–200 nM) in medium containing 2% HS (A) or 10% BSA (B) for 6 hours. Data show increased mRNA for the osteoblastic marker gene osteocalcin (OCN). Values are mean ± SD (n = 4 cell preparations). ***, P < .001.
Serum-free 25D is elevated in mice raised on vitamin D2 diet relative to vitamin D3
To assess possible variations in functionality of 25D2 and 25D3 in vivo, further studies were carried out using mice raised on diets containing either D2 or D3 only. These diets had no detrimental effect on mice at 8 or 16 weeks of age, and each group of animals exhibited circulating 25D that was exclusively 25D2 or 25D3, with corresponding serum 1,25D2 or 1,25D3. In D2 mice, serum concentrations of 25D2 (26.56 ± 1.88 ng/mL at 8 wk and 33.25 ± 4.38 ng/mL at 16 wk) were similar to serum concentrations of 25D3 in D3 mice (28.27 ± 2.01 ng/mL at 8 wk and 31.72 ± 2.06 ng/mL at 16 wk) (Figure 2A). For both D2 and D3 mice, serum concentrations of 25D2 or 25D3 were significantly higher at 16 weeks of age compared with 8 weeks. In a similar fashion, serum concentrations of 1,25D2 and 1,25D3 were higher in week 16 mice compared with week 8 mice. However, in both age groups, serum concentrations of 1,25D3 in D3 mice (62.38 ± 11.59 pg/mL at 8 wk and 95.53 ± 11.59 pg/mL at 16 wk) were significantly higher than serum 1,25D2 in D2 mice (44.49 ± 6.45 pg/mL at 8 wk and 78.42 ± 12.61 pg/mL at 16 wk) (Figure 2B). A measurement of DBP concentrations for week 8 serum samples showed no significant difference between D2 and D3 mice (Figure 2C). Despite this, the free 25D levels were higher in D2 mice relative to D3 mice (16.75 ± 0.65 pg/mL vs 8.40 ± 0.63 pg/mL at 8 wk and 17.38 ± 0.43 ng/mL vs 8.43 ± 0.44 pg/mL at 16 wk) (Figure 2C).
Figure 2.

Vitamin D metabolites in mice raised on diets containing D2 or D3 only. Serum concentrations of total 25D (either 25D2 or 25D3) (A); 1,25D (either 1,25D2 or 1,25D3) (B); serum DBP (C); free 25D (D) in male or female mice raised on D2- or D3-only diets from week 3 of age until either 8 weeks or 16 weeks of age are shown (n = 3 for each male/female group). *, Statistically different from equivalent 8-week-old mice (P < .05). ***, Statistically different from equivalent 8-week-old mice (P < .001). ###, Statistically different from D3 equivalent (P < .001). n.d., not done.
Differences in kidney gene expression in D2 vs D3 mice
Analysis of kidney tissue showed no significant effect of D2 or D3 diets on the expression of mRNA for the vitamin D receptor (Vdr), 25-hydroxyvitamin D-1α-hydroxylase (Cyp27b1), or vitamin D-24-hydroxylase (Cyp24a1) in male or female mice at either week 8 or week 16 of age (Figure 3). Consistent with this, mean ± SD serum concentrations of PTH for D2 (193.16 ± 10.04 pg/mL for females and 139.95 ± 7.24 pg/mL for males) and D3 (195.69 ± 6.76 pg/mL for females and 157.00 ± 5.32 pg/mL for males) in week 8 mice showed no significant differences. Both male and female mice showed higher expression of Vdr (lower δΔCt) at week 16 of age compared with week 8 (Figure 3A). At 8 weeks of age, D2 and D3 male mice showed lower expression of Cyp27b1 (higher δCt) relative to their female counterparts (Figure 3B), and week 16 female D3 mice showed a higher expression (lower δCt) of Cyp24a1 relative to week 8 female D3 mice (Figure 3C).
Figure 3.

Effect of D2 or D3 on kidney gene expression in mice. Expression of mRNA for (A) the vitamin D receptor (Vdr), (B) 25-hydroxyvitamin D1α-hydroxylase (Cyp27b1), and (C) 24-hydroxylase (Cyp24a1) in kidneys from male or female mice raised on D2- or D3-only diets from week 3 of age until either 8 weeks or 16 weeks of age is shown (n = 6 separate animals). *, Statistically different from equivalent 8-week-old mice (P < .05); ***, statistically different from equivalent 8-week-old mice (P < .001). δδ, Statistically different from equivalent female mice (P < .01).
Differences in spleen gene expression and immune cell composition in D2 vs D3 mice
To determine the possible differential effects of D2 and D3 diets on extrarenal actions of 25D, analysis of mRNA expression was also carried out for spleen tissue. Data in Figure 4A indicate that male mice showed no significant change in expression for the genes Cyp27b1, CD11b, CD14, and RANKL. However, week 8 female D2 mice showed significantly increased expression of Cyp27b1, CD11b, and RANKL and significantly lower expression of CD14. Further analysis of spleen tissue from week 8 female mice by flow cytometry showed that the differential effects of D2 and D3 were restricted to less abundant splenic cell populations such as natural killer (NK) cells and monocyte/macrophages (Figure 4B). In spleens from D2 females, the percentage of NK cells (3.45% ± 0.36% vs 5.25% ± 0.31% of CD45+ cells) was lower, and the percentage of monocytes/macrophages was higher (3.31% ± 0.28% vs 2.40% ± 0.13% of CD45+ cells) relative to D3 females. Further analysis of the spleen monocyte population using CD11b/F4/80 markers showed a significantly higher proportion of CD11b-negative monocytes (10.62 ± 3.85 vs 3.10 ± 1.24) in D3 mice relative to D2 mice, but CD11b-positive monocytes were unaffected by diet.
Figure 4.

Effect of D2 or D3 on spleen gene expression and immune cell composition in week 8 female mice. Female mice raised on D2- or D3-only diets from week 3 of age until either 8 weeks or 16 weeks of age were assessed for the expression of mRNA for 25-hydroxyvitamin D1α-hydroxylase (Cyp27b1), CD11b, CD14, and receptor activator of nuclear factor-κB ligand (RANKL) (A). Values are shown as fold change in mRNA for each gene in D2 mice relative to D3 mice (D3 mice, n = 1). B, Immune cell composition based on the percentage of cells expressing the immune cell surface antigens CD4 (helper T cells), CD8 (cytotoxic T cells), B220 (B cells), NK1.1 (NK cells), and F4/80 and CD11b (monocytes) (n = 6 separate animals). *, Statistically different from equivalent D3 mice (P < .05); ***, statistically different from D3 mice (P < .001).
Variations in bone structure and cell composition in D2 vs D3 mice
Histomorphometric analysis of femurs from D2 and D3 mice showed changes in bone structure that were sex, diet, and time related. Example histomorphometric analyses for femur bone from week 16 female mice on D2 or D3 diets are shown in Figure 5. Quantitative analysis of bone structure markers was carried out for femur sections from multiple mice using defined regions of interest (Figure 5, inset box), with resulting data shown in Table 1. Statistically significant differences in bone structure and turnover markers for week 8 mice were primarily due to sex, with male mice showing higher bone volume (BV/TV), trabecular number (Tb.N), trabecular thickness (Tb.Th), mineralized bone surface, osteoid surface, mineral apposition rate (MAR), and bone formation rate, whereas trabecular spacing (Tb.Sp) was lower in males relative to females. Interestingly, at this time point, a two-way ANOVA showed that the eroded bone surface and MAR were significantly affected by D2 vs D3 diet. At week 16, all bone structure and turnover parameters were statistically different in male vs females, irrespective of diet. However, there was a significant diet effect in that BV/TV, Tb.N, and Tb.Th were significantly higher in D2 vs D3 mice, with Tb.Sp being lower in D2 mice. Further analysis of bone structure by μCT in week 16 mice confirmed the differential effects of D2 and D3 on BV/TV, Tb.N, and Tp.Sp, with these effects predominating in male mice (Figure 6).
Figure 5.
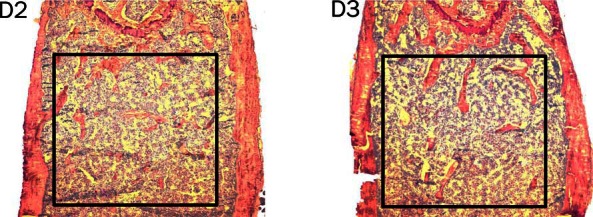
Bone structure in female mice on D2 and D diets at week 16 of age. Example images from bone histomorphometric analysis (magnification, ×40) of toluidine blue-stained femurs from week 16 female mice fed D2 or D3 diets. Black box indicates region of interest for quantitative analysis.
Table 1.
Effect of D2 or D3 on Indexes of Bone Structure and Turnover in Mice
| Age/Sex/Diet | n | BV/TV, % | Tb.N, n/mm2 | Tb.Sp, μm | Tb.Th, μm | ES/BS, % | MS/BS, % | OS/BS, % | MAR, μm/d | BFR/BS, μm3/μm2·d |
|---|---|---|---|---|---|---|---|---|---|---|
| Mice 8 wk | ||||||||||
| Female | ||||||||||
| D2 | 7 | 8.45 ± 0.61 | 2.99 ± 0.13 | 309.72 ± 15.23 | 28.11 ± 1.16 | 4.48 ± 0.36 | 4.99 ± 0.82 | 6.57 ± 1.70 | 1.41 ± 0.06 | 25.14 ± 3.72 |
| D3 | 7 | 7.13 ± 1.10 | 2.64 ± 0.24 | 373.73 ± 39.67 | 26.26 ± 1.51 | 1.73 ± 0.37 | 4.45 ± 0.54 | 6.78 ± 0.91 | 1.07 ± 0.13 | 18.24 ± 4.42 |
| Male | ||||||||||
| D2 | 8 | 12.63 ± 0.94 | 3.93 ± 0.22 | 228.13 ± 15.23 | 31.99 ± 1.11 | 3.65 ± 0.72 | 9.64 ± 1.69 | 3.08 ± 0.83 | 1.07 ± 0.03 | 37.75 ± 6.91 |
| D3 | 8 | 12.58 ± 0.77 | 4.03 ± 0.10 | 218.31 ± 7.28 | 31.23 ± 1.67 | 2.29 ± 0.35 | 9.17 ± 0.84 | 3.37 ± 0.74 | 0.99 ± 0.05 | 33.53 ± 3.91 |
| Two-way ANOVA, P value | ||||||||||
| Sex | < .0001 | < .0001 | < .0001 | .0038 | .7866 | .0003 | .0036 | .0105 | .0103 | |
| Diet | .4439 | .4816 | .2238 | .3589 | .0003 | .6516 | .8171 | .0107 | .2804 | |
| Sex × diet | .4756 | .2212 | .1014 | .6983 | .1713 | .9761 | .9714 | .0945 | .7929 | |
| Mice 16 wk | ||||||||||
| Female | ||||||||||
| D2 | 6 | 6.15 ± 0.29 | 2.14 ± 0.12 | 445.79 ± 25.28 | 28.84 ± 0.77 | 2.24 ± 0.53 | 8.84 ± 1.59 | 2.9 ± 0.50 | 1.01 ± 0.08 | 31.73 ± 5.39 |
| D3 | 8 | 5.05 ± 0.43 | 1.76 ± 0.12 | 559.88 ± 47.52 | 28.67 ± 0.98 | 2.28 ± 0.32 | 9.23 ± 1.11 | 4.23 ± 1.45 | 0.89 ± 0.06 | 30.28 ± 3.95 |
| Male | ||||||||||
| D2 | 8 | 14.48 ± 1.50 | 4.00 ± 0.23 | 220.62 ± 17.37 | 35.60 ± 2.01 | 0.75 ± 0.31 | 4.01 ± 0.82 | 0.77 ± 0.31 | 0.65 ± 0.05 | 9.80 ± 2.59 |
| D3 | 6 | 11.05 ± 0.84 | 3.46 ± 0.18 | 261.28 ± 15.33 | 31.82 ± 1.23 | 1.25 ± 0.14 | 2.77 ± 0.32 | 0.53 ± 0.30 | 0.64 ± 0.04 | 6.27 ± 0.47 |
| Two-way ANOVA, P value | ||||||||||
| Sex | < .0001 | <.0001 | <.0001 | .0026 | .0051 | <.0001 | .0236 | <.0001 | <.0001 | |
| Diet | .0358 | .0170 | .0168 | .1905 | .6971 | .6892 | .6733 | .4706 | .4881 | |
| Sex × diet | .2624 | .6579 | .2338 | .2309 | .7868 | .4419 | .4005 | .2565 | .7711 |
Bold values show statistically significant changes. Abbreviations: BFR/BS, bone formation rate; ES/BS, eroded bone surface; MS/BS, mineralized bone surface; OS/BS, osteoid surface.
Figure 6.

Analysis of bone structure by μCT. A, Example μCT scans for week 16 male mice on D2 or D3 diets. B, Quantification of BV/TV, Tb.Th, Tb.N, and Tb.Sp in femurs from week 16 male and female mice. Data are mean (bar) of three left femurs. *, Statistically different (t test) from D3 mice (P < .05); **, P < .01.
Histomorphometric analyses for bone-resorbing osteoclasts (Oc) and bone-forming osteoblasts (Ob) was also carried out, as illustrated by the example femurs from week 8 female mice in shown in Figure 7. Quantitative analysis of these data using femur sections from week 8 and week 16 mice is shown in Table 2. In week 8 mice the primary factor influencing these markers was diet, with osteoclast number (N.Oc), osteoclasts per bone perimeter (N.Oc/B.Pm), number of osteoclasts per trabecular area, osteoclast surface per bone surface (Oc.S/BS), number of osteoblasts (N.Ob), number of osteoblasts per bone perimeter (N.Ob/B.Pm), number of osteoblasts per trabecular area (N.Ob/T.Ar), and osteoblast surface per bone surface (Ob.S/BS) being significantly affected by D2 vs D3 diet. In week 8 females, all of the Oc and Ob markers were higher in the D2 mice relative to D3. In week 8 males, Oc markers were also higher in D2 mice, but there was no significant effect on osteoblast markers in the D2 mice (Mann-Whitney, P = .33). At week 16, the D2 vs D3 diet had no significant effect on osteoclast and osteoblast markers, but, in common with week 8 mice, the sex of the animal was associated with variations in some makers, with N.Oc/B.Pm, Oc.S/BS, N.Ob, N.Ob/B.Pm, N.Ob/T.Ar, and Ob.S/BS being higher in males vs females.
Figure 7.
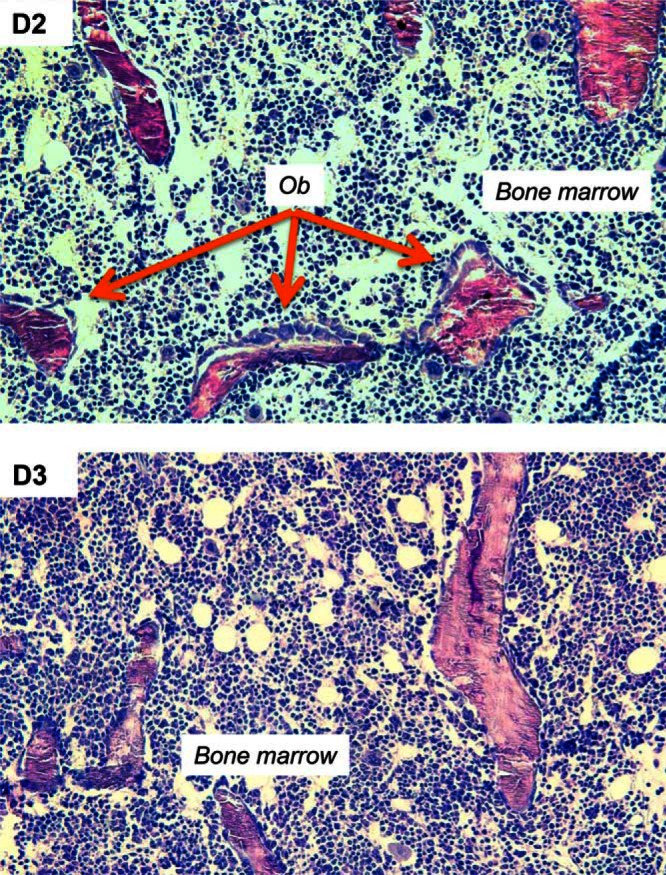
Oc and Ob markers in female mice on D2 and vitamin D diets at week 8 of age. Example images from bone histomorphometric analysis (magnification, ×200) of toluidine blue-stained femurs from week 8 female mice fed D2 and D3 diets.
Table 2.
Effect of D2 or D3 on Oc and Ob Indexes in Mice
| Age/Sex/Diet | n | N.Oc/B.Pm, n/μm | N.Oc, n | N.Oc/T.Ar, n/mm2 | Oc.S/BS, % | N.Ob/B.Pm, n/μm | N.Ob, n | N.Ob/T.Ar, n/mm2 | Ob.S/BS, % |
|---|---|---|---|---|---|---|---|---|---|
| Young mice (8 wk) | |||||||||
| Female | |||||||||
| D2 | 7 | 0.72 ± 0.09 | 8.71 ± 1.06 | 3.35 ± 0.43 | 1.84 ± 0.22 | 9.60 ± 1.65 | 117.57 ± 19.71 | 44.45 ± 7.09 | 13.41 ± 2.02 |
| D3 | 7 | 0.21 ± 0.03 | 2.00 ± 0.31 | 0.80 ± 0.12 | 0.55 ± 0.10 | 4.09 ± 0.77 | 44.29 ± 9.84 | 18.00 ± 4.11 | 5.47 ± 1.08 |
| Male | |||||||||
| D2 | 8 | 0.50 ± 0.08 | 9.75 ± 1.74 | 3.09 ± 0.54 | 1.58 ± 0.29 | 1.87 ± 0.29 | 35.37 ± 4.89 | 11.25 ± 1.56 | 2.82 ± 0.52 |
| D3 | 8 | 0.35 ± 0.05 | 7.13 ± 0.95 | 2.20 ± 0.29 | 0.98 ± 0.12 | 2.72 ± 0.38 | 54.50 ± 6.54 | 16.87 ± 2.10 | 3.69 ± 0.64 |
| Two-way ANOVA, P value | |||||||||
| Sex | .6134 | .0151 | <.0001 | .6908 | <.0001 | .0033 | .0003 | <.0001 | |
| Diet | <.0001 | .0005 | <.0001 | <.0001 | .0139 | .0223 | .0165 | .0051 | |
| Sex × diet | .0133 | .0959 | .0010 | .1043 | .0013 | .0003 | .0005 | .0007 | |
| Mature mice (16 wk) | |||||||||
| Female | |||||||||
| D2 | 6 | 0.44 ± 0.11 | 4.17 ± 0.95 | 1.42 ± 0.32 | 1.22 ± 0.31 | 4.28 ± 0.47 | 42.33 ± 5.62 | 14.49 ± 2.08 | 6.51 ± 0.59 |
| D3 | 8 | 0.38 ± 0.07 | 3.00 ± 0.58 | 1.04 ± 0.20 | 0.97 ± 0.25 | 3.95 ± 0.57 | 30.17 ± 4.03 | 10.71 ± 1.54 | 5.45 ± 0.88 |
| Male | |||||||||
| D2 | 8 | 0.14 ± 0.05 | 3.50 ± 1.23 | 1.11 ± 0.38 | 0.54 ± 0.19 | 0.48 ± 0.11 | 9.63 ± 2.15 | 3.11 ± 0.70 | 0.77 ± 0.17 |
| D3 | 6 | 0.20 ± 0.03 | 3.33 ± 0.49 | 1.07 ± 0.14 | 0.63 ± 0.08 | 0.86 ± 0.25 | 14.00 ± 3.88 | 4.67 ± 1.37 | 1.25 ± 0.45 |
| Two-way ANOVA, P value | |||||||||
| Sex | .0024 | .8458 | .6115 | .0346 | <.0001 | <.0001 | <.0001 | <.0001 | |
| Diet | .9852 | .4398 | .4598 | .7340 | .9816 | .2891 | .3717 | .5667 | |
| Sex × diet | .4052 | .5611 | .5406 | .4462 | .4393 | .0789 | .1075 | .2408 |
Bold values show statistically significant changes. Abbreviation: N.Oc/T.Ar, number of osteoclasts per trabecular area.
Discussion
The aim of the current study was to further analyze the impact of DBP on vitamin D bioavailability and physiology by generating an in vivo model in which the concentrations of free serum 25D were uncoupled from serum concentrations of total 25D. Previous studies have shown that Dbp knockout mice exhibit very low serum 25D and 1,25D due to elevated renal clearance of 25D and decreased conversion to 1,25D in proximal tubules (21). Despite this, they do not have an abnormal skeletal phenotype unless raised on a vitamin D-deficient diet (21). This has been attributed to the fact that although Dbp KO mice have low circulating levels of 25D and 1,25D, the bioactivity of these metabolites remains normal (30). Previous in vitro data from our group have shown that DBP acts to attenuate cellular responses to vitamin D metabolites, with monocytes cultured in serum from Dbp knockout mice showing more sensitive responses to 25D and 1,25D (16). Other studies have reported increased sensitivity to 1,25D in osteoblastic cells cultured in medium containing serum from Dbp knockout mice (30). Here we showed enhanced sensitivity to 25D2 relative to 25D3 in human osteoblastic MG63 cells but only in the presence of serum containing DBP. These data supported the central hypothesis of the current study that 25D2 binds to DBP with lower affinity than 25D3 and therefore exhibits greater bioavailability in the presence of DBP-containing serum. This was further endorsed by analysis of serum free 25D concentrations in D2 and D3 mice, in which free 25D was significantly higher in D2 vs D3 mice, despite both groups of animals having similar concentrations of total 25D and DBP at each time point.
Both the D2 and D3 forms of vitamin D are commonly used in human supplementation studies, but the relative efficacy of the two isoforms continues to be the subject of widespread debate. A recent systematic review and meta-analysis indicated that vitamin D3 was more effective in raising serum concentrations of 25D relative to vitamin D2 (31). Other studies have reported similar enhancement of serum 25D levels with vitamin D2 or vitamin D3 supplementation, but better maintenance of the resulting elevated serum 25D was achieved with D3 (32). A potential explanation for data from both of these studies is that the lower binding affinity of DBP for 25D2 relative to 25D3 (22–24) may impair availability of the 25D2-DBP complex for megalin-mediated glomerular reabsorption (12). This was not supported by data in the current study, in which there was no significant difference in serum total 25D concentrations for D2 vs D3 mice at wee k8 or week 16. However, there was a trend toward higher serum concentrations of 1,25D in D3 mice (although this was statistically significant only in week 8 male mice), suggesting a greater conversion rate of 25D3 to 1,25D3, relative to the rate of conversion of 25D2 to 1,25D2. Previous studies have shown that there is no preferential metabolism of 25D2 to 1,25D2 vs 25D3 to 1,25D3 (33), although, in contrast to the current study, this particular analysis involved human subjects with a combination of D2 and D3 circulating metabolites.
The elevation of serum 1,25D in week 16 D3 mice relative to D2 mice may occur through better recovery of substrate for the proximal tubule 1α-hydroxylase enzyme via megalin-mediated glomerular reabsorption of the 25D3-DBP complex (12). The difference does not appear to be due to differential kidney expression of the enzyme 1α-hydroxylase because an analysis of renal mRNA for Cyp27b1 showed no difference between D2 and D3 mice. In a similar fashion, the expression of renal mRNA for Cyp24a1 was not significantly different between D2 and D3 mice, suggesting that 25D2 and 25D3 were not subject to different levels of catabolism. Interestingly, in both D2 and D3 mice, the serum concentrations of 1,25D were significantly higher in week 16 vs week 8 mice. The mechanism for this is unclear and does not appear to be due to any age-related changes in the renal Cyp27b1 and/or Cyp24a1 expression.
The relative impact of 25D2 and 25D3 on serum concentrations of free 25D has been studied previously in human subjects supplemented with oral vitamin D2 or vitamin D3 at 1000 IU/d for 3 months (34). In this instance, the subjects receiving vitamin D3 showed higher circulating levels of 25D and 1,25D at the end of the study, consistent with the data presented here for D3 vs D2 mice. In contrast to mouse data in the current study, human subjects supplemented with D2 showed lower levels of free or bioavailable (non-DBP bound) 25D relative to those supplemented with vitamin D3, although this effect was lost when the data were adjusted for supplementation compliance (34). Other than species, the major difference between these two studies is that the mice described here received exclusively either D2 or D3 from weaning, and consequently, their circulating 25D was made up entirely of either 25D2 or 25D3. In humans supplemented with D2, a significant proportion of 25D is made up of endogenously synthesized 25D3 obtained from cutaneous synthesis of vitamin D3 and D3 from food fortification. It was also notable that the human cohort study outlined above (34) involved elderly hip fracture patients, who were assessed only for changes in serum calcium relative to free 25D. We did not measure serum calcium in the D2 or D3 mice. However, there was no significant difference in serum PTH levels between these mice, suggesting that differences in free 25D (at least at the levels found in these mice) is not a significant component of vitamin D-mediated regulation of parathyroid function and calcium homeostasis.
Although male and female D2 mice showed similar levels of total serum free 25D irrespective of age, the differential effects of 25D2 vs 25D3 were age and sex dependent. The selection of week 8 and week 16 ages for assessment of bone phenotype was intended to capture data from the C57BL/6 mice at different stages of bone development: 1) at a young adult stage (wk 8) when BV/TV is toward its peak; and 2) at a mature adult state (wk 16) when BV/TV begins to decline (35). At week 8, 25D2 was associated with enhanced osteoclastic and osteoblastic activity, but this effect was most pronounced in female mice. Temporal variations in bone development for male and female mice have been reported previously (35), and these observations may explain the differential effects of D2 and D3 demonstrated in the current study. Specifically, it is possible that Oc/Ob effects of free 25D are strongest in younger mice during active skeletal development, with these effects being lost later in life. This would also explain the stronger impact of D2 vs D3 in female mice, in which the changes in parameters of skeletal development tend to be slower than in male counterparts. In this setting, greater bioavailability of 25D2 may promote stronger effects in females relative to 25D3 because of generally higher bone cell activity at females at this age point. Because bone remodeling is the net effect of the activities of bone-forming and bone-resorbing cells, differences in bone structure will take longer to develop, and this may explain the significant differences in markers such as BV/TV, Tb.N, and Tb.Sp for D2 vs D3 at week 16 but not at week 8.
Variable responses to 25D2 and 25D3 may not be restricted to the skeleton because female D2 mice also exhibited differential effects on spleen gene expression and immune cell composition. Previous reports have shown that the spleen serves as a reservoir for monocyte/macrophage-lineage osteoclast precursors, which are generated and transferred to bone in response to diverse stimuli including vitamin D (36). Data presented here showed that the D2 diet was associated with higher mRNA expression levels of monocyte/macrophage-specific markers CD11b and RANKL and also changes in the total monocyte population within the spleen. Although further experiments must be completed to determine the specific cell subpopulations affected by D2 treatment, the results suggest a link between altered Ob/Oc markers in D2 vs D3 mice and the increase in osteoclast precursors markers in the spleen. Therefore, the spleen may be a target tissue for the enhanced levels of free 25D observed in D2 mice. Further in vivo studies using stimulated murine models will help elucidate whether these changes are more pronounced after an immune challenge.
Studies in human subjects have reported better correlation with serum free 25D relative to total serum 25D for bone mineral density in healthy subjects (37) and serum markers of mineral homeostasis in renal dialysis patients (38). However, these data have not been consistent, and recent data for bone density and mineral metabolism markers in healthy adults suggested that analysis of free 25D does not significantly improve correlations relative to conventional measurement of total serum (39). This may be due, in part, to existing strategies for calculating free or bioavailable 25D based on measurement of serum DBP levels, in which the discrepancies between ELISA analyses using monoclonal vs polyclonal antibodies have been described, particularly in the context of racial variations in the DBP phenotype (40). The advent of new assays for direct measurement of free 25D (41), as documented in the current study, has enabled a clearer appraisal of the functional impact of this form of vitamin D. To date, the measurement or estimation of free serum 25D concentrations has been primarily focused on parameters associated with classical skeletal actions of vitamin D. Although the data presented here support a role for free 25D in defining some parameters of skeletal function, it seems likely that extraskeletal tissues will also be important targets for free 25D. Previous studies in vitro (16, 42) and spleen analyses reported here suggest that cells from the immune system may be strongly influenced by 25D that is not bound to DBP. As such, it will be interesting in future studies to determine whether, relative to D3, D2 supports enhanced immunomodulatory actions, either in the form of enhanced antibacterial or antiinflammatory actions. Finally, it will be important in future studies to determine the extent to which variations in DBP binding affinity influence vitamin D metabolites other than 25D. This includes 1,25D, in which variations in the synthesis of the active form of vitamin D may play a key role in mediating both skeletal and extraskeletal responses.
Acknowledgments
We thank the following people for technical assistance in the different phases of this project: Emaad Farooqui and Niklas Eriksson in the MG63 quantitative PCR experiments and Timothy Lee and Kereat Grewal in the quantitative PCR experiments of the mouse kidney.
The opinions expressed in this paper are those of the authors and do not necessarily represent those of Merck Sharp & Dohme Corp.
This work was supported in part by National Institutes of Health grant 5R01 AR063910 and a research grant from the Investigator-Initiated Studies Program of Merck Sharp & Dohme Corp (Project IISP 51039).
Disclosure Summary: The authors have nothing to disclose.
Appendix
Table 3.
Antibody Table
| Peptide/Protein Target | Antigen Sequence (if Known) | Name of Antibody | Manufacturer, Catalog Number, and/or Name of Individual Providing the Antibody | Species Raised (Monoclonal or Polyclonal) | Dilution Used |
|---|---|---|---|---|---|
| CD45 | 30-F11 | BD Biosciences, 550994 | Rat monoclonal | 1:100 | |
| CD4 | RM4-5 | BD Biosciences, 553048 | Rat monoclonal | 1:100 | |
| CD8a | 53-6.7 | BD Biosciences, 553035 | Rat monoclonal | 1:100 | |
| B220 | RA3-6B2 | BD Biosciences, 558108 | Rat monoclonal | 1:100 | |
| NK1.1 | PK136 | BD Biosciences, 553164 | Mouse monoclonal | 1:250 | |
| CD11b | M1/70 | BD Biosciences, 553311 | Rat monoclonal | 1:100 | |
| CD3 | 17A2 | BD Biosciences, 555274 | Rat monoclonal | 1:250 | |
| F4/80 | BM8 | eBioscience, 11-4801-85 | Rat monoclonal | 1:100 |
For News & Views see page 3384
- BV/TV
- bone volume
- Ct
- cycle threshold
- μCT
- microcomputed tomography
- CYP27B1
- 1α-hydroxylase
- D2
- vitamin D2
- D3
- vitamin D3
- 25D
- 25-hydroxyvitamin D
- 1,25D
- 1,25-dihydroxyvitamin D
- DBP
- vitamin D binding
- HS
- human serum
- MAR
- mineral apposition rate
- NK
- natural killer
- N.Ob
- number of osteoblasts
- N.Ob/B.Pm
- number of osteoblasts per bone perimeter
- N.Ob/T.Ar
- number of osteoblasts per trabecular area
- N.Oc
- osteoclast number
- N.Oc/B.Pm
- osteoclasts per bone perimeter
- Ob
- osteoblast
- Ob.S/BS
- osteoblast surface per bone surface
- Oc
- osteoclast
- Oc.S/BS
- osteoclast surface per bone surface
- Tb.N
- trabecular number
- Tb.Sp
- trabecular spacing
- Tb.Th
- trabecular thickness
- VDR
- vitamin D receptor.
References
- 1. Holick MF. Vitamin D deficiency. N Engl J Med. 2007;357:266–281. [DOI] [PubMed] [Google Scholar]
- 2. Holick MF. Vitamin D status: measurement, interpretation, and clinical application. Ann Epidemiol. 2009;19:73–78. [DOI] [PMC free article] [PubMed] [Google Scholar]
- 3. Ross AC, Manson JE, Abrams SA, et al. The 2011 report on dietary reference intakes for calcium and vitamin D from the Institute of Medicine: what clinicians need to know. J Clin Endocrinol Metab. 2011;96:53–58. [DOI] [PMC free article] [PubMed] [Google Scholar]
- 4. Holick MF, Binkley NC, Bischoff-Ferrari HA, et al. Evaluation, treatment, and prevention of vitamin D deficiency: an Endocrine Society clinical practice guideline. J Clin Endocrinol Metab. 2011;96:1911–1930. [DOI] [PubMed] [Google Scholar]
- 5. Adams JS, Hewison M. Unexpected actions of vitamin D: new perspectives on the regulation of innate and adaptive immunity. Nat Clin Pract Endocrinol Metab. 2008;4:80–90. [DOI] [PMC free article] [PubMed] [Google Scholar]
- 6. Carlberg C, Seuter S. A genomic perspective on vitamin D signaling. Anticancer Res. 2009;29:3485–3493. [PubMed] [Google Scholar]
- 7. Spina CS, Tangpricha V, Uskokovic M, Adorinic L, Maehr H, Holick MF. Vitamin D and cancer. Anticancer Res. 2006;26:2515–2524. [PubMed] [Google Scholar]
- 8. Holick MF. Vitamin D: importance in the prevention of cancers, type 1 diabetes, heart disease, and osteoporosis. Am J Clin Nutr. 2004;79:362–371. [DOI] [PubMed] [Google Scholar]
- 9. Hewison M. Vitamin D and immune function: autocrine, paracrine or endocrine? Scand J Clin Lab Invest Suppl. 2012;243:92–102. [DOI] [PubMed] [Google Scholar]
- 10. Bikle DD, Gee E, Halloran B, Kowalski MA, Ryzen E, Haddad JG. Assessment of the free fraction of 25-hydroxyvitamin D in serum and its regulation by albumin and the vitamin D-binding protein. J Clin Endocrinol Metab. 1986;63:954–959. [DOI] [PubMed] [Google Scholar]
- 11. Bikle DD, Gee E, Halloran B, Haddad JG. Free 1,25-dihydroxyvitamin D levels in serum from normal subjects, pregnant subjects, and subjects with liver disease. J Clin Invest. 1984;74:1966–1971. [DOI] [PMC free article] [PubMed] [Google Scholar]
- 12. Nykjaer A, Dragun D, Walther D, et al. An endocytic pathway essential for renal uptake and activation of the steroid 25-(OH) vitamin D3. Cell. 1999;96:507–515. [DOI] [PubMed] [Google Scholar]
- 13. Nykjaer A, Fyfe JC, Kozyraki R, et al. Cubilin dysfunction causes abnormal metabolism of the steroid hormone 25(OH) vitamin D(3). Proc Natl Acad Sci USA. 2001;98:13895–13900. [DOI] [PMC free article] [PubMed] [Google Scholar]
- 14. Bouillon R, Van Assche FA, Van Baelen H, Heyns W, De Moor P. Influence of the vitamin D-binding protein on the serum concentration of 1,25-dihydroxyvitamin D3: significance of the free 1,25-dihydroxyvitamin D3 concentration. J Clin Invest. 1981;67:589–596. [DOI] [PMC free article] [PubMed] [Google Scholar]
- 15. Zehnder D, Bland R, Williams MC, et al. Extrarenal expression of 25-hydroxyvitamin D(3)-1α-hydroxylase. J Clin Endocrinol Metab. 2001;86:888–894. [DOI] [PubMed] [Google Scholar]
- 16. Chun RF, Lauridsen AL, Suon L, et al. Vitamin D-binding protein directs monocyte responses to 25-hydroxy- and 1,25-dihydroxyvitamin D. J Clin Endocrinol Metab. 2010;95:3368–3376. [DOI] [PMC free article] [PubMed] [Google Scholar]
- 17. Mendel CM. The free hormone hypothesis: a physiologically based mathematical model. Endocr Rev. 1989;10:232–274. [DOI] [PubMed] [Google Scholar]
- 18. Hammond GL. Access of reproductive steroids to target tissues. Obstet Gynecol Clin North Am. 2002;29:411–423. [DOI] [PubMed] [Google Scholar]
- 19. Chun RF, Peercy BE, Orwoll ES, Nielson CM, Adams JS, Hewison M. Vitamin D and DBP: the free hormone hypothesis revisited. J Steroid Biochem Mol Biol. 2014;144(Pt A):132–137. [DOI] [PMC free article] [PubMed] [Google Scholar]
- 20. Wang TJ, Zhang F, Richards JB, et al. Common genetic determinants of vitamin D insufficiency: a genome-wide association study. Lancet. 2010;376:180–188. [DOI] [PMC free article] [PubMed] [Google Scholar]
- 21. Safadi FF, Thornton P, Magiera H, et al. Osteopathy and resistance to vitamin D toxicity in mice null for vitamin D binding protein. J Clin Invest. 1999;103:239–251. [DOI] [PMC free article] [PubMed] [Google Scholar]
- 22. Belsey R, Clark MB, Bernat M, et al. The physiologic significance of plasma transport of vitamin D and metabolites. Am J Med. 1974;57:50–56. [DOI] [PubMed] [Google Scholar]
- 23. Jones G, Byrnes B, Palma F, Segev D, Mazur Y. Displacement potency of vitamin D2 analogs in competitive protein-binding assays for 25-hydroxyvitamin D3, 24,25-dihydroxyvitamin D3, and 1,25-dihydroxyvitamin D3. J Clin Endocrinol Metab. 1980;50:773–775. [DOI] [PubMed] [Google Scholar]
- 24. Hollis BW. Comparison of equilibrium and disequilibrium assay conditions for ergocalciferol, cholecalciferol and their major metabolites. J Steroid Biochem. 1984;21:81–86. [DOI] [PubMed] [Google Scholar]
- 25. Jones KS, Assar S, Harnpanich D, et al. 25(OH)D2 half-life is shorter than 25(OH)D3 half-life and is influenced by DBP concentration and genotype. J Clin Endocrinol Metab. 2014;99:3373–3381. [DOI] [PMC free article] [PubMed] [Google Scholar]
- 26. Houghton LA, Vieth R. The case against ergocalciferol (vitamin D2) as a vitamin supplement. Am J Clin Nutr. 2006;84:694–697. [DOI] [PubMed] [Google Scholar]
- 27. Liu NQ, Ouyang Y, Bulut Y, et al. Dietary vitamin D restriction in pregnant female mice is associated with maternal hypertension and altered placental and fetal development. Endocrinology. 2013;154:2270–2280. [DOI] [PubMed] [Google Scholar]
- 28. Parfitt AM, Drezner MK, Glorieux FH, et al. Bone histomorphometry: standardization of nomenclature, symbols, and units. Report of the ASBMR Histomorphometry Nomenclature Committee. J Bone Miner Res. 1987;2:595–610. [DOI] [PubMed] [Google Scholar]
- 29. Bouxsein ML, Boyd SK, Christiansen BA, Guldberg RE, Jepsen KJ, Muller R. Guidelines for assessment of bone microstructure in rodents using micro-computed tomography. J Bone Miner Res. 2010;25:1468–1486. [DOI] [PubMed] [Google Scholar]
- 30. Zella LA, Shevde NK, Hollis BW, Cooke NE, Pike JW. Vitamin D-binding protein influences total circulating levels of 1,25-dihydroxyvitamin D3 but does not directly modulate the bioactive levels of the hormone in vivo. Endocrinology. 2008;149:3656–3667. [DOI] [PMC free article] [PubMed] [Google Scholar]
- 31. Tripkovic L, Lambert H, Hart K, et al. Comparison of vitamin D2 and vitamin D3 supplementation in raising serum 25-hydroxyvitamin D status: a systematic review and meta-analysis. Am J Clin Nutr. 2012;95:1357–1364. [DOI] [PMC free article] [PubMed] [Google Scholar]
- 32. Oliveri B, Mastaglia SR, Brito GM, et al. Vitamin D3 seems more appropriate than D2 to sustain adequate levels of 25OHD: a pharmacokinetic approach. Eur J Clin Nutr. 2015;69:697–702. [DOI] [PubMed] [Google Scholar]
- 33. Hartwell D, Hassager C, Christiansen C. Effect of vitamin D2 and vitamin D3 on the serum concentrations of 1,25(OH)2D2, and 1,25(OH)2D3 in normal subjects. Acta Endocrinol. 1987;115:378–384. [DOI] [PubMed] [Google Scholar]
- 34. Glendenning P, Chew GT, Inderjeeth CA, Taranto M, Fraser WD. Calculated free and bioavailable vitamin D metabolite concentrations in vitamin D-deficient hip fracture patients after supplementation with cholecalciferol and ergocalciferol. Bone. 2013;56:271–275. [DOI] [PubMed] [Google Scholar]
- 35. Glatt V, Canalis E, Stadmeyer L, Bouxsein ML. Age-related changes in trabecular architecture differ in female and male C57BL/6J mice. J Bone Miner Res. 2007;22:1197–1207. [DOI] [PubMed] [Google Scholar]
- 36. Nakamichi Y, Mizoguchi T, Arai A, et al. Spleen serves as a reservoir of osteoclast precursors through vitamin D-induced IL-34 expression in osteopetrotic op/op mice. Proc Natl Acad Sci USA. 2012;109:10006–10011. [DOI] [PMC free article] [PubMed] [Google Scholar]
- 37. Powe CE, Ricciardi C, Berg AH, et al. Vitamin D-binding protein modifies the vitamin D-bone mineral density relationship. J Bone Miner Res. 2011;26:1609–1616. [DOI] [PMC free article] [PubMed] [Google Scholar]
- 38. Bhan I, Powe CE, Berg AH, et al. Bioavailable vitamin D is more tightly linked to mineral metabolism than total vitamin D in incident hemodialysis patients. Kidney Int. 2012;82:84–89. [DOI] [PMC free article] [PubMed] [Google Scholar]
- 39. Jemielita TO, Leonard MB, Baker J, et al. Association of 25-hydroxyvitamin D with areal and volumetric measures of bone mineral density and parathyroid hormone: impact of vitamin D-binding protein and its assays. Osteoporos Int. 2016;27(2):617–626. [DOI] [PMC free article] [PubMed] [Google Scholar]
- 40. Aloia J, Mikhail M, Dhaliwal R, et al. Free 25(OH)D and the vitamin D paradox in African Americans. J Clin Endocrinol Metab. 2015;100:3356–3363. [DOI] [PMC free article] [PubMed] [Google Scholar]
- 41. Schwartz JB, Lai J, Lizaola B, et al. A comparison of measured and calculated free 25(OH) vitamin D levels in clinical populations. J Clin Endocrinol Metab. 2014;99:1631–1637. [DOI] [PMC free article] [PubMed] [Google Scholar]
- 42. Jeffery LE, Wood AM, Qureshi OS, et al. Availability of 25-hydroxyvitamin D3 to APCs controls the balance between regulatory and inflammatory T cell responses. J Immunol. 2012;189:5155–5164. [DOI] [PMC free article] [PubMed] [Google Scholar]