

Abstract
Objectives
To assess associations of caesarean section with body mass from birth through adolescence.
Design
Longitudinal birth cohort study, following subjects up to 15 years of age.
Setting and Participants
Children born in 1991–1992 in Avon, UK who participated in the Avon Longitudinal Study of Parents and Children [ALSPAC] (n = 10,219).
Outcome measures
Primary outcome: standardized measures of body mass (weight-for length z-scores at 6 weeks, 10, and 20 months; and Body Mass Index [BMI] z-scores at 38 months, 7, 9, 11, and 15 years). Secondary outcome: Categorical overweight or obese (BMI >= 85th percentile) for age and gender, at 38 months, 7, 9, 11, and 15 years.
Results
Of the 10,219 children, 926 (9.06%) were delivered by caesarean section. Those born by caesarean had lower birth weights than those born vaginally (−46.1g, 95% CI: 14.6 to 77.6 g; p = 0.004). In mixed multivariable models adjusting for birth weight, gender, parental body mass, family sociodemographics, gestational factors and infant feeding patterns, caesarean delivery was consistently associated with increased adiposity, starting at six weeks (+0.11 SD units, 95% CI 0.03 to 0.18; p=0.005), through age 15 (BMI z-score increment + 0.10 SD units, 95% CI 0.001 to 0.198; p=0.042). By age 11 caesarean–delivered children had 1.83 times the odds of overweight or obesity (95% CI: 1.24 to 2.70; p=0.002). When the sample was stratified by maternal pre-pregnancy weight, the association among children born of overweight/obese mothers was strong and long-lasting. In contrast, evidence of an association among children born of normal weight mothers was weak.
Conclusion
Caesarean delivery is associated with increased body mass in childhood and adolescence. Research is needed to further characterize the association in children of normal weight women. Additional work is also needed to understand the mechanism underlying the association, which may involve relatively enduring changes in the intestinal microbiome.
Keywords: childhood obesity, adiposity, caesarean delivery, microbiome, ALSPAC
Caesarean section has enhanced and saved lives of mothers and infants worldwide, and is growing more prevalent in developing and middle-income countries. The World Health Organization estimates that caesarean rates in China are 25.9% and rising, already close to the US rate of 30.3%. In Brazil, the rate is 45.9%. This growth has been driven in part by financial incentives to providers, (1–4) as well as by patient preferences.(5, 6) The 2011 UK National Institute of Health and C linical Guidelines (NICE) guideline on caesarean delivery did not find risk for child health, and noted that women requesting caesarean section often believe that the procedure is “safest for the baby.”(7)
However, evidence suggests that caesarean delivery disrupts the normal bacterial colonization of the newborn. (8) During vaginal birth, the foetus is coated by and swallows bacterial strains from the maternal vaginal and gastrointestinal tracts.(8, 9) Children who are delivered by caesarean section miss this normal source of bacterial colonization. Their intestines are colonized by microbiota derived from contact with mothers’ skin, and from other sources.(10) The resulting differences in colonizing bacterial species for vaginally and operatively delivered children may persist at least into mid-childhood. (11–14) In light of evidence that experimentally induced changes in normal gut microbiota are associated with accelerated weight gain in laboratory animals, differences in founding microbial populations could affect adiposity among caesarean-delivered children.(15)
Studies of the association between mode of delivery and adiposity are challenging, since maternal factors that predispose to caesarean section also may cause greater childhood body mass. In addition, post partum behaviors (for example, breastfeeding) could mediate an association between caesarean delivery and adiposity. The few extant studies vary in inclusion criteria, availability of relevant clinical data, source and timing of information about child body mass, and the outcomes that are measured. (16–19) A recent meta-analysis found a moderate association between caesarean delivery and adiposity in childhood, adolescence and adulthood. (20) However, estimates of the magnitude of the association were quite variable. Some high-quality studies found no association, and effect estimates were lower for high quality studies.
In this report, we use objective measures of child height and weight collected over a span of 15 years in the Avon Longitudinal Study of Parents and Children (ALSPAC), a study that follows a large birth cohort. The ALSPAC data resource includes unusually detailed information on clinical, demographic, social, and behavioural characteristics of mothers and children that might be associated with mode of delivery and childhood obesity.
Methods
Study design, setting and participants
ALSPAC was started as a population-based study of pregnant women living in Avon, UK with expected dates of delivery in 1991 and 1992. While the timing of enrolment was variable, eighty-five percent of eligible births were captured in an area that is slightly more affluent than the general UK population.(21) Over time, data have been collected through review of hospital records, surveys of parents and children, and clinical and laboratory examination. For this study, we drew heavily on data abstracted from National Health Service obstetrical records by ALSPAC’s team of 6 trained research midwives.
From 14,541 “core” pregnancies, we excluded those that did not result in a live child at one year, non-singleton births, those with missing data on birth weight, and those contributing no data on child body mass after birth. We excluded children delivered at less than 37 weeks of gestation, since they are prone to caesarean delivery and atypical growth and development. We also confined our sample to children born of mothers without pre-existing diabetes, gestational diabetes, glycosuria in pregnancy, pre-existing hypertension or preeclampsia (based upon the research midwives’ reviews of the obstetrical notes) since these conditions are associated with caesarean delivery and may be associated with increased body mass. (22–24) As shown in the flow chart (Supplementary Exhibit 1) our final analytic sample included 10,219 mother-child pairs. Compared to the full ALSPAC cohort, sample mothers were more likely to be white and more highly educated.
Measures
Mode of delivery
Data on caesarean versus vaginal delivery was extracted from the obstetrical records by the research midwife team. In reviewing the obstetrical record, the midwife researchers also classified caesarean deliveries as “elective” if previously scheduled, and “emergency” if not. Mothers who had been scheduled for elective caesarean but who went into labour before their scheduled date were classified as having had an emergency caesarean.
Child body mass
Birth weight was extracted from the medical records and birth length was measured by an ALSPAC researcher. Subsequently, weight and length (or height, for older children) was measured by ALSPAC study personnel (in a random 10% subsample) and abstracted from health visitor records (in the remainder) at ages 6–8 weeks, 38–44 weeks (mean 10 months), 77–106 weeks (mean 20 months), and 38 months. Comparison of the two sources showed a high degree of agreement. (25) From age 7 years onward, height and weight were assessed by ALSPAC study personnel in clinic visits. Height was assessed using a Leicester Height Measure (Holten Crosswell, Dyfed), and weight measured using Tanita electronic scales, with children dressed in underwear.
For children up to two years of age, we transformed weight-for-length to standardised z-scores using the World Health Organization (WHO) Child Health Growth Standards developed from the 1997–2003 Multicentre Growth Reference Study. (26) For children older than two years, we transformed body mass index to standardised z-scores using US Centers for Disease Control and Prevention norms from the year 2000. (27, 28) We set body mass values equal to missing for fewer than 1% of the data points (≥5 or ≤−5 z-score or SD), since those values were likely to reflect errors in data recording. Our primary outcome was the age- and gender-standardised continuous measure (weight-for-length z-score at 6 weeks, 10 months, and 20 months; BMI z-score at age 38 months and at 7, 9, 11, and 15 years). The prevalence of obesity (BMI >= 95th percentile relative to norms) was quite low in the sample (2.8% at 7 years), and so our secondary outcome was categorical overweight overweight or obese (BMI >= 85th percentile for age and gender relative to the CDC norms; hereinafter “overweight/obese”) at 38 months and 7, 9, 11, and 15 years.
Mother’s pre-pregnancy BMI; father’s body mass
Shortly after recruitment into the study, mothers were sent a postal survey asking for their pre-pregnancy weight and height. These self-reports have been validated by ALSPAC investigators against obstetrical records of weight gain trajectory during pregnancy, and there is a high correlation between the self-reports and predicted pre-pregnancy weight (r=0.92). (29) Self-reports of pre-pregnancy height and weight were transformed to BMI in kg/m2. Father’s body mass was also self-reported through postal surveys. Both paternal and maternal BMI were categorized as normal (<25), overweight (BMI 25–29) and obese (BMI ≥30). In addition, maternal pre-pregnancy BMI was categorized into sample deciles in the multivariable analyses (see below).
Family sociodemographics
At enrolment, postal surveys elicited social class (using the UK Office of Population Census and Survey classifications)(30) and education (as defined by the UK Office of Qualifications and Examinations Regulation), (31) as well as race, which was re-classified into white and non-white, in this largely white population.
Gestational factors
Maternal age and parity were reported in the same postal survey, as was first trimester smoking (present or absent). Gestational weight gain was extracted from obstetrical records by the research midwife team, using methods described elsewhere (29) and categorized according to the 2009 US Institute of Medicine (IOM) recommendations (32) as: less than recommended, within the recommended range, and more than recommended.
Infant feeding
Feeding patterns were reported by postal survey at six months, and classified as “still breastfeeding,” “stopped breastfeeding,” and “never breastfed.” Timing of introduction of solid foods was classified as “0–2 months,” “3 months,” or “4 – 6 months.”
Statistical methods
Analytic approach
We characterized the sample by delivery status and body mass outcomes over time, and examined the associations between delivery mode and parental body mass, family sociodemographics, gestational factors and infant feeding, with chi-square tests of association. We tested the relationship between delivery mode (caesarean versus vaginal) and our primary (wfl/BMI z-score) and secondary outcome (overweight/obese) in mixed multivariable models of the whole sample that included subject-level random effects, and these fixed effects: birth weight as a continuous variable, gender, parental body mass (mother’s prenatal BMI in deciles, father normal weight/overweight/obese; both parents obese); family sociodemographics (maternal socioeconomic status and maternal education grouped as described above, white/non-white race); gestational factors (maternal age grouped as <20, 20–24, 25–29, 30–34, ≥35; parity grouped as 0 prior, 1 prior, 2 or more prior pregnancies; presence/absence of maternal smoking during the 1st trimester; gestational weight gain below, at or above the IOM recommendation, breastfeeding currently, formerly, never and introduction of solid foods at 1–2 months, 3 months, or 4–6 months). Linear random effects models were used to model wfl/BMI z-score and logistic random effects models were used to model overweight/obesity.
We used several strategies to control for the association between maternal adiposity and caesarean delivery risk. In addition to excluding children born to mothers with risks associated with caesarean delivery and/or childhood obesity, in our multivariable analysis we tested various specifications for maternal pre-pregnancy BMI, first with pre-pregnancy BMI z-score as a continuous variable, and then using BMI deciles. Results were comparable, and we report models using BMI deciles here. We also estimated the multivariable models in strata defined by maternal pre-pregnancy weight: normal (BMI <25) and overweight/obese (BMI ≥25). These stratified models were specified identically to the full sample models, except that they included deciles of maternal pre-pregnancy BMI within each stratum. As a further test for effect stratification, in full sample regression analyses, we added interaction terms of delivery mode and maternal pre-pregnancy BMI (categorized as normal versus overweight/obese). We did an omnibus test that the sum of the interactions over all time periods was equal to zero.
Finally, in further analyses, we re-categorized delivery mode to three values: (1) elective caesarean, (2) emergency caesarean, and (3) vaginal delivery, and re-examined the full sample multivariable associations between these three modes of delivery and our primary outcome. Because emergency caesarean section is more likely to be done for reasons unrelated to obesity risk (fetal distress, failure to progress), we hypothesised that compared to children delivered by elective caesarean section, those delivered emergently might have lower body mass. Also, because emergency caesarean may be started after the rupture of membranes (allowing exposure to the maternal bacterial microbiota), we hypothesised that children born by emergency caesarean might have body mass intermediate between those delivered vaginally and those delivered electively.
Approach to missing data
The ALSPAC study has enjoyed extraordinarily consistent response, due to community outreach and engagement with families in a region where the population has been quite stable.(33) For the serial measures of body mass, of the eight longitudinal data points, the mean number of time points measured was 5.2 per child. Between 40.7 and 86.9 percent of the sample contributed body mass data at any time point. There was no association between the propensity to contribute data and mode of delivery (mean number of data points = 5.23 for children delivered vaginally and 5.29 for children delivered by caesarean; p = .368). There was also no association between the propensity to contribute data at the last time point and mode of delivery (40.7% of those delivered vaginally contributing at 15 years, versus 40.8% of those delivered by caesarean; p = .941).
For some of the covariates used in our multivariable models, there were substantial missing data. For example, father’s BMI was missing for 33.4% of the sample, and maternal social class was missing for 21.4% of cases. Most other variables were missing in the 5–10% range. Consistent with prior ALSPAC analyses,(34) we created a missing category for each covariate.
As a test of robustness, we re-ran our main multivariable analysis with multiple imputation of the dependent variable, using Stata 12.0. Those results were essentially identical to the non-imputed analysis that we report here.
Human subjects
Ethical approval for the study was obtained from the ALSPAC Ethics and Law Committee and the Local Research Ethics Committees. Adult subjects gave informed consent, and children provided verbal assent when of age. This study was reviewed and approved by the IRBs at both the New York University Washington Square and Medical School campuses.
Results
The mean birth weight in the sample was 3,478 grams (SD 467), and 926 (9.06%) of the 10,219 children were delivered by caesarean section. Those born by caesarean delivery had lower birth weights than those born vaginally (−46.1g, 95% CI: 14.6 to 77.6 g); there were no differences in the two groups in weight-for-length z-score at birth (−.296 vs. −0.301; p =0.92). At age 7 years, 16.6% of the children were overweight or obese, and 2.8% met the criteria for obesity. In other words, adiposity was relatively rare, relative to the current prevalence in the US and UK populations. Table 1 shows body mass outcomes and numbers of observations available at each time point.
Table 1.
Characteristics of the sample: Delivery mode and body mass over time
| Characteristics | n1 | Mean (SD) or % |
|---|---|---|
| Delivered by caesarean section (%) | 10,219 | 9.06 |
| Emergency caesarean (%) | 10,219 | 5.38 |
| Elective caesarean (%) | 10,219 | 3.68 |
| Birth weight (g) | 10,219 | 3,478 ± 467 |
| Weight for length z score at 6 weeks | 8,883 | −0.55 ±1.23 |
| Weight for length z score at 10 months | 8,300 | 0.46 ± 1.03 |
| Weight for length z score at 20 months | 7,650 | 0.66 ± 1.02 |
| BMI z score at 38 months | 7,650 | 0.47 ± 1.04 |
| BMI z score at 7 years | 6,221 | 0.12 ± 0.95 |
| BMI z score at 9 years | 5,811 | 0.17 ± 0.99 |
| BMI z score at 11 years | 5,457 | 0.19 ±1.02 |
| BMI z score at 15 years | 4,156 | 0.17 ± 0.91 |
|
| ||
| Overweight/Obese at 38 months (%) | 7,060 | 30.5 |
| Overweight/Obese at 7 years (%) | 6,221 | 16.6 |
| Overweight/Obese at 9 years (%) | 5,811 | 20.6 |
| Overweight/Obese at 11 years (%) | 5,457 | 22.3 |
| Overweight/Obese at 15 years (%) | 4, 156 | 17.0 |
Statistics are derived from subjects with non-missing data at each time point.
Factors associated with mode of delivery
Mode of delivery was associated with several characteristics linked to childhood obesity (Table 2). Caesarean delivery was somewhat more common among children whose mothers were overweight or obese prior to pregnancy, whose parents were both obese, and non-white children. Children of older mothers were more likely to have been delivered by caesarean, as were firstborn children, and children whose mother’s gestational weight gain exceeded IOM recommendations. Caesarean delivery was associated with less breastfeeding and less early introduction of solid foods.
Table 2.
Characteristics of the sample by potential confounders, and comparison of subgroups by mode of delivery
| All | Vaginal delivery | Caesarean delivery | p-value* | ||
|---|---|---|---|---|---|
| (n = 10,219) | (n = 9,293) | (n = 926) | |||
| Characteristics | |||||
| Parental body mass | N | ||||
| Mother’s prenatal BMI | |||||
| Normal | 7603 | 74.4 | 75.3 | 65.2 | <0.001 |
| Overweight | 1397 | 13.7 | 13.3 | 17.2 | |
| Obese | 477 | 4.7 | 4.2 | 9.4 | |
| Missing | 742 | 7.3 | 7.2 | 8.2 | |
| Father’s BMI | |||||
| Normal | 4362 | 42.7 | 42.8 | 41.8 | 0.643 |
| Overweight | 2109 | 20.6 | 20.6 | 21.9 | |
| Obese | 335 | 3.3 | 3.2 | 3.7 | |
| Missing | 3413 | 33.4 | 33.5 | 32.6 | |
| Both parents obese | |||||
| No | 6330 | 61.9 | 62.0 | 61.8 | 0.031 |
| Yes | 44 | 0.4 | 0.4 | 1.0 | |
| Missing | 3845 | 37.6 | 37.7 | 37.3 | |
| Family sociodemographics | N | ||||
| Maternal SES | |||||
| I (highest) | 480 | 4.7 | 4.7 | 4.5 | 0.181 |
| II | 2542 | 24.9 | 24.6 | 27.2 | |
| III | 4082 | 40.0 | 40.0 | 39.1 | |
| IV | 765 | 7.5 | 7.5 | 7.3 | |
| V | 168 | 1.6 | 1.6 | 2.4 | |
| Missing | 2182 | 21.4 | 21.5 | 19.4 | |
| Education | |||||
| CSE/vocational | 2800 | 27.4 | 27.4 | 27.1 | 0.530 |
| O Level (n=3380) | 3380 | 33.1 | 33.3 | 31.2 | |
| A Level (n=2247) | 2247 | 22.0 | 21.8 | 23.5 | |
| Degree (n=1308) | 1308 | 12.8 | 12.8 | 12.7 | |
| Missing (n=484) | 484 | 4.7 | 4.7 | 5.4 | |
| Race/ethnicity | |||||
| White (n= 9481) | 9481 | 92.8 | 93.0 | 90.7 | 0.036 |
| Non-white (n= 210) | 210 | 2.1 | 2.0 | 2.8 | |
| Missing (n= 528) | 528 | 5.2 | 5.0 | 6.5 | |
| Gestational factors | N | ||||
| Maternal age | <0.001 | ||||
| <20 | 407 | 4.0 | 4.1 | 2.6 | |
| 20–24 | 1764 | 17.3 | 17.7 | 13.2 | |
| 25–29 | 4055 | 39.7 | 39.9 | 37.9 | |
| 30–34 | 2961 | 29.0 | 28.6 | 32.4 | |
| ≥35 | 1032 | 10.1 | 9.7 | 13.9 | |
| Parity | |||||
| 0 Prior | 4309 | 42.2 | 41.5 | 49.0 | <0.001 |
| 1 Prior | 3581 | 35.0 | 35.4 | 31.1 | |
| 2 Prior | 1393 | 13.6 | 13.7 | 12.7 | |
| 3 or more | 556 | 5.4 | 5.7 | 3.4 | |
| Missing | 380 | 3.7 | 3.7 | 3.8 | |
| Maternal smoking 1st trimester | |||||
| No | 7633 | 74.7 | 74.6 | 76.1 | 0.572 |
| Yes | 2376 | 23.3 | 23.4 | 21.9 | |
| Missing | 210 | 2.1 | 2.1 | 1.9 | |
| Gestational weight gain relative to IOM norms | |||||
| Below IOM norms | 3144 | 30.8 | 31.1 | 27.2 | <0.001 |
| At IOM norms | 3586 | 35.1 | 35.1 | 34.7 | |
| Above IOM norms | 2418 | 23.7 | 22.8 | 32.4 | |
| Missing | 1071 | 10.5 | 11.0 | 5.7 | |
| Infant feeding | N | ||||
| Breastfeeding at 6 months | |||||
| Still breastfeeding | 2713 | 26.6 | 27.0 | 22.6 | .018 |
| Had stopped | 4242 | 41.2 | 44.3 | 46.0 | |
| Never breastfed | 2086 | 20.5 | 20.1 | 18.8 | |
| Missing | 1178 | 11.5 | 11.4 | 13.1 | |
| Timing of introduction of solids | |||||
| 0 – 2 mo | 1429 | 14.0 | 14.3 | 10.6 | .013 |
| 3 mo | 5159 | 50.5 | 50.3 | 51.9 | |
| 4 – 6 mo | 2424 | 23.7 | 23.7 | 24.2 | |
| Missing | 1207 | 11.8 | 11.7 | 13.3 |
Notes: BMI, Body Mass Index; Social class assessed using the UK Office of Population Census and Survey classifications; Level of education assessed using the UK Office of Qualifications and Examinations Regulation (see text); IOM, Institute of Medicine.
p value for chi-square test of association between characteristic and mode of delivery.
Association between mode of delivery and body mass over time
There was a consistent association between mode of delivery and age- and gender-standardised body mass outcomes over time, in the multivariable analysis (Figure 1, Panel A). By 6 weeks of age, children delivered by caesarean section had significantly higher weight-for-length z-scores (+0.11 SD units, 95% CI 0.03 to 0.18; p=0.005), a difference that was still evident at age 15 (BMI z-score increment + 0.10 SD units, 95% CI 0.001 to 0.198; p=0.047). Estimates for increments at every time point can be found in Supplementary Exhibit 2A. Caesarean delivery also was associated with overweight/obesity, with a statistically significant increase through age 11 (overall sample prevalence of overweight/obese at 11 = 22.3%; adjusted odds ratio, or AOR = 1.83, 95% CI: 1.24 to 2.70; p=0.002; Table 3). In the multivariable models, factors other than caesarean delivery were also associated with greater body mass. While there was variation across models, associated variables included higher birth weight, being born of a young mother, greater maternal pre-pregnancy BMI, paternal overweight/obese, maternal smoking during the first trimester, less breastfeeding, and earlier introduction of solid foods (Supplementary Exhibit 2).
Figure 1. Association of delivery mode (caesarean vs. vaginal) and child’s body mass, ages 6 weeks to 15 years.

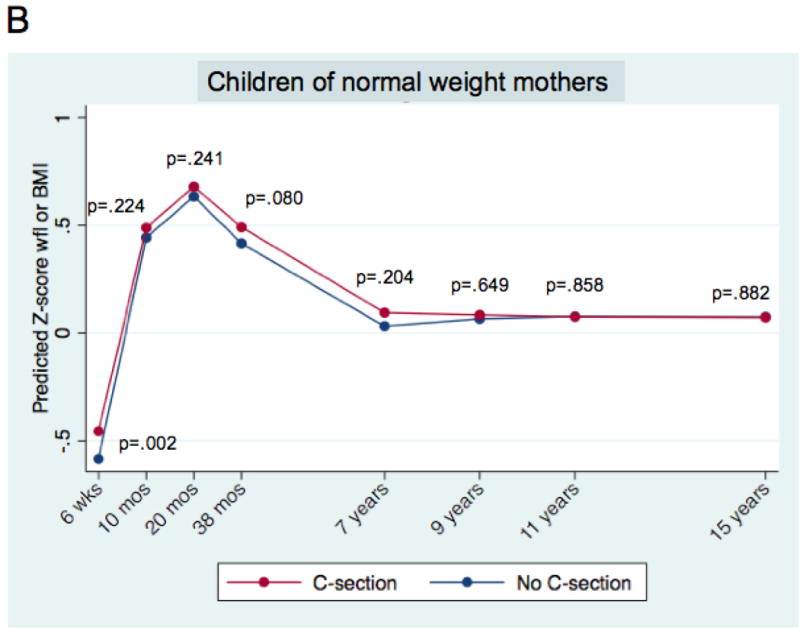
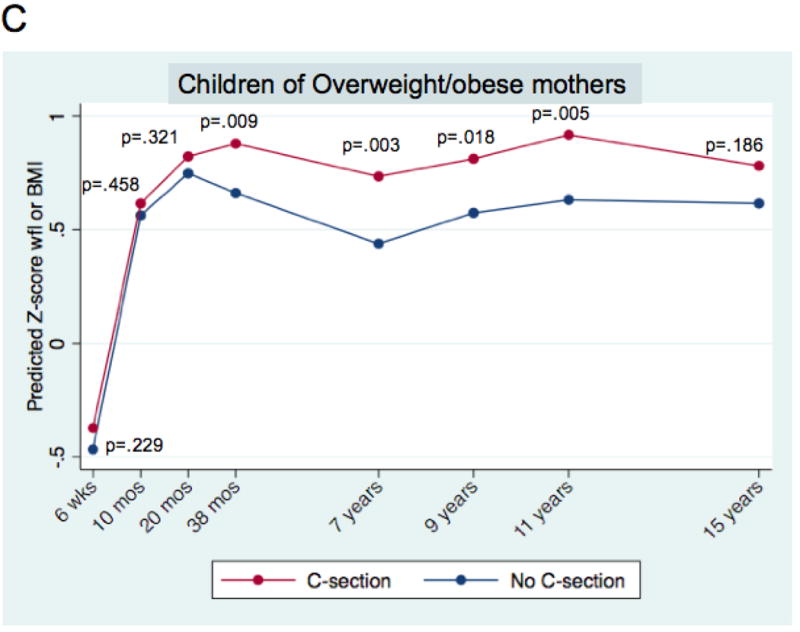
Mean predicted age- and sex-adjusted z-score weight-for-length (wfl) and Body Mass Index (BMI) for children born by caesarean section and vaginal delivery. Mean predicted values are derived from mixed multivariable models, as described in the text. P-values correspond to a two-tailed test of the difference of means for the modes of delivery, at each time point.
Panel A. All children; n = 10,219. Panel B. Children of normal weight mothers; n = 7,603. Panel C. Children of overweight/obese mothers; n =1,874. Panels B and C. Mothers with missing pre-pregnancy weights do not appear.
Table 3. Association between mode of delivery and body mass outcome (Overweight/obese).
All children; children of normal weight mothers; children of overweight/obese mothers.
| Body mass outcome | Time period | All children | Children of normal weight mothers (BMI < 25) | Children of overweight/obese mothers (BMI ≥ 25) | |||
|---|---|---|---|---|---|---|---|
| Mode of delivery | Mode of delivery | Mode of delivery | |||||
| Caesarean | Vaginal | Caesarean | Vaginal | Caesarean | Vaginal | ||
| Child | 38 months | 1.29 (0.92,1.80) | 1.00 (ref) | 1.02 (0.68,1.54) | 1.00 (ref) | 2.13 (1.09,4.18)* | 1.00 (ref) |
| Overweight/obese (z-BMI ≥1.04) | 7 years | 1.77 (1.20,2.62)** | “ | 1.36 (0.82,2.25) | “ | 2.62 (1.27,5.41)** | “ |
| 9 years | 1.49 (1.01,2.20)* | “ | 1.27 (0.77,2.10) | “ | 1.62 (0.78,3.37) | “ | |
| 11 years | 1.83 (1.24,2.70)** | “ | 1.44 (0.87,2.36) | “ | 2.11 (1.01,4.39)* | “ | |
| 15 years | 1.11 (0.70,1.78) | “ | 0.69 (0.36,1.32) | “ | 1.92 (0.84,4.38) | “ | |
= p < .05;
= p < .10
Odds ratios are derived from multivariable mixed effects models with subject-level random effects, using logistic regression. Models were run for the outcome “child is overweight/obese”, within each of the three groups (all, children of normal weight mothers, and children of overweight/obese mothers). Models for all children include birth weight, sex, and the variables listed in Table 1, with maternal pre-pregnancy BMI z-score in deciles. Models for the two subgroups include the same variables, with maternal BMI z-score decile assigned within the subgroup.
Association in strata defined by maternal pre-pregnancy weight
For children of normal weight mothers, the increment in BMI z-score associated with caesarean delivery was consistently positively signed but of a qualitatively smaller magnitude than in the full sample, and generally fell short of statistical significance (Figure 1, Panel B). In contrast, for children of overweight/obese mothers, the association was qualitatively larger and more consistently statistically significant (Figure 1, Panel C). The apparent duration of association was different for the two groups, with children of overweight/obese mothers showing statistically significant increases in z-score body mass through age 11 (+0.25 SD units, 95% CI 0.08 to 0. 43; p=0.005; Figure 1, Panel C). An omnibus test of interaction was consistent with a difference in the association between the two pre-pregnancy weight subgroups (p = .004). Supplementary Exhibit 2A shows z-score increments for each time point, for the two pre-pregnancy weight strata.
Stratified analysis of the secondary outcome (overweight/obesity) showed a similar pattern (Table 3). For children of normal weight mothers, the association was generally positive, but consistently fell short of statistical significance. Among children of overweight/obese mothers, the magnitude of the association was larger and more consistently significant. An omnibus test of the interaction fell short of statistical significance (p = .059).
Elective versus emergency caesarean
Children born by elective caesarean had lower mean birth weights than those born by emergency caesarean or vaginal delivery (3360 vs 3488 vs 3482 g, p >.001 for both post-hoc tests of differences between elective caesarean and other groups; p >.10 for other differences). However, at birth, electively sectioned children had greater mean z-score weights-for-length (−.166 SD vs −.386 SD vs .301 SD for elective caesarean vs. emergency caesarean vs. vaginal delivery; p = .023 for elective versus emergency section; p > .10 for the other comparisons).
Figure 2 shows multivariable predicted z-score body mass over time, when delivery mode was categorized in three values: (1) elective caesarean, (2) emergency caesarean, and (3) vaginal delivery body mass. For all time periods, z-scores were qualitatively lowest for children born vaginally, and for most time periods, highest for children undergoing elective caesarean (see Supplementary Exhibit 3 for z-score increments at each time point).
Figure 2. Association of delivery mode (elective caesarean vs emergency caesarean vs vaginal) and body mass, ages 6 weeks to 15 years.

Mean predicted age- and sex-adjusted z-score weight-for-length (wfl) and Body Mass Index (BMI) for children born by elective caesarean section, emergency caesarean section, and vaginal delivery. Mean predicted values are derived from mixed multivariable models, as described in the text. P-values correspond to two-tailed tests of the difference of means for each of the two modes of caesarean delivery, versus vaginal delivery, at each time point. The upper value is for elective caesarean versus vaginal delivery, and the lower value is for emergency caesarean section.
Discussion
In this sample of full-term children born in the UK in the early 1990s, caesarean delivery was associated with increased body mass from infancy through adolescence. At birth, children delivered vaginally were slightly heavier, and there was no difference in z-score weight-for-length between the two groups. However, by 6 weeks, those born by caesarean had greater standardised body mass, and this persisted until age 15, in analyses adjusted for birth weight, gender, parental body mass, sociodemographic factors, and a set of gestational factors related to obesity risk. Overweight/obesity was also more common among children delivered by caesarean.
Evidence of the association was more robust, qualitatively greater, and longer lasting among children born of overweight/obese mothers, compared to children born of normal weight mothers. The reason for this difference by maternal pre-pregnancy weight is unclear. The genetic characteristics or gestational exposures of children of overweight/obese mothers may make them less able to recover from whatever risk for obesity is conferred by caesarean delivery. Alternatively, the difference in the two groups may reflect residual confounding by unmeasured obesity risk, which could be greater among children born of overweight/obese mothers. This important question bears further study.
Strengths and limitations of the study
Our longitudinal design with repeated objective measures of body mass is comparatively strong, relative to studies using a single cross section. The greatest limitation is the possibility of unmeasured confounders that are associated with caesarean delivery and adiposity in infancy, childhood and adolescence. We used several strategies to minimize this, but we cannot rule out the possibility of residual confounding.
Our analysis was also limited by sample size. Our findings support an association between caesarean section in the population at large, and among children born of overweight/obese mothers. However, as we have noted, our conclusions are more tentative for children of normal weight mothers, among whom the association appears to be weaker. For those children, we estimate that we only had a 51% chance of detecting a very small (0.1 z-score) increment in BMI at age 7.
Missing data pose a third limitation to the study. Subjects were followed for 15 years, and some subjects invariably missed some measurement points, which could have introduced bias into our estimates. However, since we estimate an association (rather than a prevalence), this may be less of a concern. (35) Also reassuring was the lack of an association between response propensity and delivery mode. Finally, we confirmed our main analyses using multiple imputation, and the associations were essentially unchanged.
Strengths and limitations in the context of previous studies
Our findings are consistent with the theory that caesarean delivery leads to increased adiposity, which may be through disruption of the gut microbiome. (36) Generally, we found that later life adiposity is least likely among children who are born vaginally, slightly more likely among those delivered via emergency caesarean, and most likely among children delivered by elective caesarean. This gradient corresponds to the likelihood that children were exposed to maternal vaginal bacteria during birth. However, when our sample was divided into elective and emergent caesareans, the numbers become too small to detect differences.
Our finding of a positive association between delivery mode and adiposity is consistent with a meta-analysis that recently appeared in this journal. Several of the key studies summarized in that meta-analysis differ from ours, in terms of the clinical inclusion criteria, incidence of caesarean section in the sample, the prevalence of adiposity in the children, and/or the outcomes reported. Two were high-quality studies that failed to find a significant association between delivery mode and adiposity. The first, an analysis of the Danish National Birth Cohort (DNBC), found no association between caesarean delivery and overweight at age 7 years.(16) In the DNBC cohort, the unadjusted association with overweight was quite small at age 7 (OR = 1.15, 95% CI: 1.02 to 1.29; p = 0.015) relative to the larger unadjusted association in our sample (OR = 1.90, 95% CI: 1.25–2.90, p=0.003). This discrepancy could reflect differences in the body mass distributions in the two populations: the children in the Danish cohort were extraordinarily lean (Danish obesity prevalence at 7 years was 1.6% among girls and 1.1% among boys; in the ALSPAC cohort, 2.8% among all children age 7). A birth cohort study from Brazil, (17) found a crude association between delivery mode and obesity that was no longer statistically significant after adjusting for an array of gestational, and behavioural factors. However, the outcome for that study, obesity, was relatively rare in absolute terms (between 7 and 15 percent, depending on cohort and time point). Using the more common outcome of overweight/obese might have yielded a statistically significant positive association in their sample, as it did in ours. Of note, when we used obesity as an outcome in our data, our adjusted findings were quite similar to those from Brazil, with positive estimates that fell short of statistical significance (analysis not shown).
Generalizing from this study
The ALSPAC data were collected in an era predating the routine use of intravenous antibiotic prophylaxis with caesarean delivery.(37) Our analysis of data on administration of antibiotics in labour showed that under 6% of the ALSPAC mothers who underwent caesarean received prophylaxis. Early life antibiotic exposure disrupts the developing intestinal microbiome and causes increased adiposity in laboratory animals.(15) Two recent studies have found an association between early antibiotic exposure and subsequent childhood adiposity.(16, 38) Since contemporary guidelines for caesarean delivery recommend IV antibiotics at the time of incision, (7) under current practices, caesarean section may be doubly disruptive of microbiome development in the neonate.
The children in our sample were born over two decades ago. Since then, obesity has increased worldwide, and caesarean section rates are on the rise. If caesarean delivery is obesogenic (and not just associated with obesity), then reducing the rate of elective caesarean sections could be an important strategy for reducing childhood obesity. While stronger evidence of causality awaits further detailed clinical studies, that research will likely take years to complete.
Avenues for future research
The association identified here raises a number of questions. More detailed study remains, for the children of normal weight mothers. Further work is needed to assess the association in other populations, with rigorous control for confounding. Research is needed to understand the mechanisms that link caesarean delivery to adiposity. For example, more studies of the differences in the development of gut microbiota between children delivered by caesarean and children delivered vaginally should be done.
On the clinical side, the cardiometabolic profiles of children born by caesarean section. should be investigated. (39) Ultimately, identification of subgroups at high risk for adiposity as a result of caesarean might help in clinical decision-making regarding delivery mode, and advice given to prospective parents. In sum, the evidence presented here – along with work by bench scientists and epidemiologists – suggests that we look further at the consequences of caesarean delivery, a mode of birth that has emerged so recently in the course of human evolution.
Acknowledgments
We are extremely grateful to all the families who took part in this study, the midwives for their help in recruiting them, and the whole ALSPAC team, which includes interviewers, computer and laboratory technicians, clerical workers, research scientists, volunteers, managers, receptionists and nurses. The UK Medical Research Council, the Wellcome Trust (Grant ref: 092731) and the University of Bristol provide core support for ALSPAC. This publication is the work of the authors and Drs. Blustein and Trasande will serve as guarantors for the contents of this paper and does not reflect the views of the ALSPAC executive.
Additional financial support was provided through a pilot grant from the NYU Global Public Health Research Challenge Fund, by NIH grants RO1DK090989 and 1UL1RR029893, and by the Diane Belfer Program in Human Microbial Ecology
Footnotes
Competing interest. All authors have completed the Unified Competing Interest form at www.icmje.org/coi_disclosure.pdf (available on request from the corresponding author) and declare: all authors had financial support from the NYU Global Public Health Research Fund for the submitted work, and MJB/LMK had financial support from the National Institutes of Health [NIH], as described in the acknowledgements and the Diane Belfer Program in Human Microbial Ecology; no financial relationships with any organisations that might have an interest in the submitted work in the previous 3 years; no other relationships or activities that could appear to have influenced the submitted work.
Data sharing statement. The authors were granted access to the ALSPAC data through an agreement with the University of Bristol, and are not authorized to share data with other investigators.
Supplementary information is available at IJO’s website.
Contributor Information
Jan Blustein, Professor of Health Policy, Medicine, and Population Health. New York University Wagner School of Public Service, 295 Lafayette St., New York, NY 10012 USA and NYU Medical School, NY NY 10032.
Teresa Attina, Email: Teresa.attina@nyumc.org, Research Scientist, Department of Pediatrics, NYU Medical School.
Mengling Liu, Email: mengling.liu@nyumc.org, Associate Professor of Population Health, NYU Medical School.
Andrew M. Ryan, Email: amr2015@med.cornell.edu, Assistant Professor of Public Health, Weill-Cornell Medical School.
Laura M. Cox, Email: laura.cox@nyumc.org, Doctoral Student, Department of Microbiology, NYU Medical School.
Martin J. Blaser, Email: martin.blaser@nyumc.org, Professor and Chair, Department of Medicine, NYU Medical School.
Leonardo Trasande, Email: Leonardo.trasande@nyumc.org, Associate Professor of Pediatrics, Environmental Medicine, and Public Policy.
References
- 1.Keeler EB, Brodie M. Economic incentives in the choice between vaginal delivery and cesarean section. Milbank Q. 1993;71:365–404. [PubMed] [Google Scholar]
- 2.Lauer JA, Betran AP, Merialdi M, Wojdyla D. Determinants of caesarean section rates in developed countries: supply, demand and opportunities for control. 2010 Available at http://www.who.int/healthsystems/topics/financing/healthreport/29DeterminantsC-section.pdf (Accessed 2 July 2012)
- 3.Niino Y. The increasing cesarean rate globally and what we can do about it. Biosci Trends. 2011;5:139–150. doi: 10.5582/bst.2011.v5.4.139. [DOI] [PubMed] [Google Scholar]
- 4.Yang YT, Mello MM, Subramanian SV, Studdert DM. Relationship between malpractice litigation pressure and rates of cesarean section and vaginal birth after cesarean section. Med Care. 2009;47:234–242. doi: 10.1097/MLR.0b013e31818475de. [DOI] [PMC free article] [PubMed] [Google Scholar]
- 5.National Institutes of Health. State-of-the-Science Conference Statement: Cesarean Delivery on Maternal Request March 27–29, 2006. Obestrics & Gynecology. 107:1386–1397. [PubMed] [Google Scholar]
- 6.Fuglenes D, Aas E, Botten G, Oian P, Kristiansen IS. Why do some pregnant women prefer cesarean? The influence of parity, delivery experiences, and fear. Am J Obstet Gynecol. 2011;205:45 e41–49. doi: 10.1016/j.ajog.2011.03.043. [DOI] [PubMed] [Google Scholar]
- 7.National Institute for Health and Clinical Excellence (NICE) Caesarean section (update). (Clinical guideline 132) 2011 http://guidance.nice.org.uk/CG132. [PubMed]
- 8.Dominguez-Bello MG, Costello EK, Contreras M, Magris M, Hidalgo G, Fierer N, et al. Delivery mode shapes the acquisition and structure of the initial microbiota across multiple body habitats in newborns. Proc Natl Acad Sci U S A. 2010;107:11971–11975. doi: 10.1073/pnas.1002601107. [DOI] [PMC free article] [PubMed] [Google Scholar]
- 9.Huurre A, Kalliomaki M, Rautava S, Rinne M, Salminen S, Isolauri E. Mode of delivery – effects on gut microbiota and humoral immunity. Neonatology. 2008;93:236–240. doi: 10.1159/000111102. [DOI] [PubMed] [Google Scholar]
- 10.Dominguez-Bello MG, Costello EK, Contreras M, Magris M, Hidalgo G, Fierer N, et al. Delivery mode shapes the acquisition and structure of the initial microbiota across multiple body habitats in newborns. Proceedings of the National Academy of Sciences. 2010;107:11971–11975. doi: 10.1073/pnas.1002601107. [DOI] [PMC free article] [PubMed] [Google Scholar]
- 11.Koenig JE, Spor A, Scalfone N, Fricker AD, Stombaugh J, Knight R, et al. Succession of microbial consortia in the developing infant gut microbiome. Proceedings of the National Academy of Sciences. 2010 doi: 10.1073/pnas.1000081107. [DOI] [PMC free article] [PubMed] [Google Scholar]
- 12.Palmer C, Bik EM, DiGiulio DB, Relman DA, Brown PO. Development of the Human Infant Intestinal Microbiota. PLoS Biol. 2007;5:e177. doi: 10.1371/journal.pbio.0050177. [DOI] [PMC free article] [PubMed] [Google Scholar]
- 13.Penders J, Thijs C, Vink C, Stelma FF, Snijders B, Kummeling I, et al. Factors Influencing the Composition of the Intestinal Microbiota in Early Infancy. Pediatrics. 2006;118:511–521. doi: 10.1542/peds.2005-2824. [DOI] [PubMed] [Google Scholar]
- 14.Salminen S, Gibson GR, McCartney AL, Isolauri E. Influence of mode of delivery on gut microbiota composition in seven year old children. Gut. 2004;53:1388–1389. doi: 10.1136/gut.2004.041640. [DOI] [PMC free article] [PubMed] [Google Scholar]
- 15.Cho I, Yamanishi S, Cox L, Methe BA, Zavadil J, Li K, et al. Antibiotics in early life alter the murine colonic microbiome and adiposity. Nature. 2012;488:621–626. doi: 10.1038/nature11400. [DOI] [PMC free article] [PubMed] [Google Scholar]
- 16.Ajslev TA, Andersen CS, Gamborg M, Sorensen TI, Jess T. Childhood overweight after establishment of the gut microbiota: the role of delivery mode, pre-pregnancy weight and early administration of antibiotics. Int J Obes (Lond) 2011;35:522–529. doi: 10.1038/ijo.2011.27. [DOI] [PubMed] [Google Scholar]
- 17.Barros FC, Matijasevich A, Hallal PC, Horta BL, Barros AJ, Menezes AB, et al. Cesarean section and risk of obesity in childhood, adolescence, and early adulthood: evidence from 3 Brazilian birth cohorts. Am J Clin Nutr. 2012;95:465–470. doi: 10.3945/ajcn.111.026401. [DOI] [PMC free article] [PubMed] [Google Scholar]
- 18.Goldani HA, Bettiol H, Barbieri MA, Silva AA, Agranonik M, Morais MB, et al. Cesarean delivery is associated with an increased risk of obesity in adulthood in a Brazilian birth cohort study. Am J Clin Nutr. 2011;93:1344–1347. doi: 10.3945/ajcn.110.010033. [DOI] [PubMed] [Google Scholar]
- 19.Huh SY, Rifas-Shiman SL, Zera CA, Edwards JW, Oken E, Weiss ST, et al. Delivery by caesarean section and risk of obesity in preschool age children: a prospective cohort study. Arch Dis Child. 2012;97:610–616. doi: 10.1136/archdischild-2011-301141. [DOI] [PMC free article] [PubMed] [Google Scholar]
- 20.Li HT, Zhou YB, Liu JM. The impact of cesarean section on offspring overweight and obesity: a systematic review and meta-analysis. International Journal of Obesity. 2012:1–7. doi: 10.1038/ijo.2012.1195. [DOI] [PubMed] [Google Scholar]
- 21.Golding J, Pembrey M, Jones R. ALSPAC–the Avon Longitudinal Study of Parents and Children. I. Study methodology. Paediatr Perinat Epidemiol. 2001;15:74–87. doi: 10.1046/j.1365-3016.2001.00325.x. [DOI] [PubMed] [Google Scholar]
- 22.Bragg F, Cromwell DA, Edozien LC, Gurol-Urganci I, Mahmood TA, Templeton A, et al. Variation in rates of caesarean section among English NHS trusts after accounting for maternal and clinical risk: cross sectional study. BMJ. 2010;341:c5065. doi: 10.1136/bmj.c5065. [DOI] [PMC free article] [PubMed] [Google Scholar]
- 23.Castro LC, Avina RL. Maternal obesity and pregnancy outcomes. Curr Opin Obstet Gynecol. 2002;14:601–606. doi: 10.1097/00001703-200212000-00005. [DOI] [PubMed] [Google Scholar]
- 24.Hillier TA, Pedula KL, Schmidt MM, Mullen JA, Charles MA, Pettitt DJ. Childhood obesity and metabolic imprinting: the ongoing effects of maternal hyperglycemia. Diabetes Care. 2007;30:2287–2292. doi: 10.2337/dc06-2361. [DOI] [PubMed] [Google Scholar]
- 25.Howe LD, Tilling K, Lawlor DA. Accuracy of height and weight data from child health records. Arch Dis Child. 2009;94:950–954. doi: 10.1136/adc.2009.162552. [DOI] [PubMed] [Google Scholar]
- 26.de Onis M, WHO Multicentre Growth Reference Study Group WHO Child Growth Standards based on length/height, weight and age. Acta Paediatrica. 2006;95:76–85. doi: 10.1111/j.1651-2227.2006.tb02378.x. [DOI] [PubMed] [Google Scholar]
- 27.Grummer-Strawn LM, Reinold C, Krebs NF. Use of World Health Organization and CDC growth charts for children aged 0–59 months in the United States. MMWR Recomm Rep. 2010;59:1–15. [PubMed] [Google Scholar]
- 28.Ogden CL, Kuczmarski RJ, Flegal KM, Mei Z, Guo S, Wei R, et al. Centers for Disease Control and Prevention 2000 growth charts for the United States: improvements to the 1977 National Center for Health Statistics version. Pediatrics. 2002;109:45–60. doi: 10.1542/peds.109.1.45. [DOI] [PubMed] [Google Scholar]
- 29.Fraser A, Tilling K, Macdonald-Wallis C, Hughes R, Sattar N, Nelson SM, et al. Associations of gestational weight gain with maternal body mass index, waist circumference, and blood pressure measured 16 y after pregnancy: the Avon Longitudinal Study of Parents and Children (ALSPAC) Am J Clin Nutr. 2011;93:1285–1292. doi: 10.3945/ajcn.110.008326. [DOI] [PMC free article] [PubMed] [Google Scholar]
- 30.OPCS Standard Occupational Classification. Vol. 3. London: HMSO; 1991. [Google Scholar]
- 31.Office of Qualifications and Examinations Regulations. Explaining the National Qualifications Framework. Available at http://www.ofqual.gov.uk/ (Accessed 23 December 2011)
- 32.US Institute of Medicine. Weight Gain During Pregnancy: Reexaming the Guidelines. 2009 Available at http://www.iom.edu/Reports/2009/Weight-Gain-During-Pregnancy-Reexamining-the-Guidelines.aspx.
- 33.Golding J, Pembrey M, Jones R. ALSPAC-the Avon longitudinal study of parents and children. I. Study methodology. Paediatric and Perinatal Epidemiology. 2001;15:74–87. doi: 10.1046/j.1365-3016.2001.00325.x. [DOI] [PubMed] [Google Scholar]
- 34.Reilly JJ, Armstrong J, Dorosty AR, Emmett PM, Ness A, Rogers I, et al. Early life risk factors for obesity in childhood: cohort study. BMJ. 2005;330:1357. doi: 10.1136/bmj.38470.670903.E0. [DOI] [PMC free article] [PubMed] [Google Scholar]
- 35.Wolke D, Waylen A, Samara M, Steer C, Goodman R, Ford T, et al. Selective drop-out in longitudinal studies and non-biased prediction of behaviour disorders. Br J Psychiatry. 2009;195:249–256. doi: 10.1192/bjp.bp.108.053751. [DOI] [PMC free article] [PubMed] [Google Scholar]
- 36.Cho I, Blaser MJ. The human microbiome: at the interface of health and disease. Nat Rev Genet. 2012;13:260–270. doi: 10.1038/nrg3182. [DOI] [PMC free article] [PubMed] [Google Scholar]
- 37.Mugford M, Kingston J, Chalmers I. Reducing the incidence of infection after caesarean section: implications of prophylaxis with antibiotics for hospital resources. BMJ. 1989;299:1003–1006. doi: 10.1136/bmj.299.6706.1003. [DOI] [PMC free article] [PubMed] [Google Scholar]
- 38.Trasande L, Blustein J, Liu M, Corwin E, Cox LM, Blaser MJ. Infant antibiotic exposures and early-life body mass. Int J Obes (Lond) 2012 doi: 10.1038/ijo.2012.132. [DOI] [PMC free article] [PubMed] [Google Scholar]
- 39.Friedemann C, Heneghan C, Mahtani K, Thompson M, Perera R, Ward AM. Cardiovascular disease risk in healthy children and its association with body mass index: systematic review and meta-analysis. BMJ. 2012;345:e4759. doi: 10.1136/bmj.e4759. [DOI] [PMC free article] [PubMed] [Google Scholar]