

Abstract
The mammalian diffuse stellate cell system comprises retinoid-storing cells capable of remarkable transformations from a quiescent to an activated myofibroblast-like phenotype. Activated pancreatic stellate cells (PSCs) attract attention owing to the pivotal role they play in development of tissue fibrosis in chronic pancreatitis and pancreatic cancer. However, little is known about the actual role of PSCs in the normal pancreas. These enigmatic cells have recently been shown to respond to physiological stimuli in a manner that is markedly different from their neighbouring pancreatic acinar cells (PACs). Here, we demonstrate the capacity of PSCs to generate nitric oxide (NO), a free radical messenger mediating, for example, inflammation and vasodilatation. We show that production of cytosolic NO in PSCs is unambiguously related to cytosolic Ca2+ signals. Only stimuli that evoke Ca2+ signals in the PSCs elicit consequent NO generation. We provide fresh evidence for the striking difference between signalling pathways in PSCs and adjacent PACs, because PSCs, in contrast to PACs, generate substantial Ca2+-mediated and NOS-dependent NO signals. We also show that inhibition of NO generation protects both PSCs and PACs from necrosis. Our results highlight the interplay between Ca2+ and NO signalling pathways in cell–cell communication, and also identify a potential therapeutic target for anti-inflammatory therapies.
Keywords: calcium, inflammation, nitric oxide, pancreas, stellate cell
1. Background
Mammalian stellate cells (Latin stella—star) are retinoid-storing cells woven into the tissue of various organs [1] including the liver, pancreas, kidney, spleen, lung and vocal folds. Stellate cells are capable of transformations from a quiescent to an activated myofibroblast-like phenotype [2]. Activated stellate cells have attracted attention owing to the pivotal role they play in pathological fibrosis: they overproduce extracellular matrix proteins to repair the chronic stress-induced injuries in the tissue [1–3]. Nevertheless, the initial pathophysiological role of stellate cells—prior to activation—remains enigmatic. Here, we studied the primary signalling events, evoked by either oxidative stress or proinflammatory mediators, in stellate cells (PSCs) and neighbouring acinar cells (PACs) in the normal mouse pancreas, and identified a link between calcium and nitric oxide signalling pathways in PSCs.
In the normal pancreas acetylcholine (ACh) or cholecystokinin (CCK) evoke Ca2+ signals regulating the processes of enzyme release from zymogen granules deposited in the apical parts of PACs [4–10]. However, under pathological conditions (e.g. bile reflux into the pancreatic duct, high-fat diet together with excessive alcohol intake), Ca2+ signals become abnormally large and this elicits premature activation of enzymes within PACs and subsequent necrosis [8], followed by sterile (non-microbial) inflammation leading to acute pancreatitis (AP) [11,12].
Reactive oxygen/nitrogen species (ROS/RNS), such as NO, are highly chemically active radical and non-radical molecules that initiate and propagate reactions of oxidative stress, and thus act as second messengers in various inflammatory processes [13–16]. Both endogenous and exogenous ROS can modulate store-operated Ca2+ entry (SOCE) [17–20] and release [21]. Excessive Ca2+ influx into PACs, together with the sustained elevation of the cytosolic calcium ion concentration ([Ca2+]C) [22–24], underlies the mechanism of AP [25], and store-operated Ca2+ entry channels are therefore potential therapeutic targets [24,26–28]. Nevertheless, the roles of ROS/RNS (including NO) in the (patho)physiology of PSCs remain unexplored. Generation of NO has not yet been reported in PSCs, although a plausible link between PSC activation and NO has been established: in cultured rat PSCs, expression of nitric oxide synthase 2 (NOS2) is increased after stimulation with pathogen-associated molecular patterns (PAMP) that activate Toll-like receptors (TLR) of innate immunity [29]. TLRs also mediate responses to damage-associated molecular patterns (DAMP) released from injured tissues (e.g. the necrotizing pancreas) [12].
The proinflammatory mediator bradykinin (BK) induces NO production in vascular endothelial cells [30,31]. BK was recently shown to elicit Ca2+ signals in PSCs [32], at pathophysiologically relevant concentrations [33], and this was linked to AP via specific action on PSCs through bradykinin receptor B2 [33]. So far, it is unknown whether BK elicits NO generation in PSCs and, if so, what the role of this process might be. Bile acids (BA), employed extensively in cellular [11,22,34,35] and animal [16,36–38] studies of the pancreas, induce abnormal Ca2+ signals [34] that cause necrosis and AP [25]. In the light of the inflammatory background of AP, it seems likely that BK and BA would evoke not only Ca2+ signals, but also NO signals with the potential for crosstalk between the two signalling pathways.
In order to explore such interactions, we inhibited either Ca2+ or NO signal generation in PSCs. Caffeine is known to reduce Ca2+ signals via inhibition of inositol 1,4,5-triphosphate receptors in PACs [39,40]; what is more, a caffeine-dependent decline in severity of pancreatic injury was recently demonstrated in three animal models of AP [41]. Thus, caffeine was used here to test whether the blockade of BA-elicited Ca2+ responses might attenuate NO signals. The latter were also blocked pharmacologically by inhibitors of enzymatic NO synthesis (NOS inhibitors), widely used in therapy of various inflammatory diseases [42], including AP [43,44]. Nevertheless, so far, the actual outcome of NOS inhibition in AP remains unclear. The aim of this study was to investigate the role of normal PSCs in the initial signalling events upon proinflammatory stimulation. We report here that PSCs, in contrast to PACs, generate substantial Ca2+-mediated and NOS-dependent NO signals, and that inhibition of NO generation protects both PSCs and PACs from necrosis.
2. Methods
Animals: C57BL6/J mice (Charles Rivers). Antibodies: Alexa Fluor 488 goat anti-mouse, Alexa Fluor 635 goat anti-rabbit (Thermo Fisher Scientific); mouse anti-BDKRB2 (Santa Cruz); rabbit anti-NOS2 (Merck). Cell culture: human pancreatic stellate cell line, SteCM complete stellate cell medium (ScienCell). Chemicals: aminoguanidine (AG), bradykinin, l-NAME (Tocris); PBS, ProLong Diamond Antifade Mountant with DAPI (Thermo Fisher Scientific); other chemicals were obtained from Sigma. Fluorescent dyes: DAF-2 (Santa Cruz); DAF-FM, Fluo-4, Fura-2, Hoechst 33342, propidium iodide (Thermo Fisher Scientific).
2.1. Isolation of pancreatic lobules
Six- to eight-week-old male mice were sacrificed by cervical dislocation, the pancreases were dissected and the lobules were immediately isolated by collagenase digestion. Briefly, the pancreas was injected intraductally with NaHEPES-based collagenase solution and incubated (5–6 min, 37°C) to allow partial digestion of the tissue.
2.2. Primary human pancreatic stellate cell line
hPSCs were cultured (up to the fifth passage) at 37°C, 5% CO2, in complete stellate cell medium and split once a week.
2.3. Cytosolic calcium or nitric oxide measurements
Unless otherwise indicated, NaHEPES-based media, containing (mM): NaCl, 140; KCl, 4.7; HEPES, 10; MgCl2, 1; glucose, 10; and pyruvate, 1, were supplemented with 1 mM Ca2+ for calcium measurements and with 1 mM Ca2+ together with 0.5 mM l-Arg for nitric oxide recordings. For Ca2+ measurements, the lobules were loaded with 10 µM Fluo-4 (1 h, 30°C), and hPSC with 1 µM Fluo-4 (30 min, 37°C). For NO measurements, the lobules were loaded with 20 µM DAF-2 or DAF-FM (1 h, 30°C), and hPSC with 0.1 µM DAF-2 or DAF-FM (1 h, 37°C). The lobules were transferred to a flow chamber and allowed to adhere to the glass surface; and for hPSC imaging, the coverslips with growing cells were used for flow chamber assembly. Experiments were performed in continuous perfusion with extracellular buffer-based solution; and the cells were visualized using a TCS SP5 II two-photon confocal microscope (Leica) with a 63 × 1.2 NA water objective. Fluo-4 or DAF dyes were excited with a 488 nm Ar laser, at 1–4% power, and emitted light was collected in the three-dimensional recording mode at 495–580 nm. The speed of recordings was approximately one image per 10 s, and varied dependent on thickness of the samples (up to 15 µm, z-axis resolution 1 µm). Images were captured at 512 × 512, and series of images were recorded at 256 × 256 pixel resolution, respectively, and analysed using Leica software. In order to reconstruct the three-dimensional signal, the individual signals from z-stacks were cropped, and the maximal projection was applied. Fluorescence signals were plotted as F/F0, where F0 was an averaged signal from first ten baseline images, and normalized as previously described [45].
2.4. Simultaneous cytosolic calcium and nitric oxide measurements
For simultaneous Ca2+ and NO measurements, the lobules were loaded with 10 µM Fura-2 and 10 µM DAF-2 (1 h, 30°C). After the loading, the lobules were transferred to the chamber, perfused and visualized as described above. Fura-2 fluorescence was excited with 355 nm and 405 nm lasers, at 8% and 16% power, respectively; and emitted light was collected in the three-dimensional recording mode at 500–600 nm; DAF-2 fluorescence was excited and collected as described above.
2.5. Measurements of necrosis level in the lobules
The lobules were treated with 5 mM cholate, 5 mM taurocholate or 0.2 mM TLC-S challenge (2 h, room temperature), and in some experiments, 0.6 mM l-NAME was present. The lobular PSCs were visualized using Fluo-4 (10 µM, 2 h); the lobules were co-stained with Hoechst 33342 (32 µM, 30 min), and dead cells were identified by PI staining (1.5 µM, 15 min) as described [33]. The cells were visualized, using the confocal microscope with a 63 × 1.2 NA water objective. Fluo-4, Hoechst 33342 and PI were excited with 488 nm Ar (1%), 355 nm diode (10%) and 543 nm HeNe laser (10%), respectively; and corresponding emissions were collected at 505–535, 415–485 and 615–720 nm. The fluorescence signal was collected sequentially between frames in the three-dimensional mode from 20 µm thick lobules and 512 × 512 pixel resolution. Five pictures of independent lobules were taken in each of four experimental replicates (n = 20), and live (PI-negative) and dead (PI-positive) cells were counted.
2.6. Immunohistochemistry
Unless otherwise indicated, the procedure was performed at room temperature, and double distilled water (ddH2O) was used for preparation of all solutions. 0.1% Tween 20 was used as a washing buffer and 1% BSA in PBS with 0.1% Tween 20 was a blocking buffer. Mouse pancreatic tissue samples were fixed in formalin, embedded in paraffin and cut into 4 µm sections. The sections were heated in a dry oven (30 min, 65°C), then deparaffinized in xylene (2 × 10 min) and graded ethanol, and then incubated in 50 mM NH4Cl (20 min). Antigen retrieval was achieved by autoclaving (20 min, 120°C) the samples in TAE buffer (pH 8.1), followed by slow cooling to room temperature (30 min). Permeabilization was performed in 0.4% Triton X-100 (10 min). In order to quench autofluorescence, the sections were incubated in 0.2% Sudan black B [46]. The sections were then transferred to a humid chamber, and blocking of non-specific binding sites was performed (1 h), followed by incubation with primary anti-BDKRB2 and anti-NOS2 Abs (0.5 µg ml−1) for 1 h at room temperature, and then overnight at 4°C. The negative controls were incubated in blocking solution with no primary Abs. The following day, the sections were incubated (1 h) with goat anti-rabbit secondary Ab (4 µg ml−1), washed, and then incubated (1 h) with goat anti-mouse secondary Ab (4 µg ml−1). The sections were embedded in antifade mounting medium with DAPI, and imaged immediately using the confocal microscope (excitation wavelengths: 355, 488 and 633 nm). The slides were stored at 4°C.
2.7. Statistics
The quantitative results were expressed as means ± s.d. or s.e.m. (see the text for details). Statistical analysis was performed using the Student's t-test or ANOVA, and the significance threshold was set at 0.05.
3. Results
3.1. Oxidative stress elicits (patho)physiological calcium and nitric oxide signals
Hydrogen peroxide (H2O2) was used as an initiator of oxidative stress in human pancreatic stellate cells (hPSCs; figure 1a–b) and mouse pancreatic tissue lobules (figure 1c–h). In hPSCs, a sustained increase in [Ca2+]C was evoked by 0.5 mM H2O2 (blue), which was markedly (p < 0.001) attenuated by removal of external Ca2+ (orange; figure 1a–b). In the lobules, oxidative stress elicited rises in [Ca2+]C in both PSCs (red) and PACs (blue; figure 1c), although cytosolic NO signals (figure 1d; see also electronic supplementary material, figure S1 and video S1) were limited spatially to PSCs (red), manifest as a sharp increase and sustained plateau phase. Three-dimensional reconstruction of the DAF-FM fluorescence signal collected from the 1 mM H2O2-stimulated lobules confirmed the increase in [NO]C in situ in PSCs (cells of well-defined projections, red arrows), but not in adjacent PACs (cells that form the acini, blue arrows; figure 1e). The amplitudes of the H2O2-elicited increases in cytosolic NO in the PSCs varied, depending on the peroxide concentration (figure 1f ). The development of NO responses was modulated by the NOS inhibitor N(ω)-nitro-l-arginine methyl ester (l-NAME; figure 1g–h), so that, at a concentration of 0.6 mM (pink trace and bar), it attenuated the 0.25 mM H2O2-evoked (black trace and bar) NO signals (figure 1g), reducing significantly (p < 0.001) the area under the response curve (figure 1h).
Figure 1.

Oxidative stress evokes cytosolic calcium and nitric oxide signals in the pancreatic cells. (a) Average traces (mean ± s.e.m.) of cytosolic Ca2+ responses to 0.5 mM H2O2 in hPSCs, in the presence of 1.0 mM Ca2+ (blue, n = 38) or the absence of Ca2+ (orange, n = 35). (b) Bar chart (mean ± s.e.m.) comparing the areas under the response curves to 0.5 mM H2O2 in the presence of 1.0 mM Ca2+ (blue, n = 38) or the absence of Ca2+ (orange, n = 35)—summary of (a). (c) Typical cytosolic Ca2+ responses elicited by 0.5 mM H2O2 in PSCs (red, n = 6) and PACs (blue, n = 6) in pancreatic lobules. (d) Typical cytosolic NO responses elicited by 0.5 mM H2O2 in PSCs (red, n = 5) and PACs (blue, n = 8) in pancreatic lobules. See also electronic supplementary material, video S1 and figure S1. (e) Photomicrograph of the lobules loaded with fluorescent NO probe DAF-FM, upon stimulation with 1 mM H2O2. Arrows: PSCs, red; PACs, blue. Scale bar, 50 µm. (f) Bar chart (mean ± s.e.m.) comparing amplitudes of cytosolic NO responses in PSCs, elicited by 0.05–0.5 mM H2O2 in the lobules (n ≥ 5). (g) Average traces (mean ± s.e.m.) of cytosolic NO responses to 0.25 mM H2O2 (arrow) in the absence (black, n = 13) or the presence of 0.6 mM l-NAME (pink, n = 10), in PSCs in the lobules. (h) Bar chart (mean ± s.e.m.) comparing the areas under the response curves of PSCs to 0.25 mM H2O2 in the absence (black, n = 13) or the presence of 0.6 mM l-NAME (pink, n = 10)—the summary of (g).
3.2. The proinflammatory mediator bradykinin evokes simultaneous calcium and nitric oxide signals in stellate cells
Double loading of the lobules—with Ca2+- and NO-sensing fluorescent indicators—revealed simultaneous development of both Ca2+ and NO signals: upon stimulation of the lobules with 20 nM BK (figure 2a), a rapid increase in [Ca2+]C, with an initial peak and subsequent plateau phase (navy blue), and a sustained increase in cellular NO [NO]C (green) were observed solely in PSCs, with no Ca2+/NO signals detected in PACs (figure 2a). In hPSCs, a sustained increase in [NO]C was evoked by 1 µM BK (figure 2b), and additional stimulation of the cells with 0.5 mM H2O2 brought a further rise in [NO]C.
Figure 2.
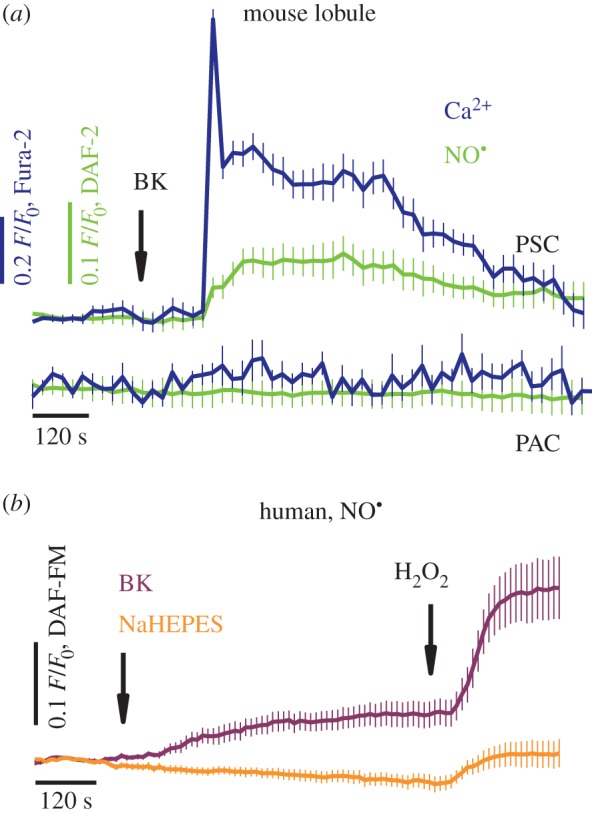
Bradykinin elicits simultaneous cytosolic calcium and nitric oxide responses in stellate cells. (a) Average traces (mean ± s.e.m.) of cytosolic Ca2+ and NO responses to 20 nM BK (arrow), recorded in pancreatic lobules. The lobules were loaded with Fura-2 and DAF-2 fluorescent probes, and Ca2+ (navy blue) and NO responses (green) were registered simultaneously in PSCs (n = 12; top curves); no responses were detected in PACs (n = 6; bottom curves). (b) Average traces (mean ± s.e.m.) of cytosolic NO responses to 1 µM BK, and then to 0.5 mM H2O2 recorded in human PSCs (purple, n = 24); the control cells received placebo and H2O2 treatment (orange, n = 24).
3.3. Bile-acid-elicited calcium and nitric oxide signals have different profiles in acinar and stellate cells
Robust [Ca2+]C elevations in the lobules (figure 3a) were evoked by the natural bile sodium salts: 5 mM cholate (left), 5 mM taurocholate (middle) and 0.2 mM taurolithocholic acid 3-sulfate (TLC-S; right). The pattern of the responses was markedly different in adjacent PACs and PSCs: cholate and taurocholate-elicited increases in [Ca2+]C almost exclusively in PSCs (red), with robust Ca2+ signals in cholate- and oscillatory Ca2+ signals in taurocholate-stimulated PSCs, whereas only very modest responses—single spikes—were detected in PACs (blue). In contrast, stimulation with TLC-S evoked Ca2+ signals with an oscillatory pattern in PACs (blue), and almost no detectable responses in PSCs (red). NO levels were shown to rise in PSCs (red) upon stimulation with cholate (figure 3b, left; see also electronic supplementary material, figure S2) and taurocholate (figure 3b, middle), but not with TLC-S (figure 3b, right); no detectable NO signals accompanied the Ca2+ signals in PACs (blue). 20 mM caffeine blocked the development of cholate-evoked NO signals in both lobular PSCs and hPSCs (electronic supplementary material, figure S2).
Figure 3.

Bile acids evoke toxic calcium overload and nitric oxide signals in the lobules. (a) Typical cytosolic Ca2+ responses elicited by 5 mM cholate (left), 5 mM taurocholate (centre) and 0.2 mM TLC-S (right) in PSCs (red; n = 5, n = 6, n = 4) and PACs (blue; n = 12, n = 7, n = 19). (b) Typical cytosolic NO responses elicited by 5 mM cholate (left), 5 mM taurocholate (central) and 0.2 mM TLC-S (right) in PSCs (red; n = 8, shown also in figure 4a and electronic supplementary material, figure S2a; n = 16, shown also in figure 4b; n = 5) and PACs (blue; n = 8, n = 6, n = 8). See also electronic supplementary material, figure S2.
3.4. Nitric oxide synthase inhibitors modulate bile-acid-evoked nitric oxide signals
Pharmacological NOS inhibitors, the non-specific l-NAME and the irreversible inhibitor of NOS2 aminoguanidine (AG), reduced BA-evoked NO responses in the lobules (figure 4a–d). The developments of 5 mM cholate- (figure 4a) and 5 mM taurocholate-elicited (figure 4b) responses (black traces and bars) were significantly reduced in the presence of 0.6 mM l-NAME (pink traces and bars; figure 4a–b). The aforementioned reductions in taurocholate-elicited NO generation were dependent on l-NAME concentration (figure 4c; p < 0.05*, p < 0.01** and p < 0.001***), as well as AG concentration (figure 4d; p < 0.01** and p < 0.0001****), as shown in the bar charts (0.04–0.6 mM inhibitor; figure 4c–d) and the representative traces in the insets (0.04, 0.15 and 0.3 mM inhibitor; figure 4c–d).
Figure 4.

Nitric oxide synthase inhibitors diminish cytosolic nitric oxide signals and protect from necrosis. (a) Typical cytosolic NO responses evoked by 5 mM cholate in the absence (black, n = 8) or the presence of 0.6 mM l-NAME (pink, n = 9). Inset: bar chart (mean ± s.e.m.) comparing the areas under the response curves. (b) Typical cytosolic NO responses evoked by 5 mM taurocholate in the absence (black, n = 16) or the presence of 0.6 mM l-NAME (pink, n = 8). Inset: bar chart (mean ± s.e.m.) comparing the areas under the response curves (showed also in figure 4c). (c) Bar chart (mean ± s.e.m.) comparing the areas under the response curves of PSCs to 5 mM taurocholate, in the presence of 0.04–0.6 mM l-NAME (n ≥ 3). Inset: typical cytosolic NO responses of PSCs to 5 mM taurocholate in the presence of 0.04 (dark grey), 0.15 (grey) and 0.3 mM l-NAME (light grey); the responses are presented from the moment of taurocholate and NOS inhibitor administration. (d) Bar chart (mean ± s.e.m.) comparing the areas under the response curves of PSCs to 5 mM taurocholate, in the presence of 0.04–0.6 mM AG (n ≥ 3). Inset: typical cytosolic NO responses of PSCs to 5 mM taurocholate in the presence of 0.04 (dark grey), 0.15 (grey) and 0.3 mM AG (light grey); the responses are presented as in figure 4c. (e) Bar chart (mean ± s.d.) comparing levels of necrosis in the lobules under different experimental conditions. The lobules were treated with 5 mM cholate, 5 mM taurocholate or 0.2 mM TLC-S, the presence of 0.6 mM l-NAME is indicated with +; NaHEPES-treated lobules served as control. PSCs (dashed red) and PACs (dashed blue) were counted after triple staining of the lobules with fluorescent probes: Fluo-4, Hoechst 33342 and PI (four replicates, n = 20). See also electronic supplementary material, figure S3. ( f–i) Co-immunolocalization of the BDKRB2 and the NOS2 in mouse pancreas. ( f ) DAPI, (g) Ab anti-NOS2, (h) Ab anti-BDKRB2, (i) overlaid ( f–h). Scale bar, 25 µm. Arrowheads, PSCs; arrows, PACs; V, blood vessel; dash line, pancreatic duct. See also electronic supplementary material, figure S4.
3.5. Blockade of nitric oxide production reduces necrosis in the pancreatic lobules
The role of pharmacological blockade of NO production was analysed after 2 h incubation of the lobules with 5 mM cholate, 5 mM taurocholate or 0.2 mM TLC-S (figure 4e; see also electronic supplementary material, figure S3), and l-NAME was used as NOS inhibitor. Because the levels of necrosis in the lobules that received 0.6 mM l-NAME (and no BA) treatment did not change in comparison with NaHEPES controls (less than 5%), l-NAME at this concentration was tested as a protective agent against the BA challenge. Lobular PSCs (dashed red) were substantially more susceptible to cholate or taurocholate than PACs (dashed blue): the PSCs/PACs necrosis ratios were approximately 83/47 (1.8) in cholate- and approximately 31/8 (3.8) in taurocholate-treated lobules. The presence of l-NAME, however, reduced necrosis by almost 50%, irrespective of cell type, reaching approximately 48/22 (2.2) for the cholate- and approximately 13/6 (1.3) for taurocholate-challenged lobules, respectively. TLC-S induced necrosis at similar levels in both pancreatic cell types: the PSCs/PACs necrosis was approximately 43/38 (1.1), and in l-NAME-protected lobules approximately 16/16 (1.0), similarly the cholate- or taurocholate-treated lobule necrosis decreased by almost 50%.
3.6. Source of nitric oxide signals in pancreatic stellate cells
Co-immunolocalization of NOS2 and BK receptor B2 (BDKRB2) in the pancreas was assessed in formalin-fixed paraffin-embedded mouse tissue sections (figure 4f–i; see also electronic supplementary material, figure S4), and DAPI was used to stain the nuclei (PSCs: elongated, indicated with arrowheads; PACs: large round, indicated with arrows; figure 4f). The PSCs were localized in the interacinar spaces, encircling the base of adjacent acini with fine cytoplasmic processes. The processes, as well as the areas that surround PSCs nuclei, were visualized using anti-NOS2 (figure 4g, red) and anti-BDKRB2 (figure 4h, green) antibodies (Ab). The areas of co-immunolocalization (figure 4i, hybrid yellow to orange) were identified as PSCs. The transmitted light image along with the high-resolution NOS2 staining images are shown in electronic supplementary material, figure S4.
4. Discussion and conclusion
It has previously been shown that cytosolic calcium signals can be elicited in cultured [32] and in normal (lobular) [33] pancreatic stellate cells. This study now reveals that these signals are interlinked with cytosolic nitric oxide signals.
We show that NO signals are evoked in PSCs upon induction of oxidative stress (figure 1) or application of inflammatory mediators (figures 2–4). Oxidative stress originates from the imbalance between the production and neutralization of ROS/RNS [13,47], and is implicated in the mechanisms of numerous inflammatory diseases [15,16,20], including AP [11,16,19]. However, for pancreatitis, there remains the ‘chicken or the egg’ question regarding the roles of ROS/RNS in the development of inflammation. Here, we show that H2O2 at concentrations that are (patho)physiologically relevant [47,48] evoke large Ca2+ signals with an oscillatory pattern in both PACs and PSCs (figure 1a–c). Importantly, we demonstrate that it is only in the PSCs that these Ca2+ signals are accompanied by detectable NO signals (figure 1d–h).
Spatial separations of BK- and ACh- or CCK-elicited Ca2+ signals in pancreatic lobules have previously been reported. Whereas ACh and CCK evoke Ca2+ signals in PACs, which control normal acinar secretion [49], BK-evoked Ca2+ signals are entirely confined to PSCs [33]. BK-elicited Ca2+ signalling events in PSCs are mediated via BDKRB2 [33] and pharmacological blockade of this receptor with the B2 antagonist WIN64338 protected lobular PACs from the necrosis evoked by alcohol/fatty acid or bile acids [33], indicating a possible paracrine interaction between PSCs and PACs. Here, we show that BK elicits simultaneous Ca2+ and NO signals in PSCs (figure 2a, upper curves), but fails to evoke responses in adjacent PACs (figure 2a, lower curves). Because large Ca2+ signals in PSCs are not accompanied by Ca2+ signals in PACs, and vice versa, it may be NO that mediates paracrine communication between stellate cells and other cell types in the pancreas.
Bile acids are natural compounds of the bile that facilitate enzymatic hydrolysis of lipids in the process of digestion [50]. In the case of gallstone-induced bile reflux into the pancreatic duct, bile acids in high concentrations will get in direct contact with pancreatic cells. Bile acids evoke large abnormal Ca2+ signals in PACs [22,34,35], followed by intracellular enzyme activation, PAC necrosis [25], autodigestion of the pancreas and finally pancreatitis [11,12,25]. Cytoplasmic and mitochondrial Ca2+ signals, elicited in isolated PACs by TLC-S, impair ATP synthesis and induce ROS production [11]. Nevertheless, TLC-S has little effect on [Ca2+]C in PSCs (figure 3a), and no detectable role in NO signalling in these cells (figure 3b). In contrast, robust Ca2+ signals elicited in PSCs by cholate and taurocholate (figure 3a) are accompanied by NO signals (figures 3b and 4a–d). A plausible explanation for the diverse sensitivity of pancreatic cells to bile acids might be the different pattern of bile-acid-transporting proteins in PSCs and PACs.
Our results demonstrating that even substantial Ca2+ signals generated in PACs fail to elicit detectable NO signals are in agreement with a previous study in which the non-enzymatic NO signal generation was explored in isolated PACs [45]. In that study, even supramaximal ACh concentrations failed to evoke detectable NO signals in more than 70% of intact PACs.
The potential benefit of blocking NO generation in the therapy of various diseases, including AP, remains controversial [15]: several studies show beneficial effects of NOS inhibitors in the therapy of cancer [51], arthritis [52] and pancreatitis [43,44], whereas others demonstrate that blockade of NO production aggravates liver injury [53], and exacerbates inflammation in the kidney [54]. Here, we show that l-NAME (blocker of NOS 1–3; figure 4a–c) and AG (irreversible inhibitor of NOS2; figure 4d) significantly reduce bile-acid-evoked NO signals in PSCs. Furthermore, we demonstrate that there is substantially more necrosis in PSCs than in PACs in cholate- or taurocholate-challenged lobules (figure 4e), which correlates with the presence of NO signals together with large Ca2+ signals in PSCs upon stimulation with these BAs (figure 3). Interestingly, the levels of necrosis in TLC-S-stressed lobules are comparable for both type of pancreatic cells (figure 4e)—possibly owing to the lack of detectable NO signals in PSCs (figure 3) that could exacerbate necrosis. The pharmacological inhibitor l-NAME significantly reduces necrosis in BA-challenged lobules, irrespective of bile type and cell type (figure 4e). In cholate- or taurocholate-stressed lobules the protective effect of l-NAME (blockade of NO signals ameliorates necrosis) is more prominent in the PSCs than in the PACs, which do not have detectable cytosolic NO signals. The protection of PACs might be the result of, for example, paracrine communication, PSCs–PACs, via intercellular messengers (plausibly NO) released by PSCs.
Expression of the NO-forming enzymes, NOS 1–3, in the exocrine pancreas has recently been confirmed using state-of-the-art immunohistological methods [55]. The authors of the study, however, did not refer directly to PSCs, although they report the presence of ‘cells of the morphology of ductal cells’ in chronic pancreatitis (CP) tissue specimens [55]. These cells could well have been PSCs, which are known to induce fibrosis in CP [2,56]. TLR-mediated expression of NOS2 has been detected in isolated PSCs upon stimulation with PAMP [29]. Importantly, TLRs are also activated upon stimulation with DAMP—endogenous molecules released from injured cells [12] (e.g. autodigested PACs). Thus, DAMP-exposed and then NOS2-expressing PSCs might be present in the pancreatic tissue. Here, using the Ab anti-BDKRB2 (figure 4h; green), we identify PSCs in mouse pancreatic tissue specimens: the cells localize in the interacinar spaces, encircling the base of adjacent acini with fine cytoplasmic processes [57]. This is in line with other immunohistological studies on PSCs in the milieu of the tissue [1,57]. The pattern of anti-NOS2 Ab staining (figure 4g; red) resembles the network of discrete stellate-shaped cells and their cytoplasmic processes [57]. The staining of BDKRB2 and NOS2 overlay, yielding yellow to orange colour (figure 4i). The strong staining of PSC processes might be explained by the results of a study on polarized epithelial cells [58] in which NOS2 was shown to be compartmentalized in the submembrane areas (here: near the membrane surrounding the nuclear area and covering the very fine cytoplasmic processes). Such submembrane localization of NOS2 would ensure precise vertical delivery (across the cell membrane) of the second messenger NO to the target [58,59].
NO generated in PSCs may not only exert an effect on PACs, but also reach endothelial cells in peri-acinar capillaries. As pointed out recently [60], the PSCs are strategically localized in a niche between acinar cells and peri-acinar capillaries, and, in the intact pancreas in vivo, NO generated in PSCs could well have vascular effects.
In conclusion, our results reveal interplay between NO and Ca2+ in situ in PSCs, induced by stress related to inflammation (figures 1–2) and disease (figures 3–4). PSCs might then resemble a sensor that downstream the stress signals by means of at least two second messengers.
Supplementary Material
Acknowledgements
We are grateful to Drs Martin Schepelmann and Polina Yarova (Cardiff University) for their inspiring advice regarding IHC, and Mr Derek Scarborough (Cardiff University) for paraffin-fixation of the pancreatic tissue.
Ethics
All the experimental procedures were carried out in accordance with the UK Home Office regulations.
Data accessibility
Figures S1–S4 supporting this article have been uploaded as part of the electronic supplementary material. Datasets for this article have been collected and processed using Leica LAS AF software (https://leica-microsystems.com/products/microscope-software) needed to open the original files. Other supporting files will be made available in the Research section via: https://www.cardiff.ac.uk/people/view/108900-gerasimenko-oleg, and Dryad Digital Repository (electronic supplementary material, video S1): http://dx.doi.org/10.5061/dryad.4rb47.
Authors' contributions
O.H.P., O.V.G., J.V.G. conceived and supervised the study. M.A.J., P.E.F. designed and conducted the experiments, and M.A.J. analysed the results. M.A.J. and O.H.P. wrote the manuscript with editorial input from all authors. All authors gave final approval for publication.
Funding
This work was supported by an MRC UK programme grant no. MR/J002771/1. OHP is a MRC Professor (G19/22/2).
Competing interests
We declare we have no competing interests.
References
- 1.Zhao L, Burt AD. 2007. The diffuse stellate cell system. J. Mol. Histol. 38, 53–64. (doi:10.1007/s10735-007-9078-5) [DOI] [PubMed] [Google Scholar]
- 2.Erkan M, et al. 2012. StellaTUM: current consensus and discussion on pancreatic stellate cell research. Gut 61, 172–178. (doi:10.1136/gutjnl-2011-301220) [DOI] [PMC free article] [PubMed] [Google Scholar]
- 3.Sherman MH, et al. 2014. Vitamin D receptor-mediated stromal reprogramming suppresses pancreatitis and enhances pancreatic cancer therapy. Cell 159, 80–93. (doi:10.1016/j.cell.2014.08.007) [DOI] [PMC free article] [PubMed] [Google Scholar]
- 4.Hegyi P, Petersen OH. 2013. The exocrine pancreas: the acinar-ductal tango in physiology and pathophysiology. Rev. Physiol. Biochem. Pharmacol. 165, 1–30. (doi:10.1007/112_2013_14) [DOI] [PubMed] [Google Scholar]
- 5.Tepikin AV, Voronina SG, Gallacher DV, Petersen OH. 1992. Acetylcholine-evoked increase in the cytoplasmic Ca2+ concentration and Ca2+ extrusion measured simultaneously in single mouse pancreatic acinar cells. J. Biol. Chem. 267, 3569–3572. [PubMed] [Google Scholar]
- 6.Thorn P, Lawrie AM, Smith PM, Gallacher DV, Petersen OH. 1993. Local and global cytosolic Ca2+ oscillations in exocrine cells evoked by agonists and inositol trisphosphate. Cell 74, 661–668. (doi:10.1016/0092-8674(93)90513-P) [DOI] [PubMed] [Google Scholar]
- 7.Gerasimenko OV, Gerasimenko JV, Belan PV, Petersen OH. 1996. Inositol trisphosphate and cyclic ADP-ribose-mediated release of Ca2+ from single isolated pancreatic zymogen granules. Cell 84, 473–480. (doi:10.1016/S0092-8674(00)81292-1) [DOI] [PubMed] [Google Scholar]
- 8.Raraty M, Ward J, Erdemli G, Vaillant C, Neoptolemos JP, Sutton R, Petersen OH. 2000. Calcium-dependent enzyme activation and vacuole formation in the apical granular region of pancreatic acinar cells. Proc. Natl Acad. Sci. USA 97, 13 126–13 131. (doi:10.1073/pnas.97.24.13126) [DOI] [PMC free article] [PubMed] [Google Scholar]
- 9.Matthews EK, Petersen OH, Williams JA. 1973. Pancreatic acinar cells: acetylcholine-induced membrane depolarization, calcium efflux and amylase release. J. Physiol. 234, 689–701. (doi:10.1113/jphysiol.1973.sp010367) [DOI] [PMC free article] [PubMed] [Google Scholar]
- 10.Case RM, Clausen T. 1973. The relationship between calcium exchange and enzyme secretion in the isolated rat pancreas. J. Physiol. 235, 75–102. (doi:10.1113/jphysiol.1973.sp010379) [DOI] [PMC free article] [PubMed] [Google Scholar]
- 11.Booth DM, et al. 2011. Reactive oxygen species induced by bile acid induced apoptosis and protect against necrosis in pancreatic acinar cells. Gastroenterology 140, 2116–2125. (doi:10.1053/j.gastro.2011.02.054) [DOI] [PubMed] [Google Scholar]
- 12.Hoque R, Malik AF, Gorelick F, Mehal WZ. 2012. Sterile Inflammatory response in acute pancreatitis. Pancreas 41, 353–357. (doi:10.1097/MPA.0b013e3182321500) [DOI] [PMC free article] [PubMed] [Google Scholar]
- 13.Halliwell B. 1991. Reactive oxygen species in living systems: source, biochemistry, and role in human disease. Am. J. Med. 91, S14–S22. (doi:10.1016/0002-9343(91)90279-7) [DOI] [PubMed] [Google Scholar]
- 14.Kerwin JJF, Lancaster JJR, Feldman PL. 1995. Nitric oxide: a new paradigm for second messengers. J. Med. Chem. 38, 4343–4362. (doi:10.1021/jm00022a001) [DOI] [PubMed] [Google Scholar]
- 15.Pacher P, Beckman JS, Liaudet L. 2007. Nitric oxide and peroxynitrite in health and disease. Physiol. Rev. 87, 315–424. (doi:10.1152/physrev.00029.2006) [DOI] [PMC free article] [PubMed] [Google Scholar]
- 16.Lerch MM, Gorelick FS. 2013. Models of acute and chronic pancreatitis. Gastroenterology 144, 1180–1193. (doi:10.1053/j.gastro.2012.12.043) [DOI] [PubMed] [Google Scholar]
- 17.Bogeski I, Klich T, Niemeyer BA. 2012. ROS and SOCE: recent advances and controversies in the regulation of STIM and Orai. J. Physiol. 590, 4193–4200. (doi:10.1113/jphysiol.2012.230565) [DOI] [PMC free article] [PubMed] [Google Scholar]
- 18.Bruce JIE, Elliott AC. 2007. Oxidant-impaired intracellular Ca2+ signaling in pancreatic acinar cells: role of the plasma membrane Ca2+-ATPase. Am. J. Physiol. Cell Physiol. 293, C938–C950. (doi:10.1152/ajpcell.00582.2006) [DOI] [PubMed] [Google Scholar]
- 19.Baggaley EM, Elliott AC, Bruce JIE. 2008. Oxidant-induced inhibition of the plasma membrane Ca2+-ATPase in pancreatic acinar cells: role of the mitochondria. Am. J. Physiol. Cell Physiol. 295, C1247–C1260. (doi:10.1152/ajpcell.00083.2008) [DOI] [PMC free article] [PubMed] [Google Scholar]
- 20.Trebak M, Ginnan R, Singer HA, Jourd'heuil D. 2010. Interplay between calcium and reactive oxygen/nitrogen species: an essential paradigm for vascular smooth muscle signaling. Antioxid. Redox Signal. 12, 657–674. (doi:10.1089/ars.2009.2842) [DOI] [PMC free article] [PubMed] [Google Scholar]
- 21.Ivanova H, Vervliet T, Missiaen L, Parys JB, De Smedt H, Bultynck G. 2014. Inositol 1,4,5-trisphosphate receptor-isoform diversity in cell death and survival. Biochim. Biophys. Acta 1843, 2164–2183. (doi:10.1016/j.bbamcr.2014.03.007) [DOI] [PubMed] [Google Scholar]
- 22.Voronina SG, Gryshchenko OV, Gerasimenko OV, Green AK, Petersen OH, Tepikin AV. 2005. Bile acids induce a cationic current, depolarizing pancreatic acinar cells and increasing the intracellular Na+ concentration. J. Biol. Chem. 280, 1764–1770. (doi:10.1074/jbc.M410230200) [DOI] [PubMed] [Google Scholar]
- 23.Criddle DN, Raraty MGT, Neoptolemos JP, Tepikin AV, Petersen OH, Sutton R. 2004. Ethanol toxicity in pancreatic acinar cells: mediation by nonoxidative fatty acid metabolites. Proc. Natl Acad. Sci. USA 101, 10 738–10 743. (doi:10.1073/pnas.0403431101) [DOI] [PMC free article] [PubMed] [Google Scholar]
- 24.Gerasimenko JV, et al. 2013. Ca2+ release-activated Ca2+ channel blockade as a potential tool in antipancreatitis therapy. Proc. Natl Acad. Sci. USA 110, 13 186–13 191. (doi:10.1073/pnas.1300910110) [DOI] [PMC free article] [PubMed] [Google Scholar]
- 25.Petersen OH, Sutton R. 2006. Ca2+ signalling and pancreatitis: effects of alcohol, bile and coffee. Trends Pharmacol. Sci. 27, 113–120. (doi:10.1016/j.tips.2005.12.006) [DOI] [PubMed] [Google Scholar]
- 26.Wen L, et al. 2015. Inhibitors of ORAI1 prevent cytosolic calcium-associated injury of human pancreatic acinar cells and acute pancreatitis in 3 mouse models. Gastroenterology 149, 481–492. (doi:10.1053/j.gastro.2015.04.015) [DOI] [PMC free article] [PubMed] [Google Scholar]
- 27.Parekh AB, Putney JW Jr. 2005. Store-operated calcium channels. Physiol. Rev. 85, 757–810. (doi:10.1152/physrev.00057.2003) [DOI] [PubMed] [Google Scholar]
- 28.Hegyi P. 2016. Blockade of calcium entry provides a therapeutic window in acute pancreatitis. J. Physiol. 594, 257 (doi:10.1113/jp271710) [DOI] [PMC free article] [PubMed] [Google Scholar]
- 29.Masamune A, Kikuta K, Watanabe T, Satoh K, Satoh A, Shimosegawa T. 2008. Pancreatic stellate cells express toll-like receptors. J. Gastroenterol. 43, 352–362. (doi:10.1007/s00535-008-2162-0) [DOI] [PubMed] [Google Scholar]
- 30.Palmer RMJ, Ferrgie AG, Moncada S. 1987. Nitric oxide release accounts for the biological activity of endothelium-derived relaxing factor. Nature 327, 524–526. (doi:10.1038/327524a0) [DOI] [PubMed] [Google Scholar]
- 31.Palmer RMJ, Aston DS, Moncada S. 1988. Vascular endothelial cells synthesize nitric oxide from L-arginine. Nature 333, 664–666. (doi:10.1038/333664a0) [DOI] [PubMed] [Google Scholar]
- 32.Won JH, Zhang Y, Ji B, Logsdon CD, Yule DI. 2011. Phenotypic changes in mouse pancreatic stellate cell Ca2+ signaling events following activation in culture and in a disease model of pancreatitis. Mol. Biol. Cell 22, 421–436. (doi:10.1091/mbc.E10-10-0807) [DOI] [PMC free article] [PubMed] [Google Scholar]
- 33.Gryshchenko O, Gerasimenko JV, Gerasimenko OV, Petersen OH. 2016. Ca2+ signals mediated by bradykinin type 2 receptors in normal pancreatic stellate cells can be inhibited by specific Ca2+ channel blockade. J. Physiol. 594, 281–293. (doi:10.1113/JP271468) [DOI] [PMC free article] [PubMed] [Google Scholar]
- 34.Voronina S, Longbottom R, Sutton R, Petersen OH, Tepikin A. 2002. Bile acids induce calcium signals in mouse pancreatic acinar cells: implications for bile-induced pancreatic pathology. J. Physiol. 540, 49–55. (doi:10.1113/jphysiol.2002.017525) [DOI] [PMC free article] [PubMed] [Google Scholar]
- 35.Gerasimenko JV, Flowerdew SE, Voronina SG, Sukhomlin TK, Tepikin AV, Petersen OH, Gerasimenko OV. 2006. Bile acids induce Ca2+ release from both the endoplasmic reticulum and acidic intracellular calcium stores through activation of inositol trisphosphate receptors and ryanodine receptors. J. Biol. Chem. 281, 40 154–40 163. (doi:10.1074/jbc.M606402200) [DOI] [PubMed] [Google Scholar]
- 36.Perides G, van Acker GJD, Laukkarinen JM, Steer ML. 2010. Experimental acute biliary pancreatitis induced by retrograde infusion of bile acids into the mouse pancreatic duct. Nat. Protoc. 5, 335–341. (doi:10.1038/nprot.2009.243) [DOI] [PubMed] [Google Scholar]
- 37.Laukkarinen JM, van Acker GJD, Weiss ER, Steer ML, Perides G. 2007. A mouse model of acute biliary pancreatitis induced by retrograde pancreatic duct infusion of Na-taurocholate. Gut 56, 1590–1598. (doi:10.1136/gut.2007.124230) [DOI] [PMC free article] [PubMed] [Google Scholar]
- 38.Muili KA, et al. 2013. Bile acids induce pancreatic acinar cell injury and pancreatitis by activating calcineurin. J. Biol. Chem. 288, 570–580. (doi:10.1074/jbc.M112.428896) [DOI] [PMC free article] [PubMed] [Google Scholar]
- 39.Wakui M, Osipchuk YV, Petersen OH. 1990. Receptor-activated cytoplasmic Ca2+ spiking mediated by inositol trisphosphate is due to Ca2+-induced Ca2+ release. Cell 63, 1025–1032. (doi:10.1016/0092-8674(90)90505-9) [DOI] [PubMed] [Google Scholar]
- 40.Toescu EC, O'Neill SC, Petersen OH, Eisner DA. 1992. Caffeine inhibits the agonist-evoked cytosolic Ca2+ signal in mouse pancreatic acinar cells by blocking inositol trisphosphate production. J. Biol. Chem. 267, 23 467–23 470. [PubMed] [Google Scholar]
- 41.Huang W, et al. 2015. Caffeine protects against experimental acute pancreatitis by inhibition of inositol 1,4,5-trisphosphate receptor-mediated Ca2+ release. Gut. (doi:10.1136/gutjnl-2015-309363) [DOI] [PMC free article] [PubMed] [Google Scholar]
- 42.Laszlo F, Evans SM, Whittle BJ. 1995. Aminoguanidine inhibits both constitutive and inducible nitric oxide synthase isoforms in rat intestinal microvasculature in vivo. Eur. J. Pharmacol. 272, 169–175. (doi:10.1016/0014-2999(94)00637-M) [DOI] [PubMed] [Google Scholar]
- 43.Hegyi P, Rakonczay Z Jr. 2011. The role of nitric oxide in the physiology and pathophysiology of the exocrine pancreas. Antioxid. Redox Signal. 15, 2723–2741. (doi:10.1089/ars.2011.4063) [DOI] [PubMed] [Google Scholar]
- 44.Camargo EA, et al. 2014. Inhibition of inducible nitric oxide synthase-derived nitric oxide as a therapeutical target for acute pancreatitis induced by secretory phospholipase A2. Eur. J. Pain. 18, 691–700. (doi:10.1002/j.1532-2149.2013.00414.x) [DOI] [PubMed] [Google Scholar]
- 45.Chvanov M, Gerasimenko OV, Petersen OH, Tepikin AV. 2006. Calcium-dependent release of NO from intracellular s-nitrosothiols. EMBO J. 25, 3024–3032. (doi:10.1038/sj.emboj.7601207) [DOI] [PMC free article] [PubMed] [Google Scholar]
- 46.Sun Y, Yu H, Zheng D, Cao Q, Wang Y, Harris D, Wang Y. 2011. Sudan black B reduces autofluorescence in murine renal tissue. Arch. Pathol. Lab. Med. 135, 1335–1342. (doi:10.5858/arpa.2010-0549-OA) [DOI] [PubMed] [Google Scholar]
- 47.Droge W. 2002. Free radicals in the physiological control of cell function. Physiol. Rev. 82, 47–95. (doi:10.1152/physrev.00018.2001) [DOI] [PubMed] [Google Scholar]
- 48.Coombes E, Jiang J, Chu XP, Inoue K, Seeds J, Branigan D, Simon RP, Xiong ZG. 2011. Pathophysiologically relevant levels of hydrogen peroxide induce glutamate-independent neurodegeneration that involves activation of transient receptor potential melastatin 7 channels. Antioxid. Redox Signal. 14, 1815–1827. (doi:10.1089/ars.2010.3549) [DOI] [PMC free article] [PubMed] [Google Scholar]
- 49.Petersen OH, Tepikin AV. 2008. Polarized calcium signaling in exocrine gland cells. Annu. Rev. Physiol. 70, 273–299. (doi:10.1146/annurev.physiol.70.113006.100618) [DOI] [PubMed] [Google Scholar]
- 50.Hofmann AF. 1999. Bile acids: the good, the bad, and the ugly. News. Physiol. Sci. 14, 24–29. [DOI] [PubMed] [Google Scholar]
- 51.Belgorosky D, Langle Y, Prack Mc Cormick B, Colombo L, Sandes E, Eijan AM. 2014. Inhibition of nitric oxide is a good therapeutic target for bladder tumors that express iNOS. Nitric Oxide 36, 11–18. (doi:10.1016/j.niox.2013.10.010) [DOI] [PubMed] [Google Scholar]
- 52.McCartney-Francis N, Allen JB, Mizel DE, Albina JE, Xie QW, Nathan CF, Wahl SM. 1993. Suppression of arthritis by an inhibitor of nitric oxide synthase. J. Exp. Med. 178, 749–754. (doi:10.1084/jem.178.2.749) [DOI] [PMC free article] [PubMed] [Google Scholar]
- 53.Wang Y, Lawson JA, Jaeschke H. 1998. Differential effect of 2-aminoethyl-isothiourea, an inhibitor of the inducible nitric oxide synthase, on microvascular blood flow and organ injury in models of hepatic ischemia-reperfusion and endotoxemia. Shock 10, 20–25. (doi:10.1097/00024382-199807000-00004) [DOI] [PubMed] [Google Scholar]
- 54.Rangan GK, Wang Y, Harris DC. 2001. Pharmacologic modulators of nitric oxide exacerbate tubulointerstitial inflammation in proteinuric rats. J. Am. Soc. Nephrol. 12, 1696–1705. [DOI] [PubMed] [Google Scholar]
- 55.Buchwalow I, Schnekenburger J, Tiemann K, Samoilova V, Bankfalvi A, Poremba C, Schleicher C, Neumann J, Boecker W. 2013. L-Arginine-NO-cGMP signalling pathway in pancreatitis. Sci. Rep. 3, 1899 (doi:10.1038/srep01899) [DOI] [PMC free article] [PubMed] [Google Scholar]
- 56.Bachem MG, et al. 1998. Identification, culture, and characterization of pancreatic stellate cells in rats and humans. Gastroenterology 115, 421–432. (doi:10.1016/S0016-5085(98)70209-4) [DOI] [PubMed] [Google Scholar]
- 57.Apte MV, Haber PS, Applegate TL, Norton ID, McCaughan GW, Korsten MA, Pirola RC, Wilson JS. 1998. Periacinar stellate shaped cells in rat pancreas: identification, isolation, and culture. Gut 43, 128–133. (doi:10.1136/gut.43.1.128) [DOI] [PMC free article] [PubMed] [Google Scholar]
- 58.Glynne PA, Darling KE, Picot J, Evans TJ. 2002. Epithelial inducible nitric-oxide synthase is an apical EBP50-binding protein that directs vectorial nitric oxide output. J. Biol. Chem. 277, 33 132–33 138. (doi:10.1074/jbc.M205764200) [DOI] [PubMed] [Google Scholar]
- 59.Parekh AB. 2011. Decoding cytosolic Ca2+ oscillations. Trends Biochem. Sci. 36, 78–87. (doi:10.1016/j.tibs.2010.07.013) [DOI] [PubMed] [Google Scholar]
- 60.Gryshchenko O, Gerasimenko JV, Gerasimenko OV, Petersen OH. 2016. Calcium signalling in pancreatic stellate cells: mechanisms and potential roles. Cell Calcium 59, 140–144. (doi:10.1016/j.ceca.2016.02.003) [DOI] [PubMed] [Google Scholar]
Associated Data
This section collects any data citations, data availability statements, or supplementary materials included in this article.
Supplementary Materials
Data Availability Statement
Figures S1–S4 supporting this article have been uploaded as part of the electronic supplementary material. Datasets for this article have been collected and processed using Leica LAS AF software (https://leica-microsystems.com/products/microscope-software) needed to open the original files. Other supporting files will be made available in the Research section via: https://www.cardiff.ac.uk/people/view/108900-gerasimenko-oleg, and Dryad Digital Repository (electronic supplementary material, video S1): http://dx.doi.org/10.5061/dryad.4rb47.