

Abstract
Background
Idiopathic pulmonary fibrosis (IPF) can be diagnosed confidently and non-invasively when clinical and computed tomography (CT) criteria are met. Many do not meet these criteria due to absence of CT honeycombing. We investigated predictors of IPF and combinations allowing accurate diagnosis in individuals without honeycombing.
Methods
We utilized prospectively collected clinical and CT data from patients enrolled in the Lung Tissue Research Consortium. Included patients had no honeycombing, no connective tissue disease, underwent diagnostic lung biopsy, and had CT pattern consistent with fibrosing ILD (n=200). Logistic regression identified clinical and CT variables predictive of IPF. The probability of IPF was assessed at various cut-points of important clinical and CT variables.
Results
A multivariable model adjusted for age and gender found increasingly extensive reticular densities (OR 2.93, CI 95% 1.55–5.56, p=0.001) predicted IPF, while increasing ground glass densities predicted a diagnosis other than IPF (OR 0.55, CI 95% 0.34–0.89, p=0.02). The model-based probability of IPF was 80% or greater in patients with age at least 60 years and extent of reticular density one-third or more of total lung volume; for patients meeting or exceeding these clinical thresholds the specificity for IPF is 96% (CI 95% 91–100%) with 21 of 134 (16%) biopsies avoided.
Conclusions
In patients with suspected fibrotic ILD and absence of CT honeycombing, extent of reticular and ground glass densities predict a diagnosis of IPF. The probability of IPF exceeds 80% in subjects over age 60 years with one-third of total lung having reticular densities.
INTRODUCTION
Idiopathic pulmonary fibrosis (IPF) is a fibrotic interstitial lung disease (ILD) without known cause.[1] The prognosis is worse than other ILDs[2–4] and the approach to therapy different with recent data highlighting the negative impact of antioxidant/immunosuppressive therapy[5] and potential benefit of pirfenidone[6, 7] or nintedanib.[8, 9] Thus an accurate diagnosis of IPF is important for prognosis and therapeutic decisions.
The diagnosis of IPF requires exclusion of known causes of ILD and identification of a pattern of usual interstitial pneumonia (UIP) on high resolution computed tomography (HRCT) or surgical lung biopsy.[1, 10] Some patients with IPF do not meet these criteria because of a lack of HRCT honeycombing;[2, 11, 12] this group is heavily represented among patients undergoing surgical biopsy for suspected IPF in the modern era.[13] Lung biopsy is an invasive procedure with high cost, the possibility of complications, and is not always feasible.[14, 15] Previous studies indicate that among patients suspected of having fibrotic ILD, a HRCT pattern consistent with UIP but not meeting full criteria (termed “possible UIP pattern”)[10] remains predictive of histopathologic UIP.[16, 17] The addition of clinical parameters, particularly increasing age, to HRCT pattern may allow histopathologic UIP to reliably be identified non-invasively in a larger group of patients.[18] Here, we evaluate clinical and HRCT variables as predictors of IPF in patients having fibrotic ILD without the radiologic UIP Pattern, specifically lacking honeycombing. Some results of this study were reported in abstract form at the Pulmonary Fibrosis Foundation Summit on November 12, 2015 in Washington, DC.
MATERIALS AND METHODS
The Lung Tissue Research Consortium (LTRC) enrolled patients with ILD expected to undergo lung tissue sampling (diagnostic surgical lung biopsy, lung transplantation, or lobectomy) and prospectively collected lung tissue, clinical, and HRCT data (http://www.ltrcpublic.com/). Data from ILD patients enrolled 03/01/2005-9/15/2014 (n=937) were obtained. Included patients underwent diagnostic surgical lung biopsy, had no radiologic honeycombing, no connective tissue disease, and HRCT pattern of NSIP, UIP/IPF, chronic hypersensitivity pneumonia (HP), or uncharacterized fibrosis. Figure 1 displays selection criteria in a flow diagram; 200 patients were included with IPF prevalence of 67.0%. The institutional review boards at participating centers approved the LTRC study; consent allowed further use of de-identified data.
Figure 1. Inclusion Criteria Consort Diagram.
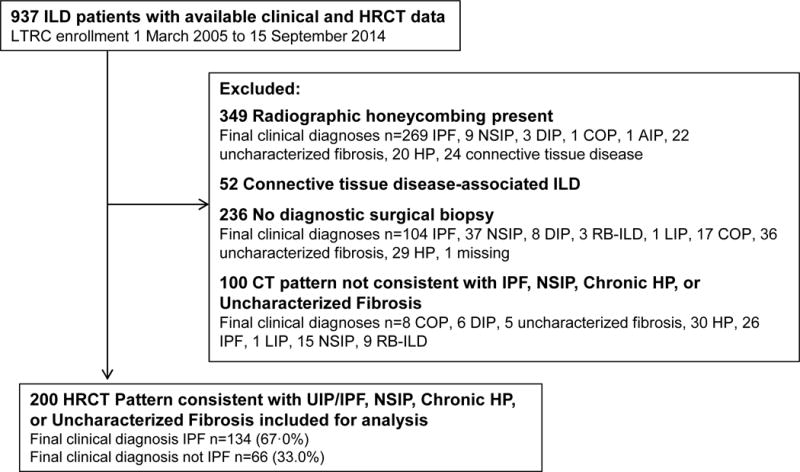
Displayed are the numbers of patients excluded from this analysis and their final clinical diagnoses. ILD is interstitial lung disease, IPF idiopathic pulmonary fibrosis, UIP usual interstitial pneumonia, NSIP nonspecific interstitial pneumonia, DIP desquamative interstitial pneumonia, COP cryptogenic organizing pneumonia, AIP acute interstitial pneumonitis, HP hypersensitivity pneumonia, LIP lymphocytic interstitial pneumonia, RB-ILD respiratory bronchiolitis with interstitial lung disease.
HRCT Data
Images were obtained locally and interpreted centrally by radiologists trained in semi-quantitative scoring of parenchymal findings. Of interest were the presence and extent of bronchiectasis, consolidation, ground glass density, mosaic attenuation, air trapping, reticular density, micronodules, and septal thickening, as previously defined.[19] Abnormalities were scored as 0 (no involvement), 1 (1–25% involvement), 2 (26–50%), 3 (51–75%) or 4 (>75% involvement), with scores given separately to central and peripheral regions of the right upper, middle, and lower lobes, and left upper lobe, lingula, and lower lobe. Regional scores were summed and divided by 12 to obtain a whole-lung composite value (termed “composite”) between 0 and 4 corresponding total lung involvement for each feature. Figure 2 exemplifies mild, moderate, and severe reticular densities. Axial (including peripheral/subpleural, central/axial, evenly distributed, or none) and craniocaudal (including upper lung predominant, lower lung predominant, diffuse, or none) distribution of overall interstitial abnormality was documented. The assignment of the overall geographic distribution of disease was not strictly based on measured distance from the pleura or in relation to intra-thoracic structures such as the main carina, but rather left to the overall impression of the radiologist as previously defined for assessment of emphysema distribution.[20] Radiologists documented overall HRCT pattern, with UIP, NSIP, chronic HP, and uncharacterized fibrosis included, representing subjects with “fibrosing interstitial lung disease”.[21] Designation of the HRCT pattern was at the discretion of the interpreting radiologist, who was blinded to clinical data during image review, with definitions not specified in advance by the LTRC but based on available guidelines and publications.[1, 10, 22–24]
Figure 2. Examples of Mild, Moderate, and Severe Reticular Densities on High Resolution Computed Tomography.
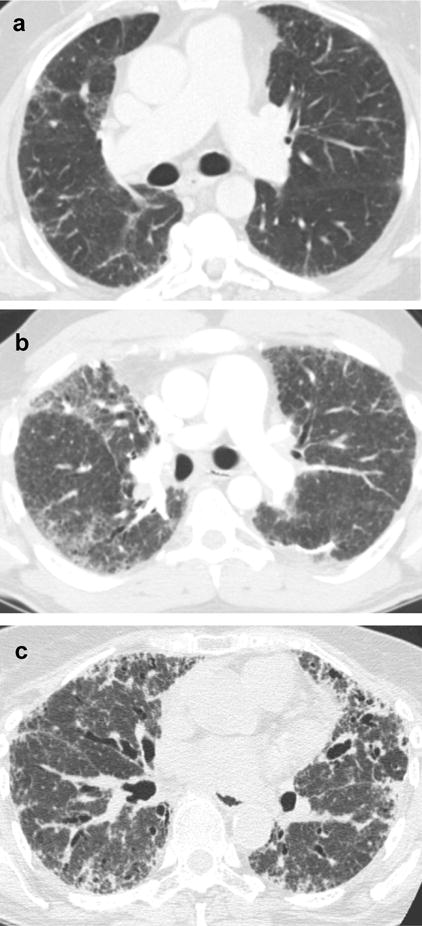
In panel a, mild reticular densities (white arrow marks example) occupy 25% or less of involved lobes, corresponding to a whole lung composite of 1 if all lobes are involved to a mild degree. In panel b, moderate reticular densities (white arrows mark examples) occupy 26–50% of involved lobes, corresponding to a whole lung composite between 1 and 2 if all lobes are involved to a moderate degree. In panel c severe reticular densities (white arrows mark examples) occupy 50% or more of involved lobes, corresponding to a whole lung composite of 2 or more if all lobes are involved to a severe degree.
Clinical Diagnosis Determination
The outcome of interest is a final clinical diagnosis of IPF, determined by the LTRC investigator at the referring center (Mayo Clinic Rochester, University of Michigan, University of Colorado, University of Pittsburgh, and Temple University). Multidisciplinary diagnosis discussion (with review of pertinent clinical, laboratory, histopathologic, and radiologic data) was standard at all centers, and investigators followed current guidelines in assigning ILD diagnoses.[1, 10, 22–25]
Because our goal was to evaluate clinical and radiologic characteristics allowing for confirmation of an IPF diagnosis without lung biopsy in patients with indeterminate radiologic findings under current guidelines[10], test characteristics are evaluated under a two-stage diagnostic process. First, clinical and radiologic characteristics are reviewed and IPF probability estimated. Second, patients without high probability proceed to a biopsy with IPF confirmed or refuted. The process is shown graphically in Figure 3. Under current diagnostic guidelines, patients without honeycombing at HRCT are generally placed in the “Probability of IPF Not High” category and diagnostic lung biopsy considered.
Figure 3. Two-Stage IPF Diagnosis Method.
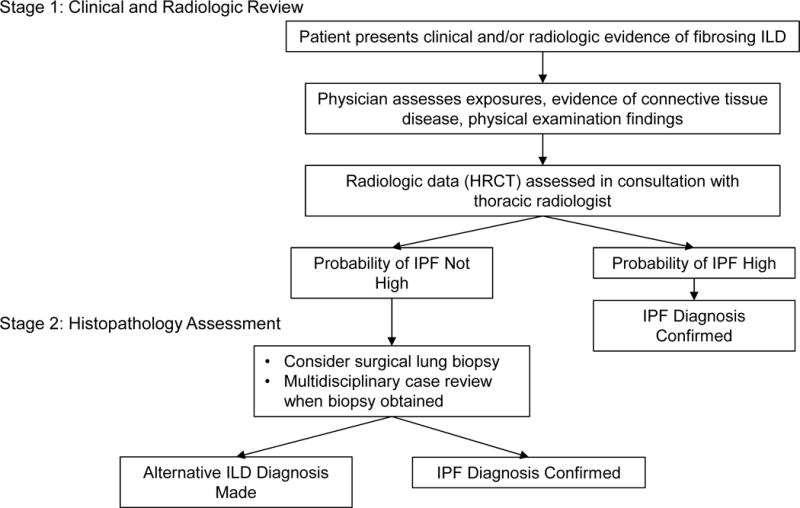
Presented is an algorithm that could be applied when determining the diagnosis in a patient with suspected fibrosing ILD. During Stage One clinical and radiologic data are reviewed in the context of current guidelines for diagnosis of IPF and other ILDs.[1, 1010] When the probability of IPF is felt to be high after review of clinical and radiologic data, the diagnosis is confirmed. If the probability of IPF is not high, the treating physician considers the utility and feasibility of a surgical biopsy to review at Stage Two. If a biopsy is obtained it is reviewed in a multidisciplinary setting to confirm the final diagnosis of IPF or other ILD.
Statistical Methods
Analysis was performed using SAS 9.4 and R 3.2.1. Demographics were assessed with means and standard deviations (SD) for continuous variables. Skewed continuous HRCT features were summarized using medians and interquartile range. Numbers and percentages are displayed for categorical variables. Assessment of differences in presence and extent of HRCT features between IPF and non-IPF subjects utilized the Wilcoxon Rank-Sum test for continuous variables with categorical comparisons via Pearson’s chi-squared test or Fisher’s Exact test, as appropriate.[26–28] Univariable logistic regression estimated IPF odds ratios (OR) corresponding to 5-year increases in age, male vs female gender, current or former versus never smokers, 10% increase in percent predicted forced vital capacity (FVC), and 1-unit increase in whole-lung composite for HRCT features.[29] Multivariable logistic regression models forced adjustment for gender and age, but otherwise used forward selection to detect variables significantly associated with IPF diagnosis.[30] The statistical significance of interaction terms and linear spline terms for continuous predictors were assessed via an additional forward selection step. Model selection was assessed with and without inclusion of n=6 additional patients showing a DIP pattern at HRCT. Finally, model-based IPF diagnosis probabilities were calculated for a grid of age values by the most predictive covariate from the final multivariable model with remaining predictors set at average (gender) or median (HRCT predictor) values for those subjects aged 55 years or older. IPF probabilities are given for patients with risk factors at the midpoint of the grid cell boundaries, and for minimum and maximum IPF risk within boundaries. Model fit is measured via the c-index. Specificity is described under the assumption of a two-stage IPF diagnostic metric (see Figure 3). The number and percent of biopsies avoided at various probability thresholds based on our dataset was calculated.
RESULTS
Table 1 displays demographics, proportions of patients with each HRCT pattern, and final clinical diagnoses. The mean age was 64.5 years (SD 8.5) with 52% males, 53% ever-smokers, and mean percent-predicted FVC of 69.2% (SD 15.4). Table 2 summarizes the presence, extent and distribution of HRCT features for all patients, and for IPF and not-IPF groups. Univariable logistic regression analysis results are shown in Table 3. Higher reticular densities (OR 3.29, CI 95% 1.77–6.12, p=0.0002) and bronchiectasis (OR 6.51, CI 95% 1.45–29.12, p=0.01) composites were associated with a diagnosis of IPF, while increasing ground glass composite (OR 0.50, CI 95% 0.31–0.79, p=0.003) with a diagnosis other than IPF.
Table 1.
Patient Characteristics
| All n=200 |
IPF n=134 |
Not IPF n=66 |
p** | |
|---|---|---|---|---|
|
| ||||
| Age (y), Mean (SD) | 64.5 (8.5) | 65.2 (7.2) | 63.1 (10.4) | 0.14 |
|
| ||||
| Male, No. (%) | 104 (52.0) | 73 (54.5) | 31 (47.0) | 0.32 |
|
| ||||
| Race, No. (%) | ||||
| Black | 7 (3.5) | 6 (4.5) | 1 (1.5) | 0.43 |
| White | 184 (92.0) | 120 (89.6) | 64 (97.0) | 0.07 |
| Other | 9 (4.5) | 8 (6.0) | 1 (1.5) | 0.28 |
|
| ||||
| Ever-Smoker, No. (%)* | 106 (53.0) | 67 (51.9) | 39 (59.1) | 0.34 |
|
| ||||
| FVC %-predicted, Mean (SD)* | 69.2 (15.4) | 68.1 (15.2) | 71.4 (15.9) | 0.16 |
|
| ||||
| DLCO %-predicted, Mean (SD)* | 57.5 (17.2) | 55.4 (16.5) | 62.1 (18.0) | 0.02 |
|
| ||||
| Primary HRCT Pattern, No. (%) | ||||
| IPF/UIP | 12 (6.0) | 10 (7.5) | 2 (3.0) | 0.34 |
| NSIP | 135 (67.5) | 94 (70.2) | 41 (62.1) | 0.25 |
| Chronic HP | 18 (9.0) | 10 (7.5) | 8 (12.1) | 0.28 |
| Uncharacterized Fibrosis | 35 (17.5) | 20 (14.9) | 15 (22.7) | 0.17 |
|
| ||||
| Final Clinical Diagnosis, No. (%) | – | – | – | |
| Idiopathic Pulmonary Fibrosis | 134 (67.0) | |||
| Nonspecific Interstitial Pneumonitis | 18 (9.0) | |||
| Hypersensitivity Pneumonia | 33 (16.5) | |||
| Uncharacterized Fibrosis | 10 (5.0) | |||
| Desquamative Interstitial Pneumonia | 2 (1.0) | |||
| Cryptogenic Organizing Pneumonia | 3 (1.5) | |||
No. of subjects with missing data: 5 smoking status (patient non-reporting on questionnaire), 3 FVC% (test not performed or reported by referring center), and 23 DLCO% (test not performed or reported by referring center).
p-values compare IPF to not IPF patients.
Abbreviations: FVC forced vital capacity, DLCO diffusing capacity of the lung for carbon monoxide, HRCT high resolution computed tomography, IPF idiopathic pulmonary fibrosis, UIP usual interstitial pneumonia, NSIP nonspecific interstitial pneumonia, HP hypersensitivity pneumonia.
Table 2.
Summary of HRCT Findings
| Select HRCT Feature | All (n=200) | IPF (n=134) | Non-IPF (n=66) | P# |
|---|---|---|---|---|
|
| ||||
| Reticular density* | 0.83 (0.50–1.25) | 1.00 (0.58–1.33) | 0.63 (0.17–1.00) | 0.0001 |
| No (%) | 184 (92.0) | 128 (95.5) | 56 (84.9) | 0.009 |
| Ground glass* | 0.17 (0.00–0.83) | 0.17 (0.00–0.67) | 0.50 (0.00–1.25) | 0.02 |
| No (%) | 121 (60.5) | 77 (57.5) | 44 (66.7) | 0.21 |
| Bronchiectasis* | 0.17 (0.00–0.33) | 0.17 (0.00–0.33) | 0.17 (0.00–0.25) | 0.01 |
| No (%) | 135 (67.5) | 97 (72.4) | 38 (57.6) | 0.04 |
| Mosaic attenuation* | 0.00 (0.00–0.00) | 0.00 (0.00–0.00) | 0.00 (0.00–0.00) | 0.27 |
| No (%) | 26 (13.0) | 15 (11.2) | 11 (16.7) | 0.28 |
| Septal thickening* | 0.00 (0.00–0.00) | 0.00 (0.00–0.00) | 0.00 (0.00–0.00) | 0.49 |
| No (%) | 40 (20.0) | 29 (21.6) | 11 (16.7) | 0.41 |
| Micronodules* | 0.00 (0.00–0.00) | 0.00 (0.00–0.00) | 0.00 (0.00–0.00) | 0.03 |
| No (%) | 9 (4.5) | 6 (9.1) | 3 (2.2) | 0.06 |
| Axial distribution, No. (%) | ||||
| Peripheral/subpleural | 164 (82.0) | 114 (85.1) | 50 (75.8) | 0.11 |
| Central | 0 | 0 | 0 | – |
| Evenly distributed | 33 (16.5) | 19 (14.2) | 14 (21.2) | 0.21 |
| None | 3 (1.5) | 1 (0.8) | 2 (3.0) | 0.25 |
| Craniocaudal distribution, No. (%) | ||||
| Upper predominant | 6 (3.0) | 4 (3.0) | 2 (3.0) | 1.00 |
| Lower predominant | 122 (61.0) | 77 (57.5) | 45 (68.2) | 0.14 |
| Diffuse | 69 (34.5) | 52 (38.8) | 17 (25.8) | 0.07 |
| None | 3 (1.5) | 1 (0.8) | 2 (3.0) | 0.25 |
Shown is the median (IQR) of the HRCT composite for the referenced HRCT finding, on a scale of 0–4, with the range for the entire cohort. No. (%) cited indicates the number of subjects in each group with whole-lung composite > 0.
P generated via Wilcoxon Rank Sum test (continuous variables) or Fisher’s Exact test (categorical variables), comparing IPF to Non-IPF groups.
Table 3.
Univariable Logistic Regression Model
| Predictor | OR | 95% CI | P |
|---|---|---|---|
|
| |||
| Male Gender | 1.35 | 0.75–2.44 | 0.32 |
|
| |||
| Age, per 5 years | 1.16 | 0.97–1.38 | 0.10 |
|
| |||
| Ever-Smoker | 0.69 | 0.38–1.26 | 0.23 |
|
| |||
| FVC%, Per 10% | 0.87 | 0.72–1.06 | 0.16 |
|
| |||
| Reticular Densities* | 3.29 | 1.77–6.12 | 0.0002 |
|
| |||
| Ground Glass* | 0.50 | 0.31–0.79 | 0.003 |
|
| |||
| Bronchiectasis* | 6.51 | 1.45–29.12 | 0.01 |
|
| |||
| Mosaic Attenuation* | 0.58 | 0.24–1.41 | 0.23 |
|
| |||
| Air Trapping* | 0.56 | 0.17–1.86 | 0.35 |
|
| |||
| Septal Thickening* | 1.07 | 0.38–3.00 | 0.90 |
|
| |||
| Consolidation* | 1.94 | 0.20–18.71 | 0.57 |
|
| |||
| Micronodules* | 0.28 | 0.02–3.78 | 0.34 |
|
| |||
| Axial distribution peripheral/subpleural | 1.82 | 0.87–3.81 | 0.11 |
|
| |||
| Craniocaudal distribution | |||
| Upper lobe | 0.99 | 0.18–5.52 | 0.99 |
| Lower lobe | 0.63 | 0.34–1.17 | 0.15 |
| Diffuse | 1.83 | 0.95–3.51 | 0.07 |
The average HRCT whole-lung composites for each HRCT finding, on a scale of 0–4, were the predictor variables of interest; cited OR corresponds to an increase in the whole-lung composite score by 1.
Abbreviations: IPF idiopathic pulmonary fibrosis, FVC% percent predicted forced vital capacity, HRCT high resolution computed tomography.
The final multivariable model is shown in Table 4. After adjusting for age and gender, higher reticular densities continued to be significantly associated with an IPF diagnosis (OR 2.93, CI 95% 1.55–5.56, p=0.001), and increasing ground glass continued to be associated with a diagnosis other than IPF (OR 0.55, CI 95% 0.34–0.89, p=0.02). Results of univariable and multivariable prediction of IPF when including the n=9 subjects with DIP at HRCT are found in the online supplement (see e-Tables 1, 2). Strength and direction of predictors selected for the final multivariable model changed only minimally when adding these subjects.
Table 4.
Multivariable Regression Model
| Predictor | OR | 95% CI | P |
|---|---|---|---|
| Male Gender | 1.01 | 0.53–1.92 | 0.98 |
| Age, per 5 years | 1.10 | 0.92–1.32 | 0.31 |
| Ground Glass* | 0.55 | 0.34–0.89 | 0.02 |
| Reticular Densities* | 2.93 | 1.55–5.56 | 0.001 |
The average HRCT whole-lung composites for each HRCT finding, on a scale of 0–4, were the predictor variables of interest; cited OR corresponds to an increase in the whole-lung composite score by 1.
Abbreviations: HRCT high resolution computed tomography, IPF idiopathic pulmonary fibrosis
Table 5 gives model-based IPF diagnosis probabilities based on a patient being at the center of various age and reticular density composite ranges. We chose to show these data for subjects over age 55 years due to a relative paucity of data in most grid cells at lower ages. For subjects in the 60–65 year age range with reticular composite of 1.5 and higher, the probability of IPF consistently exceeds 80%.
Table 5.
Probability of IPF in Subjects Aged 60 Years and Older
| Age | Reticular Density Composite | IPF Probability (Range)* | No. Subjects Contributing Data** |
|---|---|---|---|
|
| |||
| 55–60 | 0.0 – 0.5 | 0.55 (0.47–0.62) | 9 |
| 0.5 – 1.0 | 0.67 (0.60–0.74) | 6 | |
| 1.0 – 1.5 | 0.78 (0.72–0.83) | 5 | |
| 1.5 – 2.0 | 0.86 (0.82–0.89) | 6 | |
| 2.0 – 2.5 | 0.91 (0.88–0.93) | 0 | |
| 2.5 – 3.0 | 0.95 (0.93–0.96) | 0 | |
|
| |||
| 60—65 | 0.0 – 0.5 | 0.57 (0.49–0.65) | 8 |
| 0.5 – 1.0 | 0.69 (0.62–0.76) | 11 | |
| 1.0 – 1.5 | 0.80 (0.74–0.84) | 12 | |
| 1.5 – 2.0 | 0.87 (0.83–0.90) | 4 | |
| 2.0 – 2.5 | 0.92(0.89–0.94) | 2 | |
| 2.5 – 3.0 | 0.95 (0.93–0.96) | 0 | |
|
| |||
| 65–70 | 0.0 – 0.5 | 0.59 (0.52–0.67) | 13 |
| 0.5 – 1.0 | 0.71 (0.65–0.77) | 23 | |
| 1.0 – 1.5 | 0.81 (0.76–0.85) | 24 | |
| 1.5 – 2.0 | 0.88 (0.84–0.91) | 5 | |
| 2.0 – 2.5 | 0.93 (0.90–0.95) | 0 | |
| 2.5 – 3.0 | 0.96 (0.94–0.97) | 0 | |
|
| |||
| 70–75 | 0.0 – 0.5 | 0.62 (0.54–0.69) | 4 |
| 0.5 – 1.0 | 0.73 (0.67–0.79) | 9 | |
| 1.0 – 1.5 | 0.82 (0.77–0.87) | 8 | |
| 1.5 – 2.0 | 0.89 (0.85–0.92) | 9 | |
| 2.0 – 2.5 | 0.93 (0.91–0.95) | 1 | |
| 2.5 – 3.0 | 0.96 (0.95–0.97) | 0 | |
|
| |||
| 75–80 | 0.0 – 0.5 | 0.64 (0.56–0.71) | 1 |
| 0.5 – 1.0 | 0.75 (0.69–0.81) | 5 | |
| 1.0 – 1.5 | 0.84 (0.79–0.88) | 4 | |
| 1.5 – 2.0 | 0.90 (0.87–0.92) | 1 | |
| 2.0 – 2.5 | 0.94 (0.92–0.95) | 1 | |
| 2.5 – 3.0 | 0.96 (0.95–0.97) | 0 | |
|
| |||
| 80–85 | 0.0 – 0.5 | 0.66 (0.59–0.73) | 2 |
| 0.5 – 1.0 | 0.77 (0.71–0.82) | 1 | |
| 1.0 – 1.5 | 0.85 (0.81–0.89) | 2 | |
| 1.5 – 2.0 | 0.91 (0.88–0.93) | 0 | |
| 2.0 – 2.5 | 0.94 (0.92–0.96) | 1 | |
| 2.5 – 3.0 | 0.97 (0.95–0.98) | 0 | |
The cited probabilities are based on the final model in Table 4, and given for patients with risk factors at the midpoint of the grid cell boundaries for age and reticular density composite, and with ground glass at the median for the overall cohort; Range is the probability range for patients with the minimum and maximum IPF risk within the grid cell boundaries.
The number of subjects within the specified age and reticular density composite ranges, from the entire cohort.
When the two-stage diagnostic metric is based on IPF diagnosis confirmation with model IPF probability of 80% or more, the c-index for model prediction is 0.90 with specificity of 0.86 (CI 95% 0.78–0.95) for a diagnosis of IPF, avoiding 38 of 134 (28%) biopsies in IPF patients in our cohort as opposed to the number done using current diagnostic guidelines. When the two-stage diagnostic metric is based on IPF diagnosis confirmation with model probability of 90% or more, the c-index is 0.99 with specificity of 1 (CI 95% 1.0–1.0), and 3 of 134 (2%) biopsies avoided in IPF patients. At model probability of 70% or more the c-index is 0.80 with specificity of 0.64 (CI 95% 0.52–0.75), and 78 of 134 (58%) biopsies avoided. Within our dataset, 47 subjects had a model-based IPF probability of 80% or greater. Nine of these did not have IPF (false positive rate of 0.14). Their final clinical diagnoses were chronic HP (n=7), NSIP (n=1), and COP (n=1).
Model-based probability of IPF of 80% or more corresponds to thresholds of age at least 60 years and reticular densities composite of 1.5 or higher (roughly one-third of the lung having reticular densities, see Figure 2). When the two-stage diagnostic is based on these clinical thresholds, c-index is 0.95 with specificity of 0.96 (CI 95% 0.91–1.0) for IPF and 21 of 134 (16%) biopsies avoided.
DISCUSSION
In this study we document that increasing reticular densities predict IPF in subjects with consistent but non-diagnostic fibrosis at HRCT (i.e. fibrotic changes without honeycombing). In subjects aged 60 years or older and with reticular densities occupying at least one-third of lung volume, the probability of IPF exceeds 80%, with a specificity for IPF diagnosis of 96%.
Following release of 2011 IPF diagnosis guidelines[10] specifying HRCT criteria that, in the appropriate clinical setting, obviate need of surgical biopsy to confirm IPF, research has focused on characterizing individuals with some but not all required HRCT features. Two recent studies investigated the predictive value of a possible or probable UIP HRCT pattern, similarly defined as peripheral and basilar predominant fibrosis with little or no honeycombing and no inconsistent features. These CT patterns predicted pathologic UIP regardless of age or fibrosis extent.[12, 16] Raghu et al found the possible UIP pattern had a 94% PPV for biopsy-confirmed IPF.[12] The patient population was drawn from a clinical therapeutic trial with all subjects diagnosed with IPF by the referring center and overall IPF prevalence of 90% after central review, poorly representative of all patients suspected of having a fibrotic interstitial pneumonia. In our study, IPF prevalence was 67.0% and subjects were included based on need of a diagnostic lung biopsy. A study by Fell et al found that in patients with pathologically confirmed ILDs without radiologic honeycombing, an age threshold of 70 years had a 95% PPV for IPF, and when fibrosis is extensive, a similarly high PPV is seen at age 60–65 years.[18] Our study is in line with these results in a different cohort of patients. Collectively these data suggest extent of fibrosis is important in making an IPF diagnosis.
Patient selection by HRCT pattern increases generalizability of our results. There is significant overlap within fibrosing ILD,[24, 31] and prior studies have focused on differentiation of histologic UIP from NSIP, excluding subjects with diagnoses such as chronic HP or honeycomb lung.[12, 18] Selection based on HRCT pattern better answers the core question of how to identify IPF amongst a larger group with non-diagnostic HRCT findings. Our aim was to select patients with fibrosing ILD. Excluded HRCT patterns were cryptogenic organizing pneumonia (COP), desquamative interstitial pneumonia (DIP), sarcoid, acute interstitial pneumonitis (AIP), respiratory bronchiolitis, lymphoid interstitial pneumonia (LIP), malignancy, acute HP, vasculitis, eosinophilic granuloma, autoimmune disease, and infection. Presence of these patterns generally leads to a different diagnostic algorithm than patterns consistent with fibrosing ILD. Among HRCT patterns that were excluded from our main analysis, DIP pattern is a special case with similarities to NSIP pattern. Six subjects with DIP HRCT pattern otherwise met inclusion criteria. Adding these to prediction models resulted in no changes in IPF prediction.
The NSIP HRCT pattern (sometimes described as bilateral ground glass, reticulation, traction bronchiectasis, and absent honeycombing, often in a lower-lung predominant distribution with sub-pleural sparing) warrants consideration here. A clear definition of this pattern does not exist.[1, 21] We argue, based upon our and others’ results, NSIP pattern designation should be abandoned due to poor specificity for histopathologic NSIP. Many patients with NSIP or possible UIP HRCT patterns have UIP at biopsy thus creating diagnostic confusion when discrepancy exists between HRCT and histopathologic interpretation.[16, 18, 32]
Our study has weaknesses. Experts trained for LTRC radiology core participation analyzed HRCT scans, so findings may not be generalizable to a community-based population.[33] Only one radiologist scored each HRCT so inter-observer variation in interpretation is unassessed. Similar semi-quantitative methods of fibrosis assessment have moderate to good inter-observer agreement.[11, 17, 18, 34]
An important consideration is the method of establishing the final clinical diagnosis. The referring center principal investigator named the diagnosis after review of local clinical, radiology and pathology information. Multidisciplinary discussion was standard at all LTRC centers in assigning ILD diagnoses.[25] Subjects with known connective tissue disease and those with radiologic findings grossly incompatible with fibrotic interstitial pneumonia (i.e. radiologic patterns of COP/BOOP, bronchiolitis, acute HP, etc) were excluded. Centers without access to expert thoracic radiologists, pathologists, ILD physicians, or a mechanism for multidisciplinary case review should apply these results with caution and consider referral when appropriate.
We re-iterate that model-based probabilities of IPF presented in Table 5 are best applied during the initial stage of a 2-stage diagnostic process, with probability estimate contributing to the decision about whether a patient should proceed to a lung biopsy for diagnosis confirmation. We arbitrarily highlight a probability of 80% as “high IPF probability” in citing age and reticular density cut-points leading to IPF diagnosis confirmation in the algorithm presented in Figure 3. In practice, the appropriate probability threshold in deciding a confidence level for diagnosis confirmation at stage one must be tailored to individual patients. If 80% is used, the chance of misdiagnosis is 20%. In a patient fit to undergo a surgical lung biopsy this misdiagnosis risk may be unacceptably high and confirmatory biopsy warranted. A patient erroneously diagnosed with IPF may be treated with antifibrotic drugs which are not specifically tested in fibrosing ILDs other than IPF, and carry risk of side effects. A high rate of misdiagnosis could lead to adverse reactions and additional expense for patients and society. Additionally, our prediction model was helpful (i.e. predicted IPF probability 80% or greater therefore avoiding a biopsy) in just 28% of IPF patients. A large number of patients not identified by that benchmark receive a diagnosis of IPF after a lung biopsy was obtained. While avoidance of 28% of biopsies appears insignificant at a glance, when the population targeted by the model is considered (older patients with more severe lung disease), 28% of biopsies avoided is a fairly robust number.
In conclusion, our study adds to an increasing body of evidence indicating that in ILD patients with HRCT fibrosis but no honeycombing, IPF can be confidently diagnosed without a surgical lung biopsy in selected patients. The predictive power of increasing radiologic disease severity in combination with older age is particularly helpful because physicians often seek to avoid an invasive diagnostic approach in these patients. In patients without an identified cause for interstitial lung disease who are over age 60 years and with at least one-third of total lung having reticular densities, a confident diagnosis of IPF could be established without a biopsy even in absence of radiologic honeycombing. The adoption of these thresholds would obviate need of biopsy in some patients and could increase eligibility for clinical trials and/or access to approved IPF therapies. While this is a stride forward, we do recognize that many patients meeting the age and fibrosis criterion cited here will not meet the reticulation criterion but still have IPF. Incorporation of additional data (such as clinical data and serum or other biomarkers) into a HRCT-based diagnostic algorithm could improve non-invasive discrimination of IPF from non-IPF patients but future study is required.
Supplementary Material
HIGHLIGHTS.
Predictors of IPF are evaluated in patients without radiologic honeycombing.
All had fibrotic interstitial lung disease and underwent diagnostic lung biopsy.
More extensive reticular densities are associated with a diagnosis of IPF.
IPF probability exceeds 80% when over 1/3 of lung contains reticular densities.
Acknowledgments
Dr. Salisbury takes responsibility for the content of the manuscript, including the data and analysis. This study utilized data provided by the Lung Tissue Research Consortium (LTRC) supported by the National Heart, Lung, and Blood Institute (NHLBI).
This study was funded by National Institutes of Health/National Heart, Lung, and Blood Institute HHSN26820118C (Lung Tissue Research Consortium) and T32 HL00749-21 (Multidisciplinary Training Program in Lung Disease), and National Institutes of Health K24 HL111316 (Kevin R. Flaherty).
ABBREVIATIONS LIST
- HRCT
High Resolution Computed Tomography
- HP
Hypersensitivity Pneumonia
- IPF
Idiopathic Pulmonary Fibrosis
- ILD
Interstitial Lung Disease
- LTRC
Lung Tissue Research Consortium
- NSIP
Nonspecific Interstitial Pneumonitis
- UIP
Usual Interstitial Pneumonia
Footnotes
Publisher's Disclaimer: This is a PDF file of an unedited manuscript that has been accepted for publication. As a service to our customers we are providing this early version of the manuscript. The manuscript will undergo copyediting, typesetting, and review of the resulting proof before it is published in its final citable form. Please note that during the production process errors may be discovered which could affect the content, and all legal disclaimers that apply to the journal pertain.
Author Contributions: M.L.S. and K.R.F conceived and designed the study; M.L.S. and M.X. analyzed the data with supervision and assistance from S.K.M. and K.R.F; F.J.M., B.J.B., E.A.K. and C.A.M. contributed data; M.L.S. and K.R.F. prepared the manuscript; all authors critically revised the manuscript for intellectual content, approved the final draft, and agree to accountability for all aspects of the work.
Conflicts of Interest:
Dr. Salisbury reports grants from NIH during the conduct of the study.
Ms. Xia has nothing to disclose.
Dr. Murray reports grants from NIH during the conduct of the study.
Dr. Bartholmai reports other support from the NIH/NHLBI for research related to the LTRC, previous to the conduct of the study.
Dr. Kazerooni has nothing to disclose.
Dr. Meldrum has nothing to disclose.
Dr. Martinez reports grants from National Institutes of Health, non-financial support from Bayer, non-financial support from Centocor, non-financial support from Gilead, non-financial support from Promedior, personal fees from Ikaria, personal fees from Genentech, personal fees from Nycomed/Takeda, personal fees from Pfizer, personal fees from Vertex, personal fees from American Thoracic Society, personal fees from Inova Health System, personal fees from MedScape, personal fees from Spectrum Health System, personal fees from University of Texas Southwestern, personal fees from Stromedix/Biogen, personal fees from Axon Communications, from Johnson & Johnson, from Genzyme, personal fees from National Association for Continuing Education, personal fees from Boehringer Ingelheim, personal fees from Veracyte, during the conduct of the study; personal fees from Forest, personal fees from Janssens, personal fees from GSK, personal fees from Nycomed/Takeda, personal fees from Actelion, personal fees from Amgen, personal fees from Astra Zeneca, personal fees from CSA Medical, personal fees from Ikaria/Bellerophon, personal fees from Forest, personal fees from Genentech, personal fees from GSK, personal fees from Janssens, personal fees from Merck, personal fees from Pearl, personal fees from Nycomed/Takeda, personal fees from Pfizer, personal fees from Roche, personal fees from Sudler & Hennessey, personal fees from American College of Chest Physicians, personal fees from CME Incite, personal fees from Center for Healthcare Education, personal fees from Inova Health System, personal fees from MedScape, personal fees from Miller Medical, personal fees from National Association for Continuing Education, personal fees from Paradigm, personal fees from Peer Voice, personal fees from Projects in Knowledge, personal fees from St. John’s Hospital, personal fees from St. Mary’s Hospital, personal fees from University of Illinois Chicago, personal fees from UpToDate, personal fees from Wayne State University, personal fees from GSK, personal fees from Boehringer Ingelheim, personal fees from GSK, personal fees from Ikaria, personal fees from Bayer, personal fees from Nycomed/Takeda, personal fees from Grey Healthcare, personal fees from Merion, personal fees from Informa, personal fees from Annenberg, personal fees from GSK, personal fees from Forest, outside the submitted work.
Dr. Flaherty reports grants from NIH, during the conduct of the study; personal fees from Boehringer Ingelheim, personal fees from Fibrogen, personal fees from Genentech, personal fees from Gilead, personal fees from Ikaria, personal fees from ImmuneWorks, personal fees from MedImmune, personal fees from Novartis, personal fees from Takeda, personal fees from Vertex, personal fees from Veracyte, personal fees from Roche, personal fees from Pulmonary Fibrosis Foundation, grants from ImmuneWorks, grants and personal fees from Intermune, grants from Bristol-Myers Squibb, outside the submitted work.
Contributor Information
Margaret L. Salisbury, Email: msalisbu@med.umich.edu.
Meng Xia, Email: summerx@umich.edu.
Susan Murray, Email: skmurray@med.umich.edu.
Brian J. Bartholmai, Email: Bartholmai.Brian@mayo.edu.
Ella A. Kazerooni, Email: ellakaz@med.umich.edu.
Catherine A. Meldrum, Email: cathymel@med.umich.edu.
Fernando J. Martinez, Email: fjm2003@med.umich.edu.
Kevin R. Flaherty, Email: flaherty@med.umich.edu.
References
- 1.Travis WD, et al. An official American Thoracic Society/European Respiratory Society statement: Update of the international multidisciplinary classification of the idiopathic interstitial pneumonias. Am J Respir Crit Care Med. 2013;188(6):733–48. doi: 10.1164/rccm.201308-1483ST. [DOI] [PMC free article] [PubMed] [Google Scholar]
- 2.Flaherty KR, et al. Radiological versus histological diagnosis in UIP and NSIP: survival implications. Thorax. 2003;58(2):143–8. doi: 10.1136/thorax.58.2.143. [DOI] [PMC free article] [PubMed] [Google Scholar]
- 3.Flaherty KR, et al. Clinical significance of histological classification of idiopathic interstitial pneumonia. Eur Respir J. 2002;19(2):275–83. doi: 10.1183/09031936.02.00182002. [DOI] [PubMed] [Google Scholar]
- 4.Mooney JJ, et al. Radiographic fibrosis score predicts survival in hypersensitivity pneumonitis. Chest. 2013;144(2):586–92. doi: 10.1378/chest.12-2623. [DOI] [PubMed] [Google Scholar]
- 5.Idiopathic Pulmonary Fibrosis Clinical Research N et al. Prednisone, azathioprine, and N-acetylcysteine for pulmonary fibrosis. N Engl J Med. 2012;366(21):1968–77. doi: 10.1056/NEJMoa1113354. [DOI] [PMC free article] [PubMed] [Google Scholar]
- 6.King TE, Jr, et al. A phase 3 trial of pirfenidone in patients with idiopathic pulmonary fibrosis. N Engl J Med. 2014;370(22):2083–92. doi: 10.1056/NEJMoa1402582. [DOI] [PubMed] [Google Scholar]
- 7.Noble PW, et al. Pirfenidone in patients with idiopathic pulmonary fibrosis (CAPACITY): two randomised trials. Lancet. 2011;377(9779):1760–9. doi: 10.1016/S0140-6736(11)60405-4. [DOI] [PubMed] [Google Scholar]
- 8.Richeldi L, et al. Efficacy of a tyrosine kinase inhibitor in idiopathic pulmonary fibrosis. N Engl J Med. 2011;365(12):1079–87. doi: 10.1056/NEJMoa1103690. [DOI] [PubMed] [Google Scholar]
- 9.Richeldi L, et al. Efficacy and safety of nintedanib in idiopathic pulmonary fibrosis. N Engl J Med. 2014;370(22):2071–82. doi: 10.1056/NEJMoa1402584. [DOI] [PubMed] [Google Scholar]
- 10.Raghu G, et al. An official ATS/ERS/JRS/ALAT statement: idiopathic pulmonary fibrosis: evidence-based guidelines for diagnosis and management. Am J Respir Crit Care Med. 2011;183(6):788–824. doi: 10.1164/rccm.2009-040GL. [DOI] [PMC free article] [PubMed] [Google Scholar]
- 11.Sumikawa H, et al. Computed tomography findings in pathological usual interstitial pneumonia: relationship to survival. Am J Respir Crit Care Med. 2008;177(4):433–9. doi: 10.1164/rccm.200611-1696OC. [DOI] [PubMed] [Google Scholar]
- 12.Raghu G, et al. Diagnosis of idiopathic pulmonary fibrosis with high-resolution CT in patients with little or no radiological evidence of honeycombing: secondary analysis of a randomised, controlled trial. Lancet Respir Med. 2014;2(4):277–84. doi: 10.1016/S2213-2600(14)70011-6. [DOI] [PubMed] [Google Scholar]
- 13.Gruden JF, et al. UIP diagnosed at surgical lung biopsy, 2000–2009: HRCT patterns and proposed classification system. AJR Am J Roentgenol. 2013;200(5):W458–67. doi: 10.2214/AJR.12.9437. [DOI] [PubMed] [Google Scholar]
- 14.Lettieri CJ, et al. Outcomes and safety of surgical lung biopsy for interstitial lung disease. Chest. 2005;127(5):1600–5. doi: 10.1378/chest.127.5.1600. [DOI] [PubMed] [Google Scholar]
- 15.Utz JP, et al. High short-term mortality following lung biopsy for usual interstitial pneumonia. Eur Respir J. 2001;17(2):175–9. doi: 10.1183/09031936.01.17201750. [DOI] [PubMed] [Google Scholar]
- 16.Chung JH, et al. CT Scan Findings of Probable Usual Interstitial Pneumonitis Have a High Predictive Value for Histologic Usual Interstitial Pneumonitis. Chest. 2015;147(2):450–9. doi: 10.1378/chest.14-0976. [DOI] [PMC free article] [PubMed] [Google Scholar]
- 17.Lee HY, et al. High-resolution CT findings in fibrotic idiopathic interstitial pneumonias with little honeycombing: serial changes and prognostic implications. AJR Am J Roentgenol. 2012;199(5):982–9. doi: 10.2214/AJR.11.8192. [DOI] [PubMed] [Google Scholar]
- 18.Fell CD, et al. Clinical predictors of a diagnosis of idiopathic pulmonary fibrosis. Am J Respir Crit Care Med. 2010;181(8):832–7. doi: 10.1164/rccm.200906-0959OC. [DOI] [PMC free article] [PubMed] [Google Scholar]
- 19.Hansell DM, et al. Fleischner Society: glossary of terms for thoracic imaging. Radiology. 2008;246(3):697–722. doi: 10.1148/radiol.2462070712. [DOI] [PubMed] [Google Scholar]
- 20.Fishman A, et al. A randomized trial comparing lung-volume-reduction surgery with medical therapy for severe emphysema. N Engl J Med. 2003;348(21):2059–73. doi: 10.1056/NEJMoa030287. [DOI] [PubMed] [Google Scholar]
- 21.Hodnett PA, et al. Fibrosing interstitial lung disease. A practical high-resolution computed tomography-based approach to diagnosis and management and a review of the literature. Am J Respir Crit Care Med. 2013;188(2):141–9. doi: 10.1164/rccm.201208-1544CI. [DOI] [PubMed] [Google Scholar]
- 22.American Thoracic Society. Idiopathic pulmonary fibrosis: diagnosis and treatment. International consensus statement. American Thoracic Society (ATS), and the European Respiratory Society (ERS) Am J Respir Crit Care Med. 2000;161(2 Pt 1):646–64. doi: 10.1164/ajrccm.161.2.ats3-00. [DOI] [PubMed] [Google Scholar]
- 23.American Thoracic S et al. American Thoracic Society/European Respiratory Society International Multidisciplinary Consensus Classification of the Idiopathic Interstitial Pneumonias. This joint statement of the American Thoracic Society (ATS), and the European Respiratory Society (ERS) was adopted by the ATS board of directors, June 2001 and by the ERS Executive Committee, June 2001. Am J Respir Crit Care Med. 2002;165(2):277–304. doi: 10.1164/ajrccm.165.2.ats01. [DOI] [PubMed] [Google Scholar]
- 24.Silva CI, et al. Chronic hypersensitivity pneumonitis: differentiation from idiopathic pulmonary fibrosis and nonspecific interstitial pneumonia by using thin-section CT. Radiology. 2008;246(1):288–97. doi: 10.1148/radiol.2453061881. [DOI] [PubMed] [Google Scholar]
- 25.Flaherty KR, et al. Idiopathic interstitial pneumonia: what is the effect of a multidisciplinary approach to diagnosis? Am J Respir Crit Care Med. 2004;170(8):904–10. doi: 10.1164/rccm.200402-147OC. [DOI] [PubMed] [Google Scholar]
- 26.Fisher RA. The Logic of Inductive Inference. Journal of the Royal Statistical Society. 1935;98(1):39–82. [Google Scholar]
- 27.Pearson K. On the criterion that a given system of deviations from the probable in the case of a correlated system of variables is such that it can be reasonably supposed to have arisen from random sampling. London: 1900. [Google Scholar]
- 28.Wilcoxon F. Individual comparisons of grouped data by ranking methods. J Econ Entomol. 1946;39:269. doi: 10.1093/jee/39.2.269. [DOI] [PubMed] [Google Scholar]
- 29.Aldrich JH, N FD. Linear probability, logit, and probit models. Beverly Hills, CA: Sage; 1984. [Google Scholar]
- 30.Efroymson MA. Multiple Regression Analysis. In: Wilf HS, R A, editors. Mathematical Methods for Digital Computers. New York: John Wiley and Sons; 1960. [Google Scholar]
- 31.Morell F, et al. Chronic hypersensitivity pneumonitis in patients diagnosed with idiopathic pulmonary fibrosis: a prospective case-cohort study. Lancet Respir Med. 2013;1(9):685–94. doi: 10.1016/S2213-2600(13)70191-7. [DOI] [PubMed] [Google Scholar]
- 32.Sumikawa H, et al. Pathologically proved nonspecific interstitial pneumonia: CT pattern analysis as compared with usual interstitial pneumonia CT pattern. Radiology. 2014;272(2):549–56. doi: 10.1148/radiol.14130853. [DOI] [PubMed] [Google Scholar]
- 33.Flaherty KR, et al. Idiopathic interstitial pneumonia: do community and academic physicians agree on diagnosis? Am J Respir Crit Care Med. 2007;175(10):1054–60. doi: 10.1164/rccm.200606-833OC. [DOI] [PMC free article] [PubMed] [Google Scholar]
- 34.Kazerooni EA, et al. Thin-section CT obtained at 10-mm increments versus limited three-level thin-section CT for idiopathic pulmonary fibrosis: correlation with pathologic scoring. AJR Am J Roentgenol. 1997;169(4):977–83. doi: 10.2214/ajr.169.4.9308447. [DOI] [PubMed] [Google Scholar]
Associated Data
This section collects any data citations, data availability statements, or supplementary materials included in this article.