

ABSTRACT
The latent HIV-1 reservoir primarily resides in resting CD4+ T cells which are a heterogeneous population composed of both naive (TN) and memory cells. In HIV-1-infected individuals, viral DNA has been detected in both naive and memory CD4+ T cell subsets although the frequency of HIV-1 DNA is typically higher in memory cells, particularly in the central memory (TCM) cell subset. TN and TCM cells are distinct cell populations distinguished by many phenotypic and physiological differences. In this study, we used a primary cell model of HIV-1 latency that utilizes direct infection of highly purified TN and TCM cells to address differences in the establishment and reversal of HIV-1 latency. Consistent with what is seen in vivo, we found that HIV-1 infected TN cells less efficiently than TCM cells. However, when the infected TN cells were treated with latency-reversing agents, including anti-CD3/CD28 antibodies, phorbol myristate acetate/phytohemagglutinin, and prostratin, as much (if not more) extracellular virion-associated HIV-1 RNA was produced per infected TN cell as per infected TCM cell. There were no major differences in the genomic distribution of HIV-1 integration sites between TN and TCM cells that accounted for these observed differences. We observed decay of the latent HIV-1 cells in both T cell subsets after exposure to each of the latency-reversing agents. Collectively, these data highlight significant differences in the establishment and reversal of HIV-1 latency in TN and TCM CD4+ T cells and suggest that each subset should be independently studied in preclinical and clinical studies.
IMPORTANCE The latent HIV-1 reservoir is frequently described as residing within resting memory CD4+ T cells. This is largely due to the consistent finding that memory CD4+ T cells, specifically the central (TCM) and transitional memory compartments, harbor the highest levels of HIV-1 DNA in individuals on suppressive therapy. This has yielded little research into the contribution of CD4+ naive T (TN) cells to the latent reservoir. In this study, we show that although TN cells harbor significantly lower levels of HIV-1 DNA, following latency reversal, they produced as many virions as did the TCM cells (if not more virions). This suggests that latently infected TN cells may be a major source of virus following treatment interruption or failure. These findings highlight the need for a better understanding of the establishment and reversal of HIV-1 latency in TN cells in evaluating therapeutic approaches to eliminate the latent reservoir.
INTRODUCTION
A latent HIV-1 reservoir is established in resting CD4+ T cells early during acute infection (1–5). This reservoir is unaffected by the immune system or by antiretroviral therapy (ART) but has the potential to produce infectious virus, which may contribute to persistent plasma viremia during ART or viral rebound if ART is interrupted. Therefore, HIV-1 cure strategies will need to include a therapeutic approach that eliminates, or significantly reduces the size of, this reservoir.
The resting CD4+ T cell population is heterogeneous and includes naive (TN), stem cell-like memory, central memory (TCM), transitional memory (TTM), effector memory (TEM), and terminally differentiated cells. In HIV-1-infected individuals, viral DNA has been detected in all of these CD4+ T cell subsets although the levels of total HIV-1 DNA are typically highest in the TCM and TTM cell compartments, suggesting that they may be the major reservoirs of latent viral infection (6–8). However, recent analyses of the frequency of replication-competent virus in cells from infected individuals on suppressive ART, as measured by the quantitative viral outgrowth assay (QVOA), revealed that while replication-competent HIV-1 was consistently detected within TCM cells, it was not frequently detected in the TTM cell compartment (9) although this finding has not been consistently observed in other studies (6, 10). This finding indicates that quantification of viral DNA alone is not necessarily predictive of the size of the inducible latent reservoir and suggests caution in labeling a cellular reservoir of latent HIV-1 as “major” based solely on the frequency of infection. In addition to the memory CD4+ T cell subsets, HIV-1 DNA is almost always detected in TN cells in both viremic and suppressed individuals, although with a much lower frequency than in the TCM and TTM compartments (6, 7, 10–21). Interestingly, in 2013 Saez-Cirion et al. reported that in some HIV-1-infected individuals who received ART within 10 weeks of primary infection, viremia could be controlled for at least 24 months posttreatment interruption (8). In this patient population, HIV-1 DNA was detected in CD4+ TN cells in only 2 of 11 individuals, whereas all the resting memory CD4+ T cell subsets (TCM, TTM, and TEM) harbored comparable levels of HIV-1 DNA (8). This finding suggests that the latent HIV-1 reservoir in CD4+ TN cells may be more important than previously considered.
The naive and different resting memory CD4+ T cell subsets differ in life span, proliferative capacity, antigen response time, residence throughout the body, and expression levels of their HIV-1 coreceptors, CCR5 and CXCR4 (22–24). In light of this, we hypothesized that the establishment and reversal of HIV-1 latency would differ between naive and memory CD4+ T cells and that understanding these phenotypes in different CD4+ T cell subsets could facilitate the development of effective cure strategies to purge the latent reservoir. Given the low frequency of latently infected cells in ART-suppressed individuals, approximately 100 copies of HIV-1 DNA or one infectious unit per 106 resting CD4+ T cells (25–27), we sought to compare and contrast latent HIV-1 infection using a primary cell model in highly purified TN and TCM CD4+ T cells.
MATERIALS AND METHODS
Purification of TN and TCM CD4+ T cells.
A total of 180 ml of blood was obtained from healthy HIV-negative volunteers, which was approved by the University of Pittsburgh Institutional Review Board. Written informed consent was provided for all donors. Peripheral blood mononuclear cells (PBMCs) were isolated by Ficoll-Paque Plus (GE Healthcare) density gradient centrifugation. Resting CD4+ T cells were purified by first isolating total CD4+ T cells by magnetic bead negative selection using a CD4+ T cell purification kit, followed by magnetic bead negative selection using anti-CD25, anti-CD69, and anti-HLA-DR antibodies. TN cells were isolated from the resting CD4+ T cells by magnetic bead depletion of CD45RO+ cells. TCM cells were isolated from the resting CD4+ T cells by magnetic bead depletion of CD45RA+ cells, followed by positive selection of CCR7-expressing cells. Increased labeling times were used to increase cell purity. All magnetic bead purification kits and antibodies were obtained from Miltenyi Biotec. The purity of the TN and TCM cells was assessed by flow cytometry (LSR II; BD Biosciences) using the following antibodies: CD3-V450, CD4-peridinin chlorophyll protein (PerCP)-Cy5.5, CD45RA-fluorescein isothiocyanate (FITC), CCR7-phycoerythrin (PE), CD27-allophycocyanin (APC)-H7, and CD62L-APC (BD Biosciences). Data were analyzed using FlowJo, version X.0.7. The TN and TCM cell surface phenotypes were as follows: TN cells, CD45RA+ CCR7+ CD27+ CD62L; TCM cells, CD45RA− CCR7+ CD27+ CD62L. CD4+ TN and TCM cell purity levels were always found to be ≥98% and ≥96%, respectively (Fig. 1A).
FIG 1.

Infection of TN and TCM cells by CXCR4-tropic (HIV-1LAI) and CCR5-tropic (HIV-1BaL) HIV-1 in the absence and presence of CCL19. (A) TN and TCM cells were purified from resting CD4+ T cells based on the variable cell surface expression of CD45RA, CCR7, CD27, and CD62L. TN cells were defined as CD45RA+ CCR7+ CD27+ CD62L+. TCM cells were defined as CD45RA− CCR7+ CD27+ CD62L+. The purity of each subset was determined by surface expression of each marker as measured by flow cytometry. Representative histograms from one donor are shown. (B) Schematic representation of the experimental approach. (C) Quantification of total HIV-1 DNA in TN cells at 7 days postinfection. (D) Quantification of total HIV-1 DNA in TCM cells at 7 days postinfection. (E) Quantification of HIV-1 2-LTR circles in TN cells at 7 days postinfection. (F) Quantification of HIV-1 2-LTR circles in TCM cells at 7 days postinfection. For graphs in panels C to F, each dot represents a unique donor, and data are normalized to cell number. ND, not detected; NS, not significant. P values for results in HIV-1LAI-infected cells with and without CCL19 were calculated using a Wilcoxon matched-pairs signed-rank test. P values between HIV-1LAI and HIV-1BaL results were calculated using a Mann-Whitney test.
Infection of TN and TCM CD4+ T cells.
Purified TN and TCM CD4+ T cells were cultured at a density of 1 × 10⁶ to 2 × 10⁶ cells/ml in RPMI 1640 medium supplemented with 10% fetal bovine serum (FBS), 100 units/ml penicillin, 100 μg/ml streptomycin, and 0.29 mg/ml glutamine (all from Life Technologies). CCL19 (100 nM final concentration) was added to the cells 2 days prior to infection with HIV-1, as described previously (28, 29). Cells were infected with either the CXCR4-tropic strain HIV-1LAI (30) or the CCR5-tropic strain HIV-1BaL at a multiplicity of infection of 1 (titers were determined on GHOST cells) [31]) for 2 to 3 h at 37°C. HIV-1BaL was obtained through the NIH AIDS Reagent Program, Division of AIDS, NIAID, NIH, from S. Gartner, R. C. Gallo, and M. Popovic (32). Cells were then washed twice with fresh medium to remove free virus. Every 2 days following infection, 10 units/ml recombinant interleukin-2 (IL-2; Roche) was added to the medium, in addition to 300 nM efavirenz (EFV; NIH AIDS Reagent Program) to inhibit multiple rounds of HIV-1 infection. For some experiments, 300 nM raltegravir (RAL; NIH AIDS Reagent Program) was also included to block multiple rounds of HIV-1 infection.
Flow cytometry.
T cell activation was assessed by flow cytometry using the following antibodies from BD Biosciences: CD3-V450, CD4-PerCP-Cy5.5, CD25-PE-Cy7, CD69-PE, and HLA-DR-FITC. To measure the expression of the HIV-1 coreceptors CCR5 and CXCR4, TN and TCM cells were stained with CD3-V450, CD4-PerCP-Cy5.5, and either CCR5-PE or CXCR4-PE (BD Biosciences). Typically, 50,000 to 100,000 cells were collected per sample in the CD3+ CD4+ gate to adequately measure CCR5 or CXCR4 expression. Dead cells were excluded based on plots of side scatter area (SSC-A) and forward scatter area (FSC-A). For some experiments where noted in the text, cell viability was determined using a Live/Dead fixable cell viability dye for flow cytometry (Invitrogen). The intracellular proliferation marker Ki-67 was stained according to the manufacturer's protocol (BD Biosciences). However, instead of using the cell viability solution (7-amino-actinomycin D [7-AAD]) to discriminate live cells from dead cells, we first stained the cells with Live/Dead-APC (Invitrogen) prior to fixation and permeabilization for Ki-67 staining. All samples were run on an LSR II instrument, and the data were analyzed using FlowJo, version X.0.7.
Extraction and quantification of HIV-1 DNA.
Total cellular DNA was extracted from pooled duplicate culture wells and was assayed for total HIV-1 DNA and two-long terminal repeat (2-LTR) circle DNA levels by quantitative PCR (qPCR), as described previously (33, 34). Each sample was run in triplicate using the LightCycler 480 System (Roche). DNA standards were included as described previously (33, 34). HIV-1 DNA and 2-LTR circles were normalized to the total number of cells assayed by quantitative PCR amplification of the CCR5 gene (35).
Integration site sequencing.
Genomic DNA (20 μg) was isolated using a DNeasy blood and tissue kit (Qiagen) from resting and phytohemagglutinin (PHA)-activated TN and TCM CD4+ T cells infected with HIV-1LAI. DNA was digested overnight with 100 U each of MseI and BglII and purified using a QIAquick PCR purification kit (Qiagen). Double-stranded asymmetric linkers were prepared by heating 10 μM each oligonucleotide to 90°C in 10 mM Tris-HCl, pH 8.0, and 0.1 mM EDTA and slowly cooling them to room temperature. Linker DNA (1.5 μM) was ligated with digested cellular DNA (1 μg) overnight at 12°C with 800 U of T4 DNA ligase in four parallel reactions, and the DNAs were pooled and repurified using a QIAquick PCR purification kit. Seminested PCR was used to selectively amplify integration sites, with reactions multiplexed into eight separate samples per PCR stage. The first and second rounds of PCR utilized nested HIV-1 U5 primers, whereas the same linker-specific primer was used for both rounds. The linker primer and second-round U5 primer each encoded adapter sequences necessary for Illumina sequencing, as well as for sequencing primer binding sites. To allow the identification of unique library samples from multiplexed sequencing runs, unique bar-coded linker DNAs and linker-specific primers were employed for each sample, and the nested U5 primer additionally encoded a unique 6-bp index sequence. The sequences of the oligonucleotides utilized are provided in Table 1. Each PCR mixture contained 100 ng of template DNA, 1.9 μM U5 primer, and 0.375 μM linker primer. Each reaction was carried out using Advantage 2 polymerase mix (Clontech), according to the manufacturer's instructions, and the reaction mixture was incubated at 94°C for 2 min, followed by 30 cycles at 94°C for 15 s, 55°C for 30 s, and 68°C for 45 s, with a final extension for 10 min at 68°C. Pooled PCR products were purified using a QIAquick PCR purification kit, and second-round reaction products were submitted for sequencing on the Illumina MiSeq platform at the Dana-Farber Cancer Institute Molecular Biology Core Facilities. Resulting sequences were mapped to the hg19 version of the human genome using BLAT, allowing for a minimum unique sequence identity match of 97%. Correlations of integration site distributions relative to various genomic features were conducted using BEDTools (36). Statistical analysis of resulting integration frequencies was determined using R (37, 38), with statistical significance being calculated by Fisher's exact test and a Wilcoxon rank sum test.
TABLE 1.
Primer sequences used for integration site mapping
| Oligonucleotide use | Oligonucleotide sequence (5′–3′) |
|---|---|
| First-round HIV-1 LTR primer | TGTGACTCTGGTAACTAGAGATCCCTC |
| Activated CD4+ cells | |
| Linker top strand | PO4-GTCCCTTAAGCGGAG-NH2 |
| Linker bottom strand | GTAATACGACTCACTATAGGGCCTCCGCTTAAGGGACT |
| Linker primer | CAAGCAGAAGACGGCATACGAGATCGGTCTCGGCATTCCTGCTGAACCGCTCTTCCGATCTGTAATACGACTCACTATAGGGC |
| HIV-1 LTR primer | AATGATACGGCGACCACCGAGATCTACACTCTTTCCCTACACGACGCTCTTCCGATCTCGATGTGAGATCCCTCAGACCCTTTTAGTCAG |
| CD4+ TN cells | |
| Linker top strand | PO4-CGAGGCGTCTAATGC-NH2 |
| Linker bottom strand | GCTATAGCAGCACATCAGTTAGGCATTAGACGCCTCGT |
| Linker primer | CAAGCAGAAGACGGCATACGAGATCGGTCTCGGCATTCCTGCTGAACCGCTCTTCCGATCTGCTATAGCAGCACATCAGTTAG |
| HIV-1 LTR primer | AATGATACGGCGACCACCGAGATCTACACTCTTTCCCTACACGACGCTCTTCCGATCTTGACCAGAGATCCCTCAGACCCTTTTAGTCAG |
| CD4+ TCM cells | |
| Linker top strand | PO4-CTATGACGGTGACGC-NH2 |
| Linker bottom strand | GAGAATCCATGAGTATGCTCACGCGTCACCGTCATAGT |
| Linker primer | CAAGCAGAAGACGGCATACGAGATCGGTCTCGGCATTCCTGCTGAACCGCTCTTCCGATCTGAGAATCCATGAGTATGCTCAC |
| HIV-1 LTR primer | AATGATACGGCGACCACCGAGATCTACACTCTTTCCCTACACGACGCTCTTCCGATCTACAGTGGAGATCCCTCAGACCCTTTTAGTCAG |
Quantification of F-actin density.
Filamentous actin (F-actin) density was quantified by both flow cytometry and confocal microscopy. For flow cytometry, cells were first surface stained for CD3-V450 and CD4-PerCP-Cy5.5 (BD Biosciences); cells were then fixed in 1% paraformaldehyde (PFA), permeabilized with 0.1% Triton-X (Sigma-Aldrich) supplemented with 5% FBS, and stained with 100 nM phalloidin-FITC (100 nM; Sigma-Aldrich) in phosphate-buffered saline (PBS) supplemented with 5% FBS. Following staining, cells were washed with PBS supplemented with 5% FBS to remove any unbound phalloidin. All samples were run within 24 h on an LSR II system, and the data were analyzed using FlowJo software. A total of 10,000 events were collected per sample in the CD3+ CD4+ gate. Dead cells were excluded based on side scatter and forward scatter plots. Latrunculin A (Lat-A; Thermo Fisher) was added to cells 6 h prior to the addition of CCL19. At 48 h post-CCL19 treatment, cells were analyzed for F-actin density by flow cytometry as described above. For imaging, cells were fixed in 1% PFA, permeabilized with 0.1% Triton-X supplemented with 5% FBS, washed with PBS supplemented with 5% FBS, and then stained with 1 U/ml phalloidin-Alexa Fluor 488 (AF488) (Life Technologies, Beaverton, OR) in PBS supplemented with 5% FBS. The cells were washed, stained with 1 μg/ml 4′,6-diamidino-2-phenylindole (DAPI) (Life Technologies, Beaverton, OR), and washed again. After the second wash, the cell pellets were resuspended in Gelvatol mounting medium and mounted onto microscope slides for imaging. Images were collected using a Nikon A1 R spectral confocal microscope with a 100× (1.4 numerical aperture [NA]) oil immersion objective. Following collection using NIS-Elements software, images were parsed to Imaris (Bitplane) and rendered in three dimensions. The total actin volume in each cell was calculated following surface extraction and volume rendering in Imaris.
Quantification of cellular dNTP concentrations.
Cellular deoxynucleoside triphosphates (dNTPs) were extracted from 5 to 8 million cells and quantified as described previously (39).
Reactivation of latent HIV-1 from TN and TCM CD4+ T cells.
Seven days postinfection, the TN and TCM CD4+ T cells were washed with medium and plated in a 96-well plate at a density of 100,000 cells/well. Anti-CD3/CD28 antibodies (3 beads per cell; Life Technologies), 10 nM phorbol myristate acetate (PMA; Sigma-Aldrich) with 10 μg/ml PHA (PMA-PHA) (Remel), 5 μM prostratin, or 500 nM suberoylanilide hydroxamic acid (SAHA; Cayman Chemicals) was then added to the well. Unstimulated cells were used as a control. At 3 and 7 days poststimulation, IL-2 and EFV were added to each well. To evaluate the decay of HIV-1-infected cells following latency reversal, HIV-1 DNA was quantified by qPCR, and the result was normalized to cell number as described above at each respective time point. The level of HIV-1 DNA/cell in unstimulated control cells was normalized to 100 for each donor. The level of HIV-1 DNA/cell following treatment with each latency-reversing agent (LRA) was then normalized to the level of HIV-1 DNA/cell from the unstimulated control cells. The log10 of each value was then plotted on a linear scale to generate linear regression curves and decay rates.
Extraction and quantification of extracellular virion-associated HIV-1 RNA.
Culture supernatant was centrifuged at 16,100 × g for 70 min to pellet HIV-1 virions. Viral RNA was then extracted using an RNeasy Plus minikit (Qiagen), and quantified using a real-time reverse transcriptase (RT)-initiated PCR assay with single-copy sensitivity, as described previously (40), using AffinityScript Multiple Temperature RT (Agilent Technologies) in place of Superscript II RT. The primers and probe used to quantify HIV-1 RNA were the same as those used to quantify total HIV-1 DNA. No RT control wells were run for each sample to ensure that amplification was from RNA only and not from DNA.
Statistical analyses.
Statistical analysis of integration sites was determined by a Fisher's exact or Wilcoxon rank sum test (Table 2). Statistical comparison between paired samples was analyzed using a Wilcoxon matched-pairs signed-rank test. For all unpaired samples, statistics were determined using a Mann-Whitney test. For all statistical analyses, a P value <0.05 was considered significant.
TABLE 2.
HIV-1 integration site preference in PHA-activated, TN, and TCM CD4+ T cells
| Sample | No. (%) of unique integration sites |
Avg gene density within 1 Mb (±0.5 Mb) of integration sitesa | |||
|---|---|---|---|---|---|
| Total | Within RefSeq genes | Within 5 kb (±2.5 kb) of a transcriptional start site | Within 5 kb (±2.5 kb) of a CpG island | ||
| Activated CD4+ T cells | 133,697 | 114,110 (85.3)c | 6,242 (4.7)d | 7,052 (5.3)e | 20.3f |
| CD4+ TN cells | 729 | 613 (84.1)g | 30 (4.1%)h | 33 (4.5)i | 18.4j |
| CD4+ TCM cells | 2,620 | 2,291 (87.4)k | 109 (4.2%)l | 112 (4.3)m | 19.0n |
| MRCb | 50,000 | 22,328 (44.7) | 2,010 (4.0) | 2,100 (4.2) | 8.7 |
Based on complete genes.
Matched random control of 50,000 computer-generated integration sites in proximity to Mse1/BglII restriction sites in hg19.
P value (Fisher's exact test) versus values for the following: MRC, <2.2 × 10−308; TCM cells, 0.003; TN cells, 0.34.
P value (Fisher's exact test) versus values for the following: MRC, 1.7 × 10⁻⁹; TCM cells, 0.24; TN cells, 0.53.
P value (Fisher's exact test) versus values for the following: MRC, 1.0 × 10⁻²¹; TCM cells, 0.02; TN cells, 0.41.
P value (Wilcoxon rank-sum) versus values for the following: MRC, <2.2 × 10−308; TCM cells, 0.045; TN cells, 0.0002.
P value (Fisher's exact test) versus values for the following: MRC, 3.5 × 10−106; TCM cells, 0.02.
P value (Fisher's exact test) versus values for the following: MRC, 0.85; TCM cells, 1.
P value (Fisher's exact test) versus values for the following: MRC, 0.64; TCM cells, 0.76.
P value (Wilcoxon rank-sum) versus values for the following: MRC, 1.7 × 10−101; TCM cells, 0.017.
P value (Fisher's exact test) versus the value for the MRC, <2.2 × 10−308.
P value (Fisher's exact test) versus the value for the MRC, 0.72.
P value (Fisher's exact test) versus the value for the MRC, 0.84.
P value (Wilcoxon rank-sum) versus the value for the MRC, <2.2 × 10−308.
RESULTS
Direct HIV-1 infection of CD4+ TN and TCM cells.
Given the low infection frequency of HIV-1 in individuals on ART, it is difficult to use patient-derived cells to perform detailed in vitro analyses. Therefore, we first sought to establish appropriate in vitro primary cell models of HIV-1 latency in CD4+ TN and TCM cells. To maintain the integrity and authenticity of the TN and TCM cell populations, we considered only approaches that avoided significant T cell manipulation, including antigen stimulation or T cell differentiation. Following a review of several approaches, we expanded on the assay system developed by Saleh et al., which uses the chemokine CCL19 to enhance the permissiveness of resting CD4+ T cells to HIV-1 infection (29). Because prior published studies using this model had characterized the establishment and reversal of HIV-1 latency only in total resting CD4+ T cells (28, 29, 41), we first quantified the ability of X4-tropic (HIV-1LAI) and R5-tropic (HIV-1BaL) strains of HIV-1 to infect highly purified CD4+ TN and TCM cells (Fig. 1A) in the absence and presence of CCL19 (Fig. 1B). Both cell types were equally resistant to both HIV-1LAI and HIV-1BaL infection in the absence of CCL19 (Fig. 1C and D). We found that CCL19 significantly enhanced infection of both TN (Fig. 1C) and TCM (Fig. 1D) cells by HIV-1LAI, as assessed by quantification of total HIV-1 DNA. However, TCM cells were more efficiently infected (mean fold increase, 15.5) than were the TN cells (mean fold increase, 3.65). CCL19 was also found to increase the ability of HIV-1BaL to infect TCM, but not TN, cells (Fig. 1C and D). The result with TN cells could be due to low surface expression of CCR5 on TN cells, which was not affected by exposure to CCL19 (Fig. 2). CCL19 expression also did not affect expression of CCR5 on TCM cells or CXCR4 expression on either cell type (Fig. 2). A small percentage of HIV-1 reverse transcripts that fail to integrate are converted to two-long terminal repeat (2-LTR)-containing circles (42), and we accordingly quantified HIV-1 circle levels as a surrogate for unintegrated HIV-1 DNA (Fig. 1E and F). As expected, this analysis revealed that 2-LTR circles constituted only a minor proportion of the total intracellular HIV-1 DNA of both subsets. Moreover, the relative levels of 2-LTR circle DNA mimicked total HIV-1 levels across the different conditions of virus infection (Fig. 1).
FIG 2.

CCL19 treatment does not alter the expression of HIV-1 coreceptor expression on primary CD4+ TN or TCM cells. (A) Percent expression of CCR5 or CXCR4 on TN or TCM cells 2 days following treatment with CCL19 or anti-CD3/CD28 antibodies as determined by antibody staining and flow cytometry. Untreated cells were used as a control. (B) CCR5 and CXCR4 surface density as assessed by mean fluorescence intensity under the same conditions as described for panel A. No significant differences in the number of cells expressing CCR5 or CXCR4 or density of expression were noted between control cells or cells treated with CCL19 (statistics not shown; n = 5).
Finally, we determined whether CCL19 or direct HIV-1 infection induced T cell activation or cellular proliferation of the purified TN or TCM cells (Fig. 3). We found that CCL19 treatment did not upregulate surface expression of the T cell activation marker CD25, CD69, or HLA-DR (Fig. 3A). However, a slight increase in CD25 expression was observed in all cells after 7 days of culture, which could not be attributed to HIV-1 infection (Fig. 3A). There was also no evidence of T cell proliferation as assessed by quantification of total cell number (Fig. 3B) or by intracellular staining of Ki-67 (Fig. 3C). Additionally, exposure of the TN and TCM CD4+ T cells to CCL19 or HIV-1 did not induce cell death (Fig. 3D).
FIG 3.

T cell activation, proliferation, and cell viability of purified CD4+ TN and TCM cells. (A) T cell activation markers CD25, CD69, and HLA-DR were assessed by antibody staining and flow cytometry on TN and TCM cells following purification (day −2), CCL19-treatment (day 0), and HIV-1LAI infection (day 7, left) and on uninfected cells (day 7, right). Data are presented as the means ± standard errors of the means (n = 7). (B) Cellular proliferation of unstimulated cells was measured by qPCR of the CCR5 gene throughout the time course of the experiment. Data are presented as the means ± standard errors of the means (n = 6). (C) Intracellular staining and flow cytometry for Ki-67. Data are presented as the means ± standard errors of the means (n = 2 performed in duplicate). (D) Cell viability was measured by Live/Dead staining and flow cytometry in freshly isolated, TN and TCM cells, in cells with and without CCL19 treatment for 2 days, and in cells with and without HIV-1 infection after 7 days, as indicated. Data are presented as the means ± TN and TCM cells (n = 3 performed in duplicate).
Genomic distribution of HIV-1 integration sites in CD4+ TN and TCM cells.
We next compared the genomic distribution of HIV-1 integration sites in infected TN and TCM cells and, as a control, compared these values to those obtained using total CD4+ T cells that were broadly stimulated by treatment with phytohemagglutinin (PHA). A total of 729, 2,260, and 133,697 unique integration sites were mapped in the CD4+ TN, TCM, and PHA-activated cells, respectively, with regard to several genomic annotations, including RefSeq genes, transcriptional start sites (TSSs), CpG islands, and gene density (Table 2). The statistical relevance of the observed frequencies versus a matched random control (MRC) data set was determined by Fisher's exact test for RefSeq genes, TSSs, and CpG islands and by a Wilcoxon rank sum test for gene density. Distributions relative to CpG islands and TSSs were calculated by counting sites that fell within a 5-kb window (±2.5 kb) of these features, while gene density was calculated by counting the number of RefSeq genes falling within a 1-Mb window (±500 kb) of each integration site, and then averaging this value for the entire data set. Our MRC data set revealed that 44.7% of human DNA is comprised of RefSeq genes.
As expected (43), HIV-1 targeted RefSeq genes significantly more frequently than random sequences (TN cells, 84.1%; TCM cells, 87.4%; PHA-stimulated cells, 85.3%; P values ranging from 3.5 × 10−106 to <2.2 × 10−308). In contrast, the frequency of gene targeting across the different infection conditions was largely similar, with only minor differences noted for the comparisons between TCM and PHA-stimulated cells and between TN and TCM cells (Table 2). Integration into gene-dense regions of chromosomes was similarly highly significant compared to random, whereas the differences between infected cell data sets were largely similar (P values from 0.0002 to 0.05). As expected (44), the numbers of HIV-1 integration sites nearby CpG islands or TSSs in CD4+ TN and TCM cells were similar to the MRC value although small but significant differences were noted between the MRC and PHA-activated cells (Table 2).
CCL19-mediated HIV-1 infection of CD4+ TN and TCM cells is not due to an increase in F-actin density.
The actin cytoskeleton is known to be a key regulator in many early events of HIV-1 infection, including viral entry, reverse transcription, intracellular trafficking, and integration (45–48). In resting CD4+ T cells, cortical actin is static and is restrictive to HIV-1 infection due to actin and its regulators being in an inactive state. Additionally, Cameron et al. reported that CCL19 enhanced HIV-1 infection of resting CD4+ T cells via rapid dephosphorylation of cofilin and changes in filamentous actin (F-actin) density (28). To validate the role of F-actin density in HIV-1 infection, we first isolated total resting CD4+ T cells and exposed them to different concentrations of latrunculin A (Lat-A), a natural product that prevents F-actin assembly, for 6 h prior to the addition of CCL19 (Fig. 4A). Forty-eight hours later, cell viability (Fig. 4C) and F-actin density (Fig. 4B) were measured by live/dead and phalloidin staining, respectively, and by flow cytometry. After the 48-h treatment, cells were infected with HIV-1LAI and cultured for 7 days (Fig. 4A). HIV-1LAI infection was then assessed by quantification of total HIV-1 DNA (Fig. 4D). Lat-A decreased F-actin density in a dose-dependent manner, as determined by phalloidin staining intensity (Fig. 4B), but did not impact cell viability (Fig. 4C). Importantly, the decrease in F-actin density correlated with a decrease in the ability of HIV-1LAI to infect the resting CD4+ T cells (Fig. 4D).
FIG 4.

Inhibition of F-actin polymerization blocks HIV-1 infection of total resting CD4+ T cells in a dose-dependent manner. (A) Schematic representation of the experimental approach. (B) Cells were treated with different concentrations of Lat-A for 6 h, followed by treatment with CCL19 for an additional 2 days. F-actin was stained with phalloidin and measured by flow cytometry. Cells stimulated with PMA plus IL-2 were used as a positive control. (C) Following the same experimental conditions as in described for panel B, cell viability was assessed by flow cytometry using Live/Dead staining. Untreated cells were used as a negative control, and cells heated at 56°C for 1 h prior to staining were used as a dead cell control. (D) F-actin density and HIV-1 infection of resting CD4+ T cells are plotted. Following the experimental approach shown in panel A, HIV-1 infection was measured at 7 days postinfection by quantification of total intracellular HIV-1 DNA, normalized to cell number. HIV-1 DNA and F-actin density were normalized to treatment with CCL19 only. Data shown for panels B to D are representative of two independent experiments and, error bars represent standard deviations. MFI, mean fluorescence intensity.
In light of these findings, we next used confocal microscopy (Fig. 5A and B) and flow cytometry (Fig. 5C) to evaluate whether exposure of TN and TCM cells to CCL19 increased F-actin density. As described by Permanyer et al., we observed a higher baseline of F-actin density in TCM cells than in TN cells (Fig. 5B and C) (47). However, we found no evidence that CCL19 increased F-actin density in either T cell subset after incubation with the chemokine for 2 days (Fig. 5B and C). It should be noted that Cameron et al. observed a rapid increase in F-actin density within only a few minutes of exposure to CCL19, but after 30 min no significant differences were noted (28). Collectively, these data suggest that the very transient CCL19-mediated increase in F-actin density, reported previously, cannot explain the increased permissiveness of resting CD4+ T cells to HIV-1 infection 48 h post-chemokine exposure.
FIG 5.

CCL19 does not have an effect on F-actin density in TN or TCM cells. (A) Representative confocal microscopy images of TN and TCM cells in the absence or presence of CCL19 or PMA plus IL-2 for 2 days. Phalloidin and DAPI were used to stain F-actin and nuclei, respectively. (B) Total F-actin volume was quantified in TN and TCM cells from confocal microscopy images using Imaris software. (C) Flow cytometric analysis of F-actin density was measured by phalloidin staining in TN or TCM cells under the same conditions as described for panel A. Data are representative of three independent experiments. MFI, mean fluorescence intensity.
CCL19 does not alter intracellular dNTP levels in CD4+ TN or TCM cells.
The sterile alpha motif (SAM) and histidine/aspartic acid (HD) domain-containing protein 1 (SAMHD1) imposes an effective restriction to HIV-1 infection in resting CD4+ T cells by enzymatically decreasing cellular dNTP pools and impeding HIV-1 reverse transcription (49–51). It has previously been shown that exogenous addition of dNTPs to resting, naive, or memory CD4+ T cells significantly enhances reverse transcription and viral integration without inducing T cell activation (52, 53). Therefore, we examined whether CCL19 could increase intracellular dNTP levels, which in turn would facilitate HIV-1 reverse transcription and viral infection of TN and TCM cells. Nucleotide levels in the TN and TCM cells were much lower than those in anti-CD3/CD28-activated cells (Table 3). However, treatment of TN or TCM cells with CCL19 did not increase the intracellular dNTP levels compared to those of the untreated controls (Table 3), which suggests that CCL19 does not enhance HIV-1 infection of TN and TCM cells by increasing the nucleotide pool concentration.
TABLE 3.
Intracellular dNTP levels in TN and TCM CD4+ T cells in the absence and presence of 100 nM CCL19
| Cell type and treatment | Nucleotide concn (fmol/106 cells)a |
|||
|---|---|---|---|---|
| dATP | dGTP | dCTP | dTTP | |
| TN cells | 8.70 (<4–10.7) | 32.0 (14.6–44.5) | 27.7 (<4–43.1) | 5.90 (<4–7.60) |
| TN cells + CCL19 | 4.70 (<4–6.10) | 28.2 (17.5–29.4) | 14.7 (<4–30.6) | 4.70 (<4–7.30) |
| TN + anti-CD3/CD28 | 379 (112–513) | 484 (404–622) | 88.6 (62.7–111) | 649 (244–735) |
| TCM cells | 3.70 (<4–5.8) | 30.0 (19.5–77.1) | 11.5 (5.75–21.0) | 4.40 (<4–6.90) |
| TCM cells + CCL19 | 4.10 (<4–4.90) | 24.6 (11.6–61.6) | 10.0 (4.80–17.3) | 4.90 (<4–12.3) |
| TCM + anti-CD3/CD28 | 285 (57.2–294) | 232 (217–345) | 41.0 (31.9–61.8) | 164 (106–188) |
Data are presented as the median (range) of three independent experiments. A value of <4 indicates a level below the limit of detection based on the number of cells used for quantification.
Reactivation of HIV-1LAI from CD4+ TN and TCM cells.
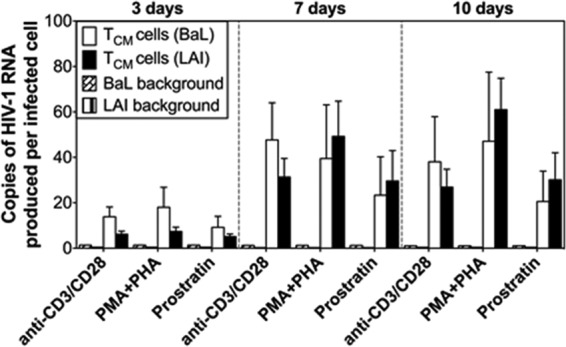
We next quantified total virus production (i.e., extracellular virion-associated RNA [vRNA] in the culture supernatant) from latently infected TN and TCM cells using an ultrasensitive assay capable of single-copy detection of HIV-1 RNA (40, 54) before and after exposure to the following latency-reversing agents (LRAs): (i) anti-CD3/CD28 antibodies (3 beads per cell), (ii) 10 nM phorbol 12-myristate 13-acetate (PMA) plus 10 μg/ml PHA, (iii) 5 μM prostratin, or (iv) 500 nM suberoylanilide hydroxamic acid (SAHA) (Fig. 6A). As expected, we saw more total virus production from TCM cells than from the TN cells (Fig. 6B), which is consistent with the observation that the TCM population contained significantly higher levels of HIV-1 DNA.
FIG 6.

Reversal of HIV-1 latency in CD4+ TN and TCM cells infected with HIV-1LAI following treatment with LRAs. (A) Schematic representation of the experimental approach. (B) Total copies of extracellular virion-associated HIV-1LAI RNA produced from TN or TCM cells after exposure to anti-CD3/CD28 antibodies, PMA-PHA, prostratin, or SAHA. Background HIV-1 RNA from unstimulated controls at each time point is also shown. Data are the means ± the standard errors of the means from 6 donors. (C) Copies of extracellular virion-associated HIV-1LAI RNA produced per infected TN or TCM cell after exposure to anti-CD3/CD28 antibodies, PMA-PHA, prostratin, or SAHA, normalized to the level of infection at each respective time point. Background HIV-1 RNA from unstimulated controls is shown. Data are shown as the means ± standard errors of the means from 6 donors. (D) Copies of extracellular vRNA produced per infected TN or TCM cell after exposure to anti-CD3/CD28 antibodies from 6 donors. The contribution of unintegrated HIV-1LAI DNA to the total vRNA copy number after exposure of infected TN cells (E) or TCM cells (F) with anti-CD3/CD28 antibodies was determined with or without EFV only or EFV-RAL treatment throughout the experiment. Unstimulated cells treated with EFV only were used as a control. Cells stimulated in the absence of any antiretroviral drugs were used as a positive control. Data are representative of two independent experiments.
To account for differences in HIV-1 infection frequency between the TN and TCM cell subsets, as well as between different donors, we normalized extracellular vRNA production to the total HIV-1 DNA copy number/cell at each respective time point (Fig. 6C). Surprisingly our data revealed that TN cells exposed to anti-CD3/CD28 antibodies, PMA-PHA, or prostratin yielded as much (or more) vRNA as the TCM cells (Fig. 6C). For example, at day 10 the median production of extracellular HIV-1LAI vRNA after exposure to anti-CD3/CD28 antibodies, PMA-PHA, or prostratin was 69.7, 71.5, and 29.6 vRNA copies/infected cell from TN cells, compared to 18.8, 57.2, and 21.2 vRNA copies/infected cell from TCM cells, respectively. There was, however, significant variation between donors (Fig. 6D). For example, in donors 2, 4, 5, and 6, more extracellular HIV-1LAI vRNA was produced from the TN cells, whereas more HIV-1LAI was produced from the TCM cells of donor 3 (Fig. 6D). Collectively, these data suggest that donor genetic differences, in addition to the resting CD4+ T cell compartment, impact the establishment and reversal of HIV-1 latency. In contrast to the other LRAs, SAHA did not significantly increase vRNA production in either TN or TCM cells (Fig. 6B and C). This finding is consistent with recent studies that demonstrated the inability of SAHA to increase extracellular HIV-1 production from resting CD4+ T cells isolated from infected individuals on suppressive ART (55–57).
Many HIV-1 reverse transcripts fail to integrate, resulting in the accumulation of viral DNA that has the potential to persist in resting CD4+ T cells (58–61). To exclude the possibility that some forms of this unintegrated HIV-1 DNA become integrated upon T cell activation, resulting in productive infection and virus particle production, we next assessed the contribution of unintegrated HIV-1LAI DNA to extracellular vRNA production from both TN and TCM cells by including the integrase inhibitor raltegravir (RAL) at the same time as anti-CD3/CD28 (Fig. 6E and F). This analysis suggested that unintegrated viral DNA did not significantly contribute to the extracellular vRNA quantified in the supernatant following reversal of latency in our model system.
Reactivation of HIV-1BaL from CD4+ TN and TCM cells.
We also evaluated extracellular HIV-1BaL RNA production from infected TN and TCM cells exposed to the same LRAs; however, we excluded SAHA, given that we did not see an effect in our previous experiments (Fig. 6B and C). HIV-1BaL vRNA was produced from TCM cells, with no differences noted compared to production by HIV-1LAI (Fig. 7). In contrast, almost no detectable HIV-1BaL vRNA was produced from the TN cells (Fig. 7). However, as shown by the data in Fig. 1, these cells were largely refractory to infection by HIV-1BaL.
FIG 7.
Reversal of HIV-1 latency in CD4+ TCM cells infected with HIV-1BaL following treatment with LRAs. The experimental approach was the same here as shown in Fig. 5A. The number of copies of extracellular virion-associated HIV-1BaL RNA produced per infected TCM cell after exposure to anti-CD3/CD28 antibodies, PMA-PHA, or prostratin, normalized to the level of infection at each respective time point, is shown. Background HIV-1 RNA from unstimulated controls at each time point is shown. Data are shown as the means ± standard errors of the means from 3 donors. For comparative purposes, data for HIV-1LAI RNA from infected TCM cells (Fig. 6C) are included.
Decay of HIV-1LAI-infected CD4+ TN and TCM cells after exposure to latency-reversing agents.
We next measured the decay kinetics of HIV-1LAI-infected cells in both T cell populations after exposure to the different LRAs (Fig. 8A and B). The rates of decay (half-life [t1/2]) of the HIV-1LAI-infected TN cells treated with anti-CD3/CD28, PMA-PHA, or prostratin were 4.2, 3.5, and 4.8 days, respectively (Fig. 8A), similar to the values calculated for the TCM cells (2.6, 2.5, and 5.2 days for cells treated with anti-CD3/CD28, PMA-PHA, and prostratin, respectively) (Fig. 8B). No decay was observed in either TN or TCM cells treated with SAHA. Of note, the anti-CD3/CD28 antibodies, PMA-PHA, and prostratin all induced cell activation in both T cell subsets, as evidenced by increased expression of CD69, CD25, and HLA-DR (Fig. 8C). The levels of cellular activation were also similar between TN and TCM cells and likely do not contribute to the differences observed in virus production between these cell types.
FIG 8.

Decay of HIV-1LAI-infected cells and T cell activation posttreatment of latently infected CD4+ TN and TCM cells. Decay of HIV-1LAI-infected TN (A) or TCM (B) cells was measured over 10 days of treatment with anti-CD3/CD28 antibodies, PMA-PHA, prostratin, or SAHA. Total intracellular HIV-1 DNA was quantified as described in the legend of Fig. 1. Data are presented as the means ± standard errors of the means from 6 donors (except for the SAHA data, where n = 4). (C) Cellular proliferation of TN and TCM cells was measured by qPCR of the CCR5 gene following stimulation with anti-CD3/CD28 antibodies, PMA-PHA, prostratin, or SAHA. Background samples represent unstimulated CD4+ TN and TCM cells. Data are presented as the means ± standard errors of the means (n = 6, except for SAHA data, where n = 4). (D) T cell activation was measured by antibody staining and flow cytometry of the surface expression of CD25, CD69, and HLA-DR on TN or TCM cells at 3, 7, and 10 days after treatment with anti-CD3/CD28 antibodies, PMA-PHA, prostratin, or SAHA. Untreated cells were used as a negative control. Data are representative of two independent experiments.
DISCUSSION
Latently infected resting CD4+ T cells constitute the major reservoir of persistent HIV-1 infection, and significant reduction or elimination of this reservoir could lead to either a functional or sterilizing cure, respectively. It has been hypothesized that therapeutic approaches that reactivate latent HIV-1 infection will promote death of the infected cell by viral cytopathic effects and/or by host cell effector mechanisms (62). This strategy is typically referred to as the “kick-and-kill” approach (63). The resting CD4+ T cell population, however, is heterogeneous and consists of different T cell subsets, including naive and memory cells. It is not known whether the kick-and-kill approach will be equally effective in the different T cell subsets, which differ in life span, proliferative capacity, antigen response time, residence throughout the body, and CCR5 and CXCR4 expression levels (22–24). Therefore, mechanistic insights into the establishment and reversal of latent HIV-1 infection in different resting CD4+ T cell subsets could provide important clues to eradicating this persistent reservoir.
In this study, we compared the establishment and reversal of HIV-1 latency in resting CD4+ TN and TCM cells using a primary cell model of latency that utilizes direct infection of highly purified cells. Prior studies demonstrated that HIV-1 latency could be established in vitro in resting CD4+ T cells pretreated with chemokines that bind to the CCR6, CCR7, or CXCR3 receptor (28). From an important biological perspective, the concentration of CCL19 (the chemokine ligand for CCR7 used in this study) significantly increases during the acute phase of HIV-1 infection in which the latent reservoir is established and correlates with disease progression (64–67). Furthermore, pretreatment of TN or TCM cells with CCL19 does not induce T cell activation or proliferation (Fig. 3). Thus, the integrity of the purified T cell subsets is largely preserved in the experiment, which was an important prerequisite for the objectives of this study.
We show that CCL19 pretreatment of TN and TCM cells significantly increased the capacity for X4-tropic HIV-1 to infect these cells (Fig. 1). However, as reported in other in vitro systems (10, 53, 68), the levels of HIV-1 infection in the TCM cells, as assessed by quantitation of total viral DNA, were higher than in the TN cells. In contrast, CCL19 increased R5-tropic virus infection of only TCM cells and not TN cells, a finding which may be attributable to the extremely low levels of CCR5 expression on TN cells isolated from healthy donors (Fig. 2). Interestingly, several studies have demonstrated that R5-tropic virus can be isolated from CD4+ TN cells from HIV-infected individuals (15, 17, 69, 70). There are two possible explanations that could account for the discrepancies between in vitro studies and the in vivo observations: (i) HIV-1 infection systematically upregulates CCR5 expression on TN cells, thus making them more susceptible to infection (71–74), and/or (ii) R5-tropic virus may be more efficiently transferred to TN cells by plasmacytoid dendritic cells (75–77). Further studies, however, are needed to elucidate the mechanism(s) by which TN cells become infected in vivo.
We also attempted to address the mechanism by which CCL19 increases the ability of HIV-1 to infect TN and TCM cells. In this regard, Cameron et al. (28) reported that ligation of the CCR6, CCR7, and CXCR3 receptors led to changes in cortical actin, allowing rapid migration of the preintegration complex to the nucleus and efficient nuclear localization and integration. While our data show a critical role for F-actin density in the ability of HIV-1 to infect resting CD4+ T cells (Fig. 4) and suggest that TN cells may be less susceptible to HIV-1 infection than TCM cells due to a lower F-actin density, as reported previously (46, 47), our comprehensive imaging and flow cytometry data do not support a role for CCL19 in increasing F-actin density in either cell type (Fig. 5). SAMHD1 has also been identified as an effective restriction factor to HIV-1 infection in resting CD4+ T cells by enzymatically decreasing cellular dNTP pools and impeding HIV-1 reverse transcription (22, 49, 51, 78). Interestingly, blockade or degradation of SAMHD1 has been shown to greatly enhance the susceptibility of resting CD4+ T cells to HIV-1 infection, especially in TN cells (50, 68). These findings are consistent with earlier studies showing that addition of dNTPs to TN or memory cells significantly enhanced reverse transcription and integration (52, 53). In this study, we found that CCL19 does not alter intracellular dNTP concentrations and that HIV-1 can infect both TN and TCM cells despite low nucleotide concentrations. Collectively, these data suggest that CCL19 pretreatment could potentially impact an as yet undocumented restriction factor in resting CD4+ T cells.
An unexpected finding from this study was that TN cells exposed to LRAs produced as much (if not more) extracellular virion-associated RNA per infected cell as the TCM population (Fig. 6). This observation was found to be independent of the LRA used. These data would suggest that more latently infected TN cells could produce virus than TCM cells. However, we observed no major differences in the genomic distribution of HIV-1 integration sites between the two T cell subsets. Given these differences in virus production between TN and TCM cells, we also evaluated whether HIV-1 reactivation resulted in death of the infected cell. We found that the rates of decay of the HIV-1-infected cells in the TN and TCM populations treated with anti-CD3/CD28 antibodies, PMA-PHA, or prostratin were largely equivalent (Fig. 7). Using a different in vitro primary cell model of latency, Shan et al. reported that if the LRA induced T cell activation, reactivation of latent HIV-1 resulted in death of the infected cell (79). Our data support this finding. However, Shan et al. (79) reported that following administration of SAHA, which does not induce T cell activation, the HIV-infected resting CD4+ T cell population survived, even in the presence of autologous cytolytic T lymphocytes. In other words, SAHA facilitated the kick but not the kill. In contrast, we observed that SAHA promoted neither reactivation of latent HIV-1 nor death of the infected cell. Alternatively, in both primary cell models of latency, the decrease in frequency of HIV-1-infected cells could be due to preferential expansion of only the uninfected cell population after T cell activation.
In conclusion, this study highlights the differences in regard to the establishment and reversal of HIV-1 latency in TN and TCM cells. Importantly, the data reveal that despite low infection frequency, TN cells produce as much (if not more) extracellular virion-associated vRNA per infected cell as TCM cells. This suggests that TN cells may be an important reservoir of latent HIV-1 infection and should not be ignored simply because the frequency of infection of these cells is lower than that in the memory T cell subsets in infected individuals on ART. Importantly, we have presented a novel approach to study HIV-1 latency in a primary cell model, focusing specifically on CD4+ TN and TCM cell subsets that can further be used to understand the establishment, maintenance, and reversal of latency in both subsets.
REFERENCES
- 1.Chun TW, Engel D, Berrey MM, Shea T, Corey L, Fauci AS. 1998. Early establishment of a pool of latently infected, resting CD4+ T cells during primary HIV-1 infection. Proc Natl Acad Sci U S A 95:8869–8873. doi: 10.1073/pnas.95.15.8869. [DOI] [PMC free article] [PubMed] [Google Scholar]
- 2.Schacker T, Little S, Connick E, Gebhard K, Zhang ZQ, Krieger J, Pryor J, Havlir D, Wong JK, Schooley RT, Richman D, Corey L, Haase AT. 2001. Productive infection of T cells in lymphoid tissues during primary and early human immunodeficiency virus infection. J Infect Dis 183:555–562. doi: 10.1086/318524. [DOI] [PubMed] [Google Scholar]
- 3.Schacker T, Little S, Connick E, Gebhard-Mitchell K, Zhang ZQ, Krieger J, Pryor J, Havlir D, Wong JK, Richman D, Corey L, Haase AT. 2000. Rapid accumulation of human immunodeficiency virus (HIV) in lymphatic tissue reservoirs during acute and early HIV infection: implications for timing of antiretroviral therapy. J Infect Dis 181:354–357. doi: 10.1086/315178. [DOI] [PubMed] [Google Scholar]
- 4.Archin NM, Vaidya NK, Kuruc JD, Liberty AL, Wiegand A, Kearney MF, Cohen MS, Coffin JM, Bosch RJ, Gay CL, Eron JJ, Margolis DM, Perelson AS. 2012. Immediate antiviral therapy appears to restrict resting CD4+ cell HIV-1 infection without accelerating the decay of latent infection. Proc Natl Acad Sci U S A 109:9523–9528. doi: 10.1073/pnas.1120248109. [DOI] [PMC free article] [PubMed] [Google Scholar]
- 5.Whitney JB, Hill AL, Sanisetty S, Penaloza-MacMaster P, Liu J, Shetty M, Parenteau L, Cabral C, Shields J, Blackmore S, Smith JY, Brinkman AL, Peter LE, Mathew SI, Smith KM, Borducchi EN, Rosenbloom DI, Lewis MG, Hattersley J, Li B, Hesselgesser J, Geleziunas R, Robb ML, Kim JH, Michael NL, Barouch DH. 2014. Rapid seeding of the viral reservoir prior to SIV viraemia in rhesus monkeys. Nature 512:74–77. doi: 10.1038/nature13594. [DOI] [PMC free article] [PubMed] [Google Scholar]
- 6.Chomont N, El-Far M, Ancuta P, Trautmann L, Procopio FA, Yassine-Diab B, Boucher G, Boulassel MR, Ghattas G, Brenchley JM, Schacker TW, Hill BJ, Douek DC, Routy JP, Haddad EK, Sekaly RP. 2009. HIV reservoir size and persistence are driven by T cell survival and homeostatic proliferation. Nat Med 15:893–900. doi: 10.1038/nm.1972. [DOI] [PMC free article] [PubMed] [Google Scholar]
- 7.Bacchus C, Cheret A, Avettand-Fenoel V, Nembot G, Melard A, Blanc C, Lascoux-Combe C, Slama L, Allegre T, Allavena C, Yazdanpanah Y, Duvivier C, Katlama C, Goujard C, Seksik BC, Leplatois A, Molina JM, Meyer L, Autran B, Rouzioux C, OPTIPRIM ANRS 147 Study Group . 2013. A single HIV-1 cluster and a skewed immune homeostasis drive the early spread of HIV among resting CD4+ cell subsets within one month post-infection. PLoS One 8:e64219. doi: 10.1371/journal.pone.0064219. [DOI] [PMC free article] [PubMed] [Google Scholar]
- 8.Saez-Cirion A, Bacchus C, Hocqueloux L, Avettand-Fenoel V, Girault I, Lecuroux C, Potard V, Versmisse P, Melard A, Prazuck T, Descours B, Guergnon J, Viard JP, Boufassa F, Lambotte O, Goujard C, Meyer L, Costagliola D, Venet A, Pancino G, Autran B, Rouzioux C, ANRS VISCONTI Study Group . 2013. Post-treatment HIV-1 controllers with a long-term virological remission after the interruption of early initiated antiretroviral therapy ANRS VISCONTI study. PLoS Pathog 9:e1003211. doi: 10.1371/journal.ppat.1003211. [DOI] [PMC free article] [PubMed] [Google Scholar]
- 9.Soriano-Sarabia N, Bateson RE, Dahl NP, Crooks AM, Kuruc JD, Margolis DM, Archin NM. 2014. Quantitation of replication-competent HIV-1 in populations of resting CD4+ T cells. J Virol 88:14070–14077. doi: 10.1128/JVI.01900-14. [DOI] [PMC free article] [PubMed] [Google Scholar]
- 10.Buzon MJ, Sun H, Li C, Shaw A, Seiss K, Ouyang Z, Martin-Gayo E, Leng J, Henrich TJ, Li JZ, Pereyra F, Zurakowski R, Walker BD, Rosenberg ES, Yu XG, Lichterfeld M. 2014. HIV-1 persistence in CD4+ T cells with stem cell-like properties. Nat Med 20:139–142. doi: 10.1038/nm.3445. [DOI] [PMC free article] [PubMed] [Google Scholar]
- 11.Brenchley JM, Hill BJ, Ambrozak DR, Price DA, Guenaga FJ, Casazza JP, Kuruppu J, Yazdani J, Migueles SA, Connors M, Roederer M, Douek DC, Koup RA. 2004. T-cell subsets that harbor human immunodeficiency virus (HIV) in vivo: implications for HIV pathogenesis. J Virol 78:1160–1168. doi: 10.1128/JVI.78.3.1160-1168.2004. [DOI] [PMC free article] [PubMed] [Google Scholar]
- 12.Wightman F, Solomon A, Khoury G, Green JA, Gray L, Gorry PR, Ho YS, Saksena NK, Hoy J, Crowe SM, Cameron PU, Lewin SR. 2010. Both CD31+ and CD31− naive CD4+ T cells are persistent HIV type 1-infected reservoirs in individuals receiving antiretroviral therapy. J Infect Dis 202:1738–1748. doi: 10.1086/656721. [DOI] [PubMed] [Google Scholar]
- 13.Ganesan A, Chattopadhyay PK, Brodie TM, Qin J, Gu W, Mascola JR, Michael NL, Follmann DA, Roederer M, Infectious Disease Clinical Research Program HIV Working Group . 2010. Immunologic and virologic events in early HIV infection predict subsequent rate of progression. J Infect Dis 201:272–284. doi: 10.1086/649430. [DOI] [PMC free article] [PubMed] [Google Scholar]
- 14.Fabre-Mersseman V, Dutrieux J, Louise A, Rozlan S, Lamine A, Parker R, Rancez M, Nunes-Cabaco H, Sousa AE, Lambotte O, Cheynier R. 2011. CD4+ recent thymic emigrants are infected by HIV in vivo, implication for pathogenesis. AIDS 25:1153–1162. doi: 10.1097/QAD.0b013e3283471e89. [DOI] [PubMed] [Google Scholar]
- 15.Heeregrave EJ, Geels MJ, Brenchley JM, Baan E, Ambrozak DR, van der Sluis RM, Bennemeer R, Douek DC, Goudsmit J, Pollakis G, Koup RA, Paxton WA. 2009. Lack of in vivo compartmentalization among HIV-1 infected naive and memory CD4+ T cell subsets. Virology 393:24–32. doi: 10.1016/j.virol.2009.07.011. [DOI] [PMC free article] [PubMed] [Google Scholar]
- 16.Douek DC, Brenchley JM, Betts MR, Ambrozak DR, Hill BJ, Okamoto Y, Casazza JP, Kuruppu J, Kunstman K, Wolinsky S, Grossman Z, Dybul M, Oxenius A, Price DA, Connors M, Koup RA. 2002. HIV preferentially infects HIV-specific CD4+ T cells. Nature 417:95–98. doi: 10.1038/417095a. [DOI] [PubMed] [Google Scholar]
- 17.Ostrowski MA, Chun TW, Justement SJ, Motola I, Spinelli MA, Adelsberger J, Ehler LA, Mizell SB, Hallahan CW, Fauci AS. 1999. Both memory and CD45RA+/CD62L+ naive CD4+ T cells are infected in human immunodeficiency virus type 1-infected individuals. J Virol 73:6430–6435. [DOI] [PMC free article] [PubMed] [Google Scholar]
- 18.Josefsson L, Palmer S, Faria NR, Lemey P, Casazza J, Ambrozak D, Kearney M, Shao W, Kottilil S, Sneller M, Mellors J, Coffin JM, Maldarelli F. 2013. Single cell analysis of lymph node tissue from HIV-1 infected patients reveals that the majority of CD4+ T-cells contain one HIV-1 DNA molecule. PLoS Pathog 9:e1003432. doi: 10.1371/journal.ppat.1003432. [DOI] [PMC free article] [PubMed] [Google Scholar]
- 19.Centlivre M, Legrand N, Steingrover R, van der Sluis R, Grijsen ML, Bakker M, Jurriaans S, Berkhout B, Paxton WA, Prins JM, Pollakis G. 2011. Altered dynamics and differential infection profiles of lymphoid and myeloid cell subsets during acute and chronic HIV-1 infection. J Leukoc Biol 89:785–795. doi: 10.1189/jlb.0410231. [DOI] [PubMed] [Google Scholar]
- 20.Baldanti F, Paolucci S, Gulminetti R, Maserati R, Migliorino G, Pan A, Maggiolo F, Comolli G, Chiesa A, Gerna G. 2001. Higher levels of HIV DNA in memory and naive CD4+ T cell subsets of viremic compared to non-viremic patients after 18 and 24 months of HAART. Antiviral Res 50:197–206. doi: 10.1016/S0166-3542(01)00142-5. [DOI] [PubMed] [Google Scholar]
- 21.Lambotte O, Demoustier A, de Goer MG, Wallon C, Gasnault J, Goujard C, Delfraissy JF, Taoufik Y. 2002. Persistence of replication-competent HIV in both memory and naive CD4 T cell subsets in patients on prolonged and effective HAART. AIDS 16:2151–2157. doi: 10.1097/00002030-200211080-00007. [DOI] [PubMed] [Google Scholar]
- 22.Descours B, Avettand-Fenoel V, Blanc C, Samri A, Melard A, Supervie V, Theodorou I, Carcelain G, Rouzioux C, Autran B, ALT ANRS CO15 Stdy Group . 2012. Immune responses driven by protective human leukocyte antigen alleles from long-term nonprogressors are associated with low HIV reservoir in central memory CD4 T cells. Clin Infect Dis 54:1495–1503. doi: 10.1093/cid/cis188. [DOI] [PubMed] [Google Scholar]
- 23.Lee B, Sharron M, Montaner LJ, Weissman D, Doms RW. 1999. Quantification of CD4, CCR5, and CXCR4 levels on lymphocyte subsets, dendritic cells, and differentially conditioned monocyte-derived macrophages. Proc Natl Acad Sci U S A 96:5215–5220. doi: 10.1073/pnas.96.9.5215. [DOI] [PMC free article] [PubMed] [Google Scholar]
- 24.Lees JR, Farber DL. 2010. Generation, persistence and plasticity of CD4 T-cell memories. Immunology 130:463–470. doi: 10.1111/j.1365-2567.2010.03288.x. [DOI] [PMC free article] [PubMed] [Google Scholar]
- 25.Chun TW, Carruth L, Finzi D, Shen X, DiGiuseppe JA, Taylor H, Hermankova M, Chadwick K, Margolick J, Quinn TC, Kuo YH, Brookmeyer R, Zeiger MA, Barditch-Crovo P, Siliciano RF. 1997. Quantification of latent tissue reservoirs and total body viral load in HIV-1 infection. Nature 387:183–188. doi: 10.1038/387183a0. [DOI] [PubMed] [Google Scholar]
- 26.Hermankova M, Siliciano JD, Zhou Y, Monie D, Chadwick K, Margolick JB, Quinn TC, Siliciano RF. 2003. Analysis of human immunodeficiency virus type 1 gene expression in latently infected resting CD4+ T lymphocytes in vivo. J Virol 77:7383–7392. doi: 10.1128/JVI.77.13.7383-7392.2003. [DOI] [PMC free article] [PubMed] [Google Scholar]
- 27.Eriksson S, Graf EH, Dahl V, Strain MC, Yukl SA, Lysenko ES, Bosch RJ, Lai J, Chioma S, Emad F, Abdel-Mohsen M, Hoh R, Hecht F, Hunt P, Somsouk M, Wong J, Johnston R, Siliciano RF, Richman DD, O'Doherty U, Palmer S, Deeks SG, Siliciano JD. 2013. Comparative analysis of measures of viral reservoirs in HIV-1 eradication studies. PLoS Pathog 9:e1003174. doi: 10.1371/journal.ppat.1003174. [DOI] [PMC free article] [PubMed] [Google Scholar]
- 28.Cameron PU, Saleh S, Sallmann G, Solomon A, Wightman F, Evans VA, Boucher G, Haddad EK, Sekaly RP, Harman AN, Anderson JL, Jones KL, Mak J, Cunningham AL, Jaworowski A, Lewin SR. 2010. Establishment of HIV-1 latency in resting CD4+ T cells depends on chemokine-induced changes in the actin cytoskeleton. Proc Natl Acad Sci U S A 107:16934–16939. doi: 10.1073/pnas.1002894107. [DOI] [PMC free article] [PubMed] [Google Scholar]
- 29.Saleh S, Solomon A, Wightman F, Xhilaga M, Cameron PU, Lewin SR. 2007. CCR7 ligands CCL19 and CCL21 increase permissiveness of resting memory CD4+ T cells to HIV-1 infection: a novel model of HIV-1 latency. Blood 110:4161–4164. doi: 10.1182/blood-2007-06-097907. [DOI] [PubMed] [Google Scholar]
- 30.Shi C, Mellors JW. 1997. A recombinant retroviral system for rapid in vivo analysis of human immunodeficiency virus type 1 susceptibility to reverse transcriptase inhibitors. Antimicrob Agents Chemother 41:2781–2785. [DOI] [PMC free article] [PubMed] [Google Scholar]
- 31.Cecilia D, KewalRamani VN, O'Leary J, Volsky B, Nyambi P, Burda S, Xu S, Littman DR, Zolla-Pazner S. 1998. Neutralization profiles of primary human immunodeficiency virus type 1 isolates in the context of coreceptor usage. J Virol 72:6988–6996. [DOI] [PMC free article] [PubMed] [Google Scholar]
- 32.Gartner S, Markovits P, Markovitz DM, Kaplan MH, Gallo RC, Popovic M. 1986. The role of mononuclear phagocytes in HTLV-III/LAV infection. Science 233:215–219. doi: 10.1126/science.3014648. [DOI] [PubMed] [Google Scholar]
- 33.Cillo AR, Krishnan A, Mitsuyasu RT, McMahon DK, Li S, Rossi JJ, Zaia JA, Mellors JW. 2013. Plasma viremia and cellular HIV-1 DNA persist despite autologous hematopoietic stem cell transplantation for HIV-related lymphoma. J Acquir Immune Defic Syndr 63:438–441. doi: 10.1097/QAI.0b013e31828e6163. [DOI] [PMC free article] [PubMed] [Google Scholar]
- 34.Gandhi RT, Coombs RW, Chan ES, Bosch RJ, Zheng L, Margolis DM, Read S, Kallungal B, Chang M, Goecker EA, Wiegand A, Kearney M, Jacobson JM, D'Aquila R, Lederman MM, Mellors JW, Eron JJ, AIDS Clinical Trials Group (ACTG) A5244 Team . 2012. No effect of raltegravir intensification on viral replication markers in the blood of HIV-1-infected patients receiving antiretroviral therapy. J Acquir Immune Defic Syndr 59:229–235. doi: 10.1097/QAI.0b013e31823fd1f2. [DOI] [PMC free article] [PubMed] [Google Scholar]
- 35.Malnati MS, Scarlatti G, Gatto F, Salvatori F, Cassina G, Rutigliano T, Volpi R, Lusso P. 2008. A universal real-time PCR assay for the quantification of group-M HIV-1 proviral load. Nat Protoc 3:1240–1248. doi: 10.1038/nprot.2008.108. [DOI] [PubMed] [Google Scholar]
- 36.Quinlan AR, Clark RA, Sokolova S, Leibowitz ML, Zhang Y, Hurles ME, Mell JC, Hall IM. 2010. Genome-wide mapping and assembly of structural variant breakpoints in the mouse genome. Genome Res 20:623–635. doi: 10.1101/gr.102970.109. [DOI] [PMC free article] [PubMed] [Google Scholar]
- 37.R Development Core Team. 2013. R: a language and environment for statistical computing. R Foundation for Statistical Computing, Vienna, Austria. [Google Scholar]
- 38.Matreyek KA, Wang W, Serrao E, Singh PK, Levin HL, Engelman A. 2014. Host and viral determinants for MxB restriction of HIV-1 infection. Retrovirology 11:90. doi: 10.1186/s12977-014-0090-z. [DOI] [PMC free article] [PubMed] [Google Scholar]
- 39.Diamond TL, Roshal M, Jamburuthugoda VK, Reynolds HM, Merriam AR, Lee KY, Balakrishnan M, Bambara RA, Planelles V, Dewhurst S, Kim B. 2004. Macrophage tropism of HIV-1 depends on efficient cellular dNTP utilization by reverse transcriptase. J Biol Chem 279:51545–51553. doi: 10.1074/jbc.M408573200. [DOI] [PMC free article] [PubMed] [Google Scholar]
- 40.Palmer S, Wiegand AP, Maldarelli F, Bazmi H, Mican JM, Polis M, Dewar RL, Planta A, Liu S, Metcalf JA, Mellors JW, Coffin JM. 2003. New real-time reverse transcriptase-initiated PCR assay with single-copy sensitivity for human immunodeficiency virus type 1 RNA in plasma. J Clin Microbiol 41:4531–4536. doi: 10.1128/JCM.41.10.4531-4536.2003. [DOI] [PMC free article] [PubMed] [Google Scholar]
- 41.Saleh S, Wightman F, Ramanayake S, Alexander M, Kumar N, Khoury G, Pereira C, Purcell D, Cameron PU, Lewin SR. 2011. Expression and reactivation of HIV in a chemokine induced model of HIV latency in primary resting CD4+ T cells. Retrovirology 8:80. doi: 10.1186/1742-4690-8-80. [DOI] [PMC free article] [PubMed] [Google Scholar]
- 42.Butler SL, Hansen MS, Bushman FD. 2001. A quantitative assay for HIV DNA integration in vivo. Nat Med 7:631–634. doi: 10.1038/87979. [DOI] [PubMed] [Google Scholar]
- 43.Schroder AR, Shinn P, Chen H, Berry C, Ecker JR, Bushman F. 2002. HIV-1 integration in the human genome favors active genes and local hotspots. Cell 110:521–529. doi: 10.1016/S0092-8674(02)00864-4. [DOI] [PubMed] [Google Scholar]
- 44.Sowd GA, Serrao E, Wang H, Wang W, Fadel HJ, Poeschla EM, Engelman AN. 2016. A critical role for alternative polyadenylation factor CPSF6 in targeting HIV-1 integration to transcriptionally active chromatin. Proc Natl Acad Sci U S A 113:E1054–E1063. doi: 10.1073/pnas.1524213113. [DOI] [PMC free article] [PubMed] [Google Scholar]
- 45.Yoder A, Yu D, Dong L, Iyer SR, Xu X, Kelly J, Liu J, Wang W, Vorster PJ, Agulto L, Stephany DA, Cooper JN, Marsh JW, Wu Y. 2008. HIV envelope-CXCR4 signaling activates cofilin to overcome cortical actin restriction in resting CD4 T cells. Cell 134:782–792. doi: 10.1016/j.cell.2008.06.036. [DOI] [PMC free article] [PubMed] [Google Scholar]
- 46.Wang W, Guo J, Yu D, Vorster PJ, Chen W, Wu Y. 2012. A dichotomy in cortical actin and chemotactic actin activity between human memory and naive T cells contributes to their differential susceptibility to HIV-1 infection. J Biol Chem 287:35455–35469. doi: 10.1074/jbc.M112.362400. [DOI] [PMC free article] [PubMed] [Google Scholar]
- 47.Permanyer M, Pauls E, Badia R, Este JA, Ballana E. 2013. The cortical actin determines different susceptibility of naive and memory CD4+ T cells to HIV-1 cell-to-cell transmission and infection. PLoS One 8:e79221. doi: 10.1371/journal.pone.0079221. [DOI] [PMC free article] [PubMed] [Google Scholar]
- 48.Vorster PJ, Guo J, Yoder A, Wang W, Zheng Y, Xu X, Yu D, Spear M, Wu Y. 2011. LIM kinase 1 modulates cortical actin and CXCR4 cycling and is activated by HIV-1 to initiate viral infection. J Biol Chem 286:12554–12564. doi: 10.1074/jbc.M110.182238. [DOI] [PMC free article] [PubMed] [Google Scholar]
- 49.Baldauf HM, Pan X, Erikson E, Schmidt S, Daddacha W, Burggraf M, Schenkova K, Ambiel I, Wabnitz G, Gramberg T, Panitz S, Flory E, Landau NR, Sertel S, Rutsch F, Lasitschka F, Kim B, Konig R, Fackler OT, Keppler OT. 2012. SAMHD1 restricts HIV-1 infection in resting CD4+ T cells. Nat Med 18:1682–1687. doi: 10.1038/nm.2964. [DOI] [PMC free article] [PubMed] [Google Scholar]
- 50.Descours B, Cribier A, Chable-Bessia C, Ayinde D, Rice G, Crow Y, Yatim A, Schwartz O, Laguette N, Benkirane M. 2012. SAMHD1 restricts HIV-1 reverse transcription in quiescent CD4+ T-cells. Retrovirology 9:87. doi: 10.1186/1742-4690-9-87. [DOI] [PMC free article] [PubMed] [Google Scholar]
- 51.Goldstone DC, Ennis-Adeniran V, Hedden JJ, Groom HC, Rice GI, Christodoulou E, Walker PA, Kelly G, Haire LF, Yap MW, de Carvalho LP, Stoye JP, Crow YJ, Taylor IA, Webb M. 2011. HIV-1 restriction factor SAMHD1 is a deoxynucleoside triphosphate triphosphohydrolase. Nature 480:379–382. doi: 10.1038/nature10623. [DOI] [PubMed] [Google Scholar]
- 52.Plesa G, Dai J, Baytop C, Riley JL, June CH, O'Doherty U. 2007. Addition of deoxynucleosides enhances human immunodeficiency virus type 1 integration and 2LTR formation in resting CD4+ T cells. J Virol 81:13938–13942. doi: 10.1128/JVI.01745-07. [DOI] [PMC free article] [PubMed] [Google Scholar]
- 53.Dai J, Agosto LM, Baytop C, Yu JJ, Pace MJ, Liszewski MK, O'Doherty U. 2009. Human immunodeficiency virus integrates directly into naive resting CD4+ T cells but enters naive cells less efficiently than memory cells. J Virol 83:4528–4537. doi: 10.1128/JVI.01910-08. [DOI] [PMC free article] [PubMed] [Google Scholar]
- 54.Cillo AR, Vagratian D, Bedison MA, Anderson EM, Kearney MF, Fyne E, Koontz D, Coffin JM, Piatak M Jr, Mellors JW. 2014. Improved single-copy assays for quantification of persistent HIV-1 viremia in patients on suppressive antiretroviral therapy. J Clin Microbiol 52:3944–3951. doi: 10.1128/JCM.02060-14. [DOI] [PMC free article] [PubMed] [Google Scholar]
- 55.Cillo AR, Sobolewski MD, Bosch RJ, Fyne E, Piatak M Jr, Coffin JM, Mellors JW. 2014. Quantification of HIV-1 latency reversal in resting CD4+ T cells from patients on suppressive antiretroviral therapy. Proc Natl Acad Sci U S A 111:7078–7083. doi: 10.1073/pnas.1402873111. [DOI] [PMC free article] [PubMed] [Google Scholar]
- 56.Bullen CK, Laird GM, Durand CM, Siliciano JD, Siliciano RF. 2014. New ex vivo approaches distinguish effective and ineffective single agents for reversing HIV-1 latency in vivo. Nat Med 20:425–429. doi: 10.1038/nm.3489. [DOI] [PMC free article] [PubMed] [Google Scholar]
- 57.Blazkova J, Chun TW, Belay BW, Murray D, Justement JS, Funk EK, Nelson A, Hallahan CW, Moir S, Wender PA, Fauci AS. 2012. Effect of histone deacetylase inhibitors on HIV production in latently infected, resting CD4+ T cells from infected individuals receiving effective antiretroviral therapy. J Infect Dis 206:765–769. doi: 10.1093/infdis/jis412. [DOI] [PMC free article] [PubMed] [Google Scholar]
- 58.Sloan RD, Wainberg MA. 2011. The role of unintegrated DNA in HIV infection. Retrovirology 8:52. doi: 10.1186/1742-4690-8-52. [DOI] [PMC free article] [PubMed] [Google Scholar]
- 59.Chan CN, Trinité B, Lee CS, Mahajan S, Anand A, Wodarz D, Sabbaj S, Bansal A, Goepfert PA, Levy DN. 2016. HIV-1 latency and virus production from unintegrated genomes following direct infection of resting CD4 T cells. Retrovirology 13:1. doi: 10.1186/s12977-015-0234-9. [DOI] [PMC free article] [PubMed] [Google Scholar]
- 60.Thierry S, Munir S, Thierry E, Subra F, Leh H, Zamborlini A, Saenz D, Levy DN, Lesbats P, Saïb A, Parissi V, Poeschla E, Deprez E, Delelis O. 2015. Integrase inhibitor reversal dynamics indicate unintegrated HIV-1 DNA initiate de novo integration. Retrovirology 12:24. doi: 10.1186/s12977-015-0153-9. [DOI] [PMC free article] [PubMed] [Google Scholar]
- 61.Trinité B, Ohlson EC, Voznesensky I, Rana SP, Chan CN, Mahajan S, Alster J, Burke SA, Wodarz D, Levy DN. 2013. An HIV-1 replication pathway utilizing reverse transcription products that fail to integrate. J Virol 87:12701–12720. doi: 10.1128/JVI.01939-13. [DOI] [PMC free article] [PubMed] [Google Scholar]
- 62.Richman DD, Margolis DM, Delaney M, Greene WC, Hazuda D, Pomerantz RJ. 2009. The challenge of finding a cure for HIV infection. Science 323:1304–1307. doi: 10.1126/science.1165706. [DOI] [PubMed] [Google Scholar]
- 63.Hamer DH. 2004. Can HIV be cured? Mechanisms of HIV persistence and strategies to combat it. Curr HIV Res 2:99–111. [DOI] [PubMed] [Google Scholar]
- 64.Choi YK, Fallert BA, Murphey-Corb MA, Reinhart TA. 2003. Simian immunodeficiency virus dramatically alters expression of homeostatic chemokines and dendritic cell markers during infection in vivo. Blood 101:1684–1691. doi: 10.1182/blood-2002-08-2653. [DOI] [PubMed] [Google Scholar]
- 65.Damas JK, Landro L, Fevang B, Heggelund L, Froland SS, Aukrust P. 2009. Enhanced levels of the CCR7 ligands CCL19 and CCL21 in HIV infection: correlation with viral load, disease progression and response to highly active antiretroviral therapy. AIDS 23:135–138. doi: 10.1097/QAD.0b013e32831cf595. [DOI] [PubMed] [Google Scholar]
- 66.Damas JK, Landro L, Fevang B, Heggelund L, Tjonnfjord GE, Floisand Y, Halvorsen B, Froland SS, Aukrust P. 2009. Homeostatic chemokines CCL19 and CCL21 promote inflammation in human immunodeficiency virus-infected patients with ongoing viral replication. Clin Exp Immunol 157:400–407. doi: 10.1111/j.1365-2249.2009.03976.x. [DOI] [PMC free article] [PubMed] [Google Scholar]
- 67.Fontaine J, Poudrier J, Roger M. 2011. Short communication: persistence of high blood levels of the chemokines CCL2, CCL19, and CCL20 during the course of HIV infection. AIDS Res Hum Retroviruses 27:655–657. doi: 10.1089/aid.2010.0261. [DOI] [PubMed] [Google Scholar]
- 68.Tabler CO, Lucera MB, Haqqani AA, McDonald DJ, Migueles SA, Connors M, Tilton JC. 2014. CD4+ memory stem cells are infected by HIV-1 in a manner regulated in part by SAMHD1 expression. J Virol 88:4976–4986. doi: 10.1128/JVI.00324-14. [DOI] [PMC free article] [PubMed] [Google Scholar]
- 69.Keele BF, Giorgi EE, Salazar-Gonzalez JF, Decker JM, Pham KT, Salazar MG, Sun C, Grayson T, Wang S, Li H, Wei X, Jiang C, Kirchherr JL, Gao F, Anderson JA, Ping LH, Swanstrom R, Tomaras GD, Blattner WA, Goepfert PA, Kilby JM, Saag MS, Delwart EL, Busch MP, Cohen MS, Montefiori DC, Haynes BF, Gaschen B, Athreya GS, Lee HY, Wood N, Seoighe C, Perelson AS, Bhattacharya T, Korber BT, Hahn BH, Shaw GM. 2008. Identification and characterization of transmitted and early founder virus envelopes in primary HIV-1 infection. Proc Natl Acad Sci U S A 105:7552–7557. doi: 10.1073/pnas.0802203105. [DOI] [PMC free article] [PubMed] [Google Scholar]
- 70.Delobel P, Sandres-Saune K, Cazabat M, L'Faqihi FE, Aquilina C, Obadia M, Pasquier C, Marchou B, Massip P, Izopet J. 2005. Persistence of distinct HIV-1 populations in blood monocytes and naive and memory CD4 T cells during prolonged suppressive HAART. AIDS 19:1739–1750. doi: 10.1097/01.aids.0000183125.93958.26. [DOI] [PubMed] [Google Scholar]
- 71.de Roda Husman AM, Blaak H, Brouwer M, Schuitemaker H. 1999. CC chemokine receptor 5 cell-surface expression in relation to CC chemokine receptor 5 genotype and the clinical course of HIV-1 infection. J Immunol 163:4597–4603. [PubMed] [Google Scholar]
- 72.Meijerink H, Indrati AR, van Crevel R, Joosten I, Koenen H, van der Ven AJ. 2014. The number of CCR5 expressing CD4+ T lymphocytes is lower in HIV-infected long-term non-progressors with viral control compared to normal progressors: a cross-sectional study. BMC Infect Dis 14:683. doi: 10.1186/s12879-014-0683-0. [DOI] [PMC free article] [PubMed] [Google Scholar]
- 73.Anton PA, Elliott J, Poles MA, McGowan IM, Matud J, Hultin LE, Grovit-Ferbas K, Mackay CR, Chen ISY, Giorgi JV. 2000. Enhanced levels of functional HIV-1 co-receptors on human mucosal T cells demonstrated using intestinal biopsy tissue. AIDS 14:1761–1765. doi: 10.1097/00002030-200008180-00011. [DOI] [PubMed] [Google Scholar]
- 74.Olsson J, Poles M, Spetz AL, Elliott J, Hultin L, Giorgi J, Andersson J, Anton P. 2000. Human immunodeficiency virus type 1 infection is associated with significant mucosal inflammation characterized by increased expression of CCR5, CXCR4, and beta-chemokines. J Infect Dis 182:1625–1635. doi: 10.1086/317625. [DOI] [PubMed] [Google Scholar]
- 75.Evans VA, Lal L, Akkina R, Solomon A, Wright E, Lewin SR, Cameron PU. 2011. Thymic plasmacytoid dendritic cells are susceptible to productive HIV-1 infection and efficiently transfer R5 HIV-1 to thymocytes in vitro. Retrovirology 8:43. doi: 10.1186/1742-4690-8-43. [DOI] [PMC free article] [PubMed] [Google Scholar]
- 76.Cavrois M, Neidleman J, Kreisberg JF, Greene WC. 2007. In vitro derived dendritic cells trans-infect CD4 T cells primarily with surface-bound HIV-1 virions. PLoS Pathog 3:e4. doi: 10.1371/journal.ppat.0030004. [DOI] [PMC free article] [PubMed] [Google Scholar]
- 77.Geijtenbeek TB, Kwon DS, Torensma R, van Vliet SJ, van Duijnhoven GC, Middel J, Cornelissen IL, Nottet HS, KewalRamani VN, Littman DR, Figdor CG, van Kooyk Y. 2000. DC-SIGN, a dendritic cell-specific HIV-1-binding protein that enhances trans-infection of T cells. Cell 100:587–597. doi: 10.1016/S0092-8674(00)80694-7. [DOI] [PubMed] [Google Scholar]
- 78.Laguette N, Sobhian B, Casartelli N, Ringeard M, Chable-Bessia C, Segeral E, Yatim A, Emiliani S, Schwartz O, Benkirane M. 2011. SAMHD1 is the dendritic- and myeloid-cell-specific HIV-1 restriction factor counteracted by Vpx. Nature 474:654–657. doi: 10.1038/nature10117. [DOI] [PMC free article] [PubMed] [Google Scholar]
- 79.Shan L, Deng K, Shroff NS, Durand CM, Rabi SA, Yang HC, Zhang H, Margolick JB, Blankson JN, Siliciano RF. 2012. Stimulation of HIV-1-specific cytolytic T lymphocytes facilitates elimination of latent viral reservoir after virus reactivation. Immunity 36:491–501. doi: 10.1016/j.immuni.2012.01.014. [DOI] [PMC free article] [PubMed] [Google Scholar]