

Single cell Ig gene amplification and sequencing has been widely used for the molecular and functional assessment of human antibody repertoires and has led to the identification of recombinant monoclonal antibodies with therapeutic potential against diverse pathogens 1, 2, 3. Due to the high reagent and Sanger sequencing costs, these antibody‐cloning strategies are limited to the analysis of relatively small B‐cell numbers and do not allow in‐depth repertoire measurements to assess the clonality and clonal evolution of B‐cell responses. A major goal in the field has been the development of platforms that allow the high‐throughput analysis of antibody repertoires at low costs 4. Next‐generation sequencing (NGS) of Ig heavy and light chain genes facilitates the high‐throughput analysis of antibody repertoires. So far only one platform preserves natural Ig gene associations at single‐cell level through linkage of Ig heavy and light chain amplicons before sequencing 5. However, due to the short NGS read‐lengths full‐length Ig genes are not readily available for cloning and recombinant monoclonal antibody production. Here, we describe a platform for the high‐throughput analysis of human antibody repertoires at single cell level that is fully compatible with direct Ig gene cloning and expression.
We have previously developed a strategy that combines single‐cell RT‐PCR of murine Igh, Igk, and Igl transcripts with NGS 6. Use of a 2D bar‐coded primer matrix in the second amplification round of the nested PCR allows pooling of amplicons for NGS. To adapt this approach for the amplification and sequencing of full‐length human Ig genes, we modified existing protocols 7, 8, 9. A major goal was to reduce the number of primers (especially in the second PCR to keep the costs for barcoded primers at minimum) while enabling the unbiased amplification of all human Ig heavy and light chain gene transcripts at high efficiency.
We initially designed a set of nine primers (complete mix) for the amplification of all VH families. The set is a mixture of previously published and newly designed VH leader primers for use in the primary PCR (Supporting Information Table 1, 8, 9). In addition, we designed a single forward primer (RMX2‐A) for the secondary IGH‐V PCR. RMX2‐A anneals at the 5′ end of exon 2 encoding the N‐terminus of FWR1, a region that is strongly conserved even in IGH‐V genes with high loads of somatic hypermutations (Supporting Information Fig. 1). To determine whether the newly designed PCR strategy could efficiently amplify human Ig genes from single B cells, we initially compared our primers to the established primer sets. Single B‐cell sort was performed using PBMCs isolated from three healthy donors (HD1‐3) upon informed consent and approval by the local Ethical Committee. Similar amplification efficiency was observed for IGH transcripts from IgG+CD27+ memory B cells (Fig. 1A). The overall amplification efficiency varied among isotypes, but we observed no differences in the amplification efficiency between the new and published primer sets for IgM, IgA, and IgE PCRs or when all constant region primers were mixed (Fig. 1B).
Figure 1.
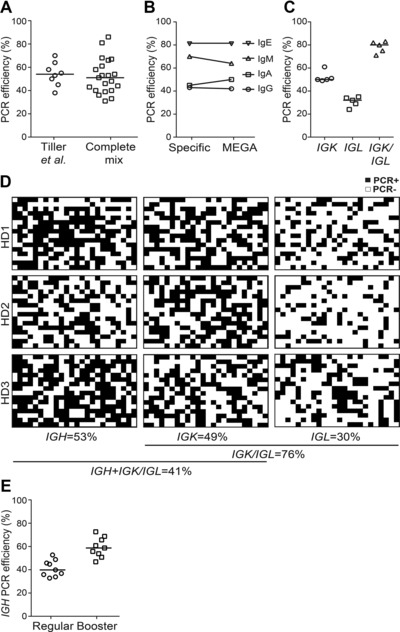
Establishment and validation of human matrix PCR conditions. (A) IGH PCR amplification efficiency for IgG+CD27+ memory B cells using published (Tiller et al., 10) or newly established primer sets (complete mix). Each symbol represents the overall PCR efficiency of an independent experiment run with 192 or 384 sorted single B cells. (B) IGH PCR amplification efficiency of isotype selected cells (primary IgG+, IgA+, or IgM+ memory (CD27+) B cells or an IgE expressing cell line (U266)) using individual constant region primers (Specific) or a mixture of all four isotype‐specific primers (MEGA). (C) IGK, IGL, or IGK/IGL PCR amplification efficiency for IgG+CD27+ memory B cells. (D) Spatial plate views depict the number of matrix IGH, IGK, and IGL PCR positive and negative wells for IgG+CD27+ memory B cells from three healthy donors (HD1‐3). Overall light chain amplification efficiency and matching heavy and light chain pairs are indicated. (E) Overall amplification efficiency for IgG+CD27+ memory B cells by a regular nested IGH PCR (regular) in comparison to two independent IGH PCRs (booster). Black bars indicate arithmetic median.
Next, we aimed to design Ig light chain gene amplification strategies that are compatible with the matrix PCR approach. Whereas the secondary PCR for IGK already uses a single forward primer, six forward primers are needed for the amplification of IGL genes 8. We therefore designed a new set of only two forward IGL primers that amplified IGL genes with the same efficiency as the established 6‐primer combination resulting in a combined IGK/IGL amplification efficiency of near 80% (Fig. 1C).
To evaluate whether our newly developed PCR strategy was compatible with the high‐throughput amplification of Ig gene transcripts, we generated uniquely barcoded IGH, IGK, and IGL forward and reverse primers for use in the secondary PCR. By using these primers in a 2D matrix format in which forward and reverse primers with different barcodes were used in each column and row, respectively, we generated amplicons with unique combinations of 5′ and 3′ tags to facilitate parallel sequencing while preserving single cell/well identity 6. To test the efficiency of the strategy, we amplified the Ig genes of 1152 single‐sorted IgG+ memory B cells from three healthy donors (Fig. 1D). Full‐length IGH sequences were obtained from 53% of cells, whereas the combined IGK or IGL amplification efficiency reached 76% (IGK 49%, IGL 30%). Thus, the relatively lower IGH PCR efficiency limited the number of cells with successful amplification of corresponding Ig heavy and Ig light chain transcripts (41%). The primary PCR efficiency is critical for the overall amplification success. To increase the amplification likelihood at single cell level, we tested if we could boost the efficiency by running two independent nested IGH PCRs. Indeed, two PCRs boosted the amplification efficiency from 40% to near 60% for all IGH isotypes (Fig. 1E and data not shown). Of note, this 10–20% increase in the overall IGH amplification success was also reached if we pooled the products of the two independent primary PCRs as template in only one secondary PCR (data not shown). Sequence analysis and comparison to previous studies confirmed that our strategy facilitates unbiased Ig gene repertoire studies (Supporting Information Fig. 2; 7, 8). Over 95% of the IGH‐V and paired IGK‐/IGL‐V genes present in our dataset were also detected with a different high‐throughput amplification and sequencing approach 8.
We conclude that our newly developed PCR strategy is fully compatible with the efficient high‐throughput amplification and parallel sequencing of corresponding Ig heavy and light chain genes from mutated and naïve single human B cells of all isotypes. It is critical to point out that our protocol does not include any cell stimulation step, which might increase the overall amplification efficiency but harbors the risk of inducing a repertoire bias. The relatively lower IGH amplification efficiency compared to Ig light chain genes is likely due to limited transcript levels. Indeed, IGH amplification efficiencies are about 50% higher for antibody secreting cells compared to memory B cells (data not shown).
Due to the use of random hexamers, amplification is not limited to Ig genes and enables the parallel assessment of non‐Ig transcripts. Sequencing costs are significantly reduced (up to tenfold) compared to strategies based on Sanger sequencing. The platform is ideally suited for the functional characterization of small subpopulations as it allows deep sampling to identify rare antibodies and is fully compatible with direct cloning of the full‐length Ig genes 9, 10. A major advantage is the possibility to perform reliable analyses of the clonality and clonal evolution of B‐cell responses based on error‐corrected full‐length Ig heavy and associated light chain gene sequences. Thus, applications range from basic repertoire analyses under steady state to the analysis of human B‐cell responses in infectious disease, autoimmunity, or cancer.
Conflict of interest
The authors declare no financial or commercial conflict of interest.
Abbreviation
- NGS
next‐generation sequencing
Supporting information
As a service to our authors and readers, this journal provides supporting information supplied by the authors. Such materials are peer reviewed and may be re‐organized for online delivery, but are not copy‐edited or typeset. Technical support issues arising from supporting information (other than missing files) should be addressed to the authors.
Figure 1: Conservation of N–‐terminal IGH–‐V region
Figure 2: Ig gene repertoire analysis
Table 1: Ig gene primers
peer review correspondence
Acknowledgments
The authors would like to thank the blood donors, the Sequencing core facility at the Max Planck Institute for Molecular Genetics, Berlin, for 454 sequencing; and the Flow Cytometry core facility at the Max Planck Institute for Infection Biology, Berlin for single cell sorting. Research reported in this publication was supported by the National Institute of Allergy and Infectious Diseases of the National Institutes of Health under Award Number UM1AI100663 to H.W. R.M. was supported by International Max Planck Research School for Infectious Diseases and Immunology (IMPRS‐IDI), Berlin and Research Training Group “Genetic and Immunological Determinants of Pathogen‐Host‐Interactions” (GRK1121) funded by the German Research Foundation (D.F.G.). K.I. was supported by IMPRS‐IDI, Berlin and Helmholtz International Graduate School for Cancer Research, German Cancer Research Center, Heidelberg.
References
- 1. Scheid, J. F. et al., Nature 2009. 458: 636–640. [DOI] [PubMed] [Google Scholar]
- 2. Wrammert, J. et al., Nature 2008. 453: 667–671. [DOI] [PMC free article] [PubMed] [Google Scholar]
- 3. Muellenbeck, M. F. et al., J. Exp. Med. 2013. 210: 389–399. [DOI] [PMC free article] [PubMed] [Google Scholar]
- 4. Georgiou, G. et al., Nat Biotechnol. 2014. 32: 158–168. [DOI] [PMC free article] [PubMed] [Google Scholar]
- 5. DeKosky, B. J. et al., Nat. Biotechnol. 2013. 31: 166–169. [DOI] [PMC free article] [PubMed] [Google Scholar]
- 6. Busse, C. E. et al., Eur. J. Immunol. 2014. 44: 597–603. [DOI] [PubMed] [Google Scholar]
- 7. Tiller, T. et al., Immunity 2007. 26: 205–213. [DOI] [PMC free article] [PubMed] [Google Scholar]
- 8. DeKosky, B. J. et al., Nat. Med. 2015. 21: 86–91 [DOI] [PubMed] [Google Scholar]
- 9. Wardemann, H. et al., Science 2003. 301: 1374–1377. [DOI] [PubMed] [Google Scholar]
- 10. Tiller, T. et al., J. Immunol. Methods 2008. 329: 112–124. [DOI] [PMC free article] [PubMed] [Google Scholar]
- 11. Scheid, J. F. et al., Science 2011. 333: 1633–1637. [DOI] [PMC free article] [PubMed] [Google Scholar]
Associated Data
This section collects any data citations, data availability statements, or supplementary materials included in this article.
Supplementary Materials
As a service to our authors and readers, this journal provides supporting information supplied by the authors. Such materials are peer reviewed and may be re‐organized for online delivery, but are not copy‐edited or typeset. Technical support issues arising from supporting information (other than missing files) should be addressed to the authors.
Figure 1: Conservation of N–‐terminal IGH–‐V region
Figure 2: Ig gene repertoire analysis
Table 1: Ig gene primers
peer review correspondence