

Abstract
Neurocognitive abilities constitute complex traits with considerable heritability. Impaired neurocognition is typically observed in schizophrenia (SZ), whereas convergent evidence has shown shared genetic determinants between neurocognition and SZ. Here, we report a genome‐wide association study (GWAS) on neuropsychological and oculomotor traits, linked to SZ, in a general population sample of healthy young males (n = 1079). Follow‐up genotyping was performed in an identically phenotyped internal sample (n = 738) and an independent cohort of young males with comparable neuropsychological measures (n = 825). Heritability estimates were determined based on genome‐wide single‐nucleotide polymorphisms (SNPs) and potential regulatory effects on gene expression were assessed in human brain. Correlations with general cognitive ability and SZ risk polygenic scores were tested utilizing meta‐analysis GWAS results by the Cognitive Genomics Consortium (COGENT) and the Psychiatric Genomics Consortium (PGC‐SZ). The GWAS results implicated biologically relevant genetic loci encoding protein targets involved in synaptic neurotransmission, although no robust individual replication was detected and thus additional validation is required. Secondary permutation‐based analysis revealed an excess of strongly associated loci among GWAS top‐ranked signals for verbal working memory (WM) and antisaccade intra‐subject reaction time variability (empirical P < 0.001), suggesting multiple true‐positive single‐SNP associations. Substantial heritability was observed for WM performance. Further, sustained attention/vigilance and WM were suggestively correlated with both COGENT and PGC‐SZ derived polygenic scores. Overall, these results imply that common genetic variation explains some of the variability in neurocognitive functioning among young adults, particularly WM, and provide supportive evidence that increased SZ genetic risk predicts neurocognitive fluctuations in the general population. © 2015 The Authors American Journal of Medical Genetics Part B: Neuropsychiatric Genetics Published by Wiley Periodicals, Inc.
Keywords: cognition, working memory, endophenotype, GWAS, psychosis
INTRODUCTION
It is well documented that neurocognition represents a complex heritable phenotypic construct with significant genetic influences across the entire human lifespan [Deary IJ et al., 2012; Plomin R and Deary IJ 2014]. High heritability has been observed in twin‐based studies for various neurocognitive traits, including episodic memory, working memory and general cognitive ability [Ando J et al., 2001; Haworth et al., 2010; Owens SF et al., 2011]. Similarly, molecular genetic studies have predicted increased heritability estimates for general cognitive ability in the general population by considering the additive effects of thousands common genetic markers in the human genome [Plomin R et al., 2013; Benyamin B et al., 2014]. Due to the close relationship between neurocognitive deficits and psychiatric illness, nationwide collaborative efforts have joined forces in order to investigate the potential contribution of common genetic variation to neurocognitive performance, which may also lead to the identification of specific genetic loci involved in psychiatric nosology [Donohoe G et al., 2013; Lencz T et al., 2014].
Individuals with schizophrenia (SZ) underperform in a wide range of neuropsychological and neurophysiological tasks compared to the general population, making neurocognitive impairment one of the core features of SZ psychopathology [Kahn RS and Keefe RS 2013]. Substantial evidence indicates that these deficits usually precede the onset of the full‐blown clinical presentation of the disease, implying that early cognitive deterioration might represent an important risk factor or prodromal condition of SZ [Kahn RS and Keefe RS 2013; Bora E and Murray RM 2013; Meier MH et al., 2014]. In addition, family studies have shown that the phenotypic relationship between SZ and neurocognition can be attributed to shared genetic effects, which points towards a significant overlap between the underlying genetic factors inducing both cognitive deficits and increased SZ susceptibility [Toulopoulou T et al., 2007, 2010]. This view is further supported by the neurocognitive lag observed among children and adolescents reporting psychotic experiences [Gur RC et al., 2014], which might reflect the common genetically determined neurodevelopmental origin of aberrant neurocognition and psychosis.
Our group and others have previously reported that common SZ risk genetic variants derived from large‐scale genome‐wide association studies (GWAS), as well as variants within SZ candidate genes are associated with neurocognitive weaknesses in clinical and non‐clinical populations [Burdick KE et al., 2006; Stefanis NC et al., 2007; Greenwood TA et al., 2011; Hatzimanolis A et al., 2012; Walters JT et al., 2013], suggesting that at least some of SZ risk variants might have a significant impact on human cognition. More recently, it has been shown that SZ risk genetic loci, when analyzed as an aggregate polygenic risk score, predict alterations in white matter brain volume, general cognitive ability and working memory related prefrontal brain activation [Terwisscha van Scheltinga AF et al., 2012; McIntosh AM et al., 2013; Kauppi K et al., 2014]. Several neuropsychological and neurophysiological traits have been proposed as putative endophenotypes (or intermediate phenotypes) for SZ, with potential value in genetic studies as an alternative approach to help identify SZ susceptibility loci [Braff DL et al., 2007; Thaker G, 2008; Greenwood TA et al., 2013, Tamminga CA et al., 2014; Ivleva et al., 2014]. The attractiveness of endophenotypes stems from the observation that these traits are heritable, segregate in SZ families and likely possess a less complex genetic architecture [Gottesman II and Gould TD 2003; Cannon TD and Keller MC 2006]. Over the past few years, genome‐wide association and linkage studies have identified genetic loci associated with SZ candidate neurocognitive endophenotypes [Almasy L et al., 2008; Greenwood TA et al., 2013; Papassotiropoulos A et al., 2013; Lencz T et al., 2014; Vaidyanathan U et al., 2014].
In the present study, we aimed to uncover through genome‐wide association analyses novel common genetic variants associated with candidate endophenotypes for SZ, in healthy young individuals drawn from the general population. Independent replication of the most compelling association results was attempted in two additional samples and plausible functional properties of the associated variants were tested on human brain gene expression. Furthermore, heritability estimates were acquired by assessing the cumulative additive effects of all genome‐wide markers. Finally, we generated polygenic risk profile scores based on the results of a general cognitive ability GWAS meta‐ analysis and the largest to date GWAS meta‐analysis for SZ from the Psychiatric Genomics Consortium (PGC‐ SZ) [Ripke S et al., 2014], and examined their contribution to the endophenotypes under investigation.
MATERIALS AND METHODS
Participants
A detailed description of the Athens Study of Psychosis Proneness and Incidence of Schizophrenia (ASPIS) has been reported previously [Smyrnis N et al., 2007, 2011; Stefanis NC et al., 2007]. Briefly, the ASPIS examined randomly selected young male conscripts aged 18 to 24 years from the Greek Air Force in their first two weeks of admission to the National Air Force Basic Training Center (Tripolis, Greece). All conscripts had received a standardized screening interview by a team of military doctors of different specialties in order to exclude serious medical conditions, including documented diagnosis of psychotic disorders and substance dependence, and individuals with such conditions were not admitted for military training. In all, 2029 eligible individuals provided a mouthwash sample for DNA extraction and completed a battery of computerized tasks measuring different aspects of neuropsychological and oculomotor performance. Written informed consent was obtained from every individual before participating to the study. The study protocol was approved by the University Mental Health Research Institute (Athens, Greece) and the Johns Hopkins University Institutional Review Boards.
Cognitive and Oculomotor Assessments
Detailed information on the phenotyping procedures of the ASPIS has been described in previous reports [Smyrnis N et al., 2007; Stefanis NC et al., 2007]. We measured sustained attention with the Continuous Performance Task‐Identical Pairs version (CPT‐IP) and short‐term verbal and spatial working memory (WM) with the Ν‐back task (2‐back version) [Smyrnis N et al., 2007]. Both accuracy (d' index) and speed of processing (mean reaction time) outcomes were included in the analyses. In accordance with our previous work, we a priori decided to exclude data from further analyses if d' index on CPT‐IP and N‐back was <0 and if there were ≥3 unsuccessful trials (of 5) for verbal and spatial 2‐back tasks. Oculomotor performance was tested using standardized tasks measuring antisaccade and smooth eye pursuit eye movements [Smyrnis N et al., 2011; Kattoulas E et al., 2012]. The following oculomotor variables were included in our analyses: antisaccade error rate, median reaction time of correct antisaccades, coefficient of variation of antisaccade reaction time and a principal component analysis (PCA) factor extracting the common variance of smooth eye pursuit gain measures (ratio of eye velocity to target velocity). Reasoning ability (non‐verbal IQ) was assessed with the Raven's progressive matrices [Raven J et al., 2004]. A description of the phenotypic outcomes examined in the current study is presented in Table I.
Table I.
Description of the Phenotypic Outcomes Analyzed in the Present Study
| Phenotype | Task | Abbreviation | Outcome |
|---|---|---|---|
| Reasoning ability (non‐verbal IQ) | Raven's progressive matrices | IQ | Box‐cox transformed total score of correct responses |
| Sustained Attention/Vigilance | Continuous Performance Task, Identical Pairs Version | CPT | Accuracy index (d'); both correct responses and false alarms are taken into account |
| CPT‐RT | Mean reaction time for correct responses | ||
| Verbal working memory | Verbal N‐back (2‐back) | VNB | Accuracy index (d'); both correct responses and false alarms are taken into account |
| VNB‐RT | Mean reaction time for correct responses | ||
| Spatial working memory | Spatial N‐back (2‐back) | SNB | Accuracy index (d'); both correct responses and false alarms are taken into account |
| SNB‐RT | Mean reaction time for correct responses | ||
| Oculomotor functioning | Antisaccade eye movements | AER | Antisaccade error rate |
| ART | Mean reaction time for correct antisaccades | ||
| ACV | ART intra‐subject coefficient of variation | ||
| Smooth pursuit eye movements (three constant target speeds: 10, 20, and 30 deg/sec) | SPEM | PCA factor extracting the common variance of all three gain measures (ratio of eye velocity to target velocity) |
Genotyping and Imputation
We selected for genome‐wide genotyping a subsample of 1,216 individuals with the most complete data across all tasks (discovery GWAS sample). Genotyping in the discovery ASPIS sample was conducted on Genome‐Wide Human SNP array 6.0 (Affymetrix, Santa Clara, CA) at the Institute of Genetic Medicine, Johns Hopkins University School of Medicine. Appropriate quality control (QC) testing and SNP QC filtering was applied in PLINK [Purcell SM et al., 2007], excluding single‐nucleotide polymorphisms (SNPs) with a call rate <97.5%, minor allele frequency <5% and Hardy‐Wienberg equilibrium P < 0.0001. Further, we used principal component analysis (PCA) as implemented in EIGENSTRAT [Price AL et al., 2006], to both identify genetic outliers (>6 standard deviations on any of the top ten principal components) and correct for any potential residual population substructure. Batch‐related genotyping errors were also ruled out before analyses. Genotype imputation was performed using IMPUTEv2 [Howie BN et al., 2009], with the 1,000 Genomes Project panel as a reference (Phase I, Integrated release, version 3). After rigorous QC and data cleaning processes, a total of 1,079 samples and 5,654,592 high quality autosomal SNPs were available for downstream genome‐wide analyses. Further details on genotyping and imputation procedures are provided in the Supplementary material. Follow‐up genotyping for top‐ associated SNPs selected for replication was performed using MassARRAY iPLEX Gold assays (Sequenom, San Diego, CA), following the manufacturer's instructions.
Replication Samples
The remainder ASPIS subsample (N = 738) served as an internal validation sample of GWAS results. The only difference between the discovery and replication subsamples is that the former was selected to have the fewest missing phenotypic data, which we found to correlate with superior performance in most tasks. Additional replication was attempted in the Learning on Genetics of Schizophrenia Spectrum (LOGOS) sample, an independent cohort of healthy young male army conscripts described in detail previously [Roussos P et al., 2011]. The LOGOS acquired the same recruitment procedures as the ASPIS, assessing healthy male conscripts (age range 18–29) at a Greek Army Training Camp (Heraklion, Crete) on several neurocognitive phenotypes that resemble the ones tested in the ASPIS. Available phenotypic scores on sustained attention (RVP; Rapid Visual Information Processing), spatial working memory (SWM) from the Cambridge Neuropsychological Test Automated Battery (CANTAB) and the N‐back task were analyzed. As equivalent to the ASPIS phenotypic assessments, we utilized RVP and N‐back data on the number of correct responses and reaction time. The total number of errors and a measure of strategy were assessed in the SWM test as outcomes. The LOGOS cohort was genotyped on the HumanOmniExpress array (Illumina, San Diego, CA) applying identical QC metrics.
GWAS Enrichment Analysis
We applied a permutation‐based analytical strategy to determine whether our strongest GWAS hits (P GWAS < 0.001) contain true‐positive association signals. Specifically, we randomly shuffled the IDs of the individuals included in the GWAS within the file containing the phenotypes and covariates, thus preserving the correlations between covariates and phenotypes and the correlations between genotypes, but randomizing the link between the two. If 100 permutations approached an empirical P = 0.05 more permutations, up to 3000, were run as needed to accurately determine lower P‐values. Genome‐ wide analysis was run on each permuted data set with identical parameters as the original run, and all LD‐ independent (r2 < 0.2) significant SNPs at P < 0.001 were extracted and counted. Empirical P‐value for signal enrichment was calculated as the fraction of permutations that produced equal or larger number of independent hits than the original data. The most likely number of true signals in each phenotype was calculated as the number of observed signals minus the average number observed across permutations. The number of true signals at 95% confidence was defined as the number of observed signals minus the maximum number observed in less than 5% of permutations.
Human Brain Gene Expression
Postmortem human brain samples were acquired from the Harvard Brain Tissue Resource Center and the National Institute of Child Health and Development (NICHD) Brain and Tissue Bank for Developmental Disorders. In total, we analyzed 162 samples dissected from the superior temporal lobe (Brodmann area 22) and 88 prefrontal cortex samples from healthy donors. Quantitative real‐time PCR (qPCR) reactions were performed in triplicate following standard procedures (details in Supplementary material).
Polygenic Score Analysis
Polygenic risk scores (PRS) based on the latest meta‐analysis GWAS results on general cognitive ability (Cognitive Genomics ConsorTium, COGENT) and SZ (Psychiatric Genomics Consortium, PGC‐SZ) [Lencz T et al., 2014; Ripke S et al., 2014] were generated following the procedure described by the International Schizophrenia Consortium [Purcell SM et al., 2009]. SNPs were filtered by applying seven P‐value thresholds (P T < 0.0001, P T < 0.001, P T < 0.01, P T < 0.05, P T < 0.1, P T < 0.3, P T < 0.5) to PGC‐SZ GWAS summary statistics (discovery sample). General cognitive ability PRSs were generated based on the single P‐value threshold (P T < 0.001) that was reported by COGENT. PRS calculation in the ASPIS GWAS subsample (target sample) was performed in PLINK using the “‐score” option, after appropriate linkage disequilibrium‐based SNP pruning (r2 < 0.2 within a 200 kb window), ensuring that only independent association signals are included. PLINK calculates a weighted risk score for each individual, based on the number of risk alleles that the individual carries at each SNP locus and the natural logarithm of the reported odds ratio for that particular SNP in the reference GWAS (COGENT or PGC‐SZ). The sum of single scores across all genotyped SNPs denotes the total PRS for each individual.
Statistical Analyses
To identify genetic outliers (>6 standard deviations on any of the top ten principal components) and correct for any potential residual population substructure, principal component analysis was applied as implemented in EIGENSTRAT [Price AL et al., 2006]. Association testing between phenotypic outcomes and imputed genotype allelic dosages was performed by linear regression under an additive genetic model using SNPTESTv2 [Marchini J and Howie B 2010], adjusting for age, years of education, and the first principal component. Genome‐wide Complex Trait Analysis (GCTA) software which implements a restricted maximum likelihood (REML) analysis was used to estimate the proportion of phenotypic variance explained by all genome‐wide SNPs (SNP‐heritability) [Yang J et al., 2011]. We tested for correlations between phenotypes and polygenic risk scores by linear regression in R (http://www.r-project.org/), utilizing the same covariates as above. In this analysis, given the well‐documented relationship between poor neurocognitive performance and SZ development by prior studies, one‐sided P < 0.05 was used to declare significant correlations. Statistical analyses of normalized log‐transformed qPCR gene expression measurements were also performed in R, by fitting generalized linear models with age, sex, post‐mortem interval, and acquisition site as covariates.
RESULTS
GWAS Results and Replication
Genome‐wide association analyses were performed in the discovery ASPIS sample (N = 1,079) for the eleven neurocognitive and oculomotor outcomes described in Table I. The corresponding quantile‐quantile plots for each outcome showed no inflation of test statistics, with genomic inflation factor values ≤1.01 (Figure S1). A single SNP was associated with sustained attention/vigilance task accuracy index (CPT), exceeding the conventional GWAS significance threshold (rs115501170 P =5.2 × 10⁻⁹, β = −0.43), with minor allele carriers exhibiting poorer performance. This SNP is located within the first intron of the CNTNAP5 (contactin associated protein‐like 5) gene, which belongs to the neurexin family of neuronal cell‐adhesion molecules. However, the above association failed to validate in the remainder ASPIS follow‐up sample (1‐sided P = 0.183, β = −0.06). For replication genotyping, we selected all SNPs with an association P <1 × 10⁻⁶ in the discovery GWAS sample, and those of the SNPs with a P <1 × 10⁻⁵ located within or near genes encoding proteins with a known function implicated in neuropsychiatric disorders by previous studies and thus could be considered as strong candidates. A total of 29 SNPs were tested in the ASPIS follow‐up sample (n = 738), which was ascertained in an identical manner with the discovery sample but genotyped separately. A complete list of the above and all other associated hits at P < 0.0001 with any outcome are presented in Supplementary Tables S1, S2. Two SNPs associated with verbal WM performance (VNB, VNB‐RT) nominally replicated (1‐sided P < 0.05), whereas two additional SNPs showed a trend association (1‐sided P < 0.1). We note that none of the above associations retained significance after correction for the number of SNPs examined. Because of the significantly better performance of the ASPIS discovery sub‐sample compared to the replication sub‐sample in the majority of tasks (Supplementary Table S3), likely attributable to our selection of individuals with most complete data in the discovery sub‐sample, we considered adjusting the analysis for the most significantly different, the Raven's matrices score. We did not observe major changes in the results, yet the P‐value for the SNP associated with SNB (rs16823702), reached uncorrected nominal significance (P = 0.049). Given the strong correlation of SNB with Raven's score however, this should be interpreted with caution. Furthermore, external replication was attempted in the LOGOS cohort (n = 825) for 13 SNPs (of the 29 SNPs) strongly associated with neuropsychological outcomes in the ASPIS. No evidence for a robust replication was observed in the LOGOS, besides a nominal association between verbal WM reaction time (VNB‐RT) and a marker located 134 kb upstream of LPP (LIM domain containing preferred translocation partner in lipoma) gene (rs66491174; 1‐ sided P = 0.02). The SNPs with a suggestive association in either of the two replication samples are shown in Table II.
Table II.
Follow‐Up Replication Analysis Results of Single‐SNP Associations
| Discovery GWAS sample | Replication samples | ||||||||||||
|---|---|---|---|---|---|---|---|---|---|---|---|---|---|
| Outcome | SNP ID | Risk Allele a | MAF | P GWAS | P ASPIS b | N | P LOGOS b | N | Nearest gene c | ||||
| VNB | rs79739201 | C | 0.16 | 6.7E‐07 | 0.041 | 538 | 0.069 d | 825 | intergenic | ||||
| VNB‐ RT | rs815425 | G | 0.4 | 7.2E‐06 | 0.043 | 522 | 0.361 | 747 | ERC2 | ||||
| VNB‐ RT | rs66491174 | C | 0.13 | 4.7E‐07 | 0.226 | 523 | 0.019 | 732 | LPP | ||||
| SNB | rs16823702 | G | 0.14 | 2.9E‐06 | 0.055 | 588 | na | no genotype | GRIK3 | ||||
| AER | rs10168813 | C | 0.17 | 6.3E‐06 | 0.080 | 741 | na | no phenotype | BIN1 | ||||
na, not available.
Denotes worse performance (i.e., lower accuracy, higher RT, higher antisaccade error rate).
One‐sided replication P‐values are shown.
Within range of LD (where any r2 > 0.2 in 1000 genomes project).
Opposite direction of SNP effect.
True Signals Among Highly Associated Genetic Loci
We next sought to investigate whether true positive association signals are present among the most strongly associated GWAS loci (P GWAS < 0.001), using permutations as described in the methods. Nine of the 11 sets of association signals corresponding to the 11 phenotypic outcomes showed more signals than the permutation average. For four of these nine sets the number of signals was reached in less than 5% of the permutations, providing 95% confidence that real associations are among them (Table III). The most striking were the signals observed for VNB and ACV providing 418 and 448 signals respectively, which was never observed in 3,000 permutated data sets (empirical P < 3.3 × 10⁻⁴). Ninety‐five percent of permutations resulted in less than 379 and 387 signals respectively, indicating with 95% confidence that there are at least 39 true signals for VNB (9.3% of signals) and 61 for ACV (13.6% of signals).
Table III.
Permutation‐Based Enrichment Analysis for GWAS Top‐Associated Genetic Loci
| GWAS dataset | Permuted datasets | ||||||||
|---|---|---|---|---|---|---|---|---|---|
| Outcome | Nobs | Nexc/Nperm | P emp | 50th PCTL | Nobs‐50th PCTL | 5th PCTL | Nobs‐5th PCTL | ||
| IQ | 391 | 11/1000 | 0.011 | 343 | 48 | 378 | 13 | ||
| CPT | 338 | 60/100 | ns | 342 | ‐ | 375 | ‐ | ||
| CPT‐RT | 349 | 36/100 | ns | 340 | 9 | 375 | ‐ | ||
| VNB | 418 | 0/3000 | <0.001 | 344 | 74 | 379 | 39 | ||
| VNB‐RT | 323 | 84/100 | ns | 347 | ‐ | 378 | ‐ | ||
| SNB | 370 | 7/100 | ns | 343 | 27 | 373 | ‐ | ||
| SNB‐RT | 354 | 33/100 | ns | 345 | 10 | 383 | ‐ | ||
| ERT | 357 | 25/100 | ns | 343 | 14 | 382 | ‐ | ||
| ART | 381 | 35/1000 | 0.035 | 345 | 36 | 378 | 3 | ||
| ACV | 448 | 0/3000 | <0.001 | 352 | 96 | 387 | 61 | ||
| SPEM | 335 | 67/100 | ns | 345 | ‐ | 382 | ‐ | ||
Nobs, number of observed loci at GWAS P < 0.001.
Nexc, number of permutation where the number of loci at P < 0.001 exceeded Nobs.
Nperm, number of permutations performed.
P emp, empirical P‐value. Significant enrichment at P <0.05 is shown in bold.
PCTL, percentile, for example 5th PCTL is the number of loci with P < 0.001 in 5% of permutations.ns, not significant (P emp > 0.05).
SNP‐Based Heritability
We estimated the heritability of the examined phenotypes based on genome‐wide SNP data (h 2 SNP) in unrelated individuals, using an analytic methodology that has been proven successful in prior studies of complex traits [Benyamin B et al., 2013; Lee SH et al., 2013; Robinson EB et al., 2014]. Even though precise h 2 SNP estimates could not be obtained, presumably because of the small sample size and the increased standard errors [Visscher PM et al., 2014], we found that a significant proportion of the phenotypic variance for both verbal and spatial WM accuracy (VNB, SNB) can be attributed to common genetic variation (P = 0.0003 and P = 0.0004 respectively), with at least 38% of variance explained by all genotyped SNPs. Lower h 2 SNP was observed for sustained attention/vigilance (P = 0.03).
Gene Expression Analysis
Three SNPs showing suggestive evidence of replication in the follow‐up ASPIS sample are located within brain‐expressed genes (ERC2, GRIK3, BIN1) and their protein products are involved in neuronal processes (details in Supplementary material). As GWAS hits are often expression quantitative trait loci (eQTLs) [Nicolae DL et al., 2010], we asked whether this is also true for the above variants. The correlation between genotype and the expression levels of the respective gene transcripts was examined in the temporal lobe (N = 162), the prefrontal cortex (N = 88), as well as in the combined sample (N = 250), adjusting for brain region. In all, no evidence for a significant eQTL was observed (all P > 0.1).
Association With General Cognitive Ability Polygenic Score
A single PRS was computed based on the reported top‐associated SNPs with general cognitive ability by COGENT (COGENT P T < 0.001). We observed a significant correlation (1‐sided P < 0.05) with verbal and spatial WM accuracy and verbal WM reaction time outcomes (VNB, SNB, VNB‐RT) (Fig. 1). A near significant result was noted for sustained attention/vigilance accuracy (CPT P = 0.051). Of the top‐ranked 1,455 COGENT SNPs with available genotypes in the ASPIS, none reached significance with any of our neurocognitive outcomes after a Bonferroni correction for multiple testing. Similarly, no significant enrichment of nominally associated SNPs was observed, compared to what is expected by chance (binomial test P > 0.1).
Figure 1.
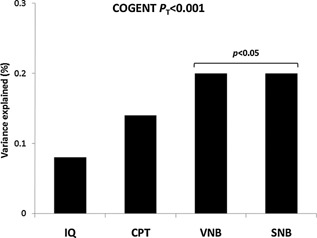
General cognitive ability polygenic score correlation with cognitive outcomes in the ASPIS. R2 (%) values are presented on the y‐axis as a measure of the phenotypic variance explained by the computed polygenic score, applying a COGENT GWAS P‐value threshold PT < 0.001. Increasing score predicted better performance in the ASPIS. IQ, Intelligence Quotient (non‐verbal IQ); CPT, Continuous Performance Test (accuracy); VNB, Verbal N‐back (accuracy); SNB, Spatial N‐back (accuracy); COGENT, Cognitive Genomics Consortium.
Polygenic Risk for SZ and Neurocognition
Given the reported shared genetic influences between SZ and neurocognition, we tested the hypothesis that an increased polygenic risk score (PRS) for SZ, which defines the aggregate effect of many risk alleles of small effect, would be correlated with poor neurocognitive performance. In Table S3, we show the correlations between the eleven phenotypic outcomes and SZ PRS generated at different PGC GWAS P‐value thresholds (P T). SZ PRS at P T < 0.5 was nominally associated (P < 0.05) with both sustained attention/vigilance (CPT) and spatial WM accuracy (SNB) performance (Fig. 2), suggesting a limited but significant genetic overlap with SZ risk loci. A significant correlation was also noted for antisaccade reaction time variability (ACV P = 0.002 at P T < 0.0001), however not in the expected direction (high SZ PRS associated with lower variability). Next, we individually tested for association all 128 genome‐wide significant SNPs reported by PGC–SZ. After multiple testing corrections, no SNP reached significance with any of the phenotypes, and no excess of single‐SNP associations was observed for any of the outcomes (binomial test P > 0.05). Nevertheless, nine SNPs were nominally associated with more than one phenotypic outcome in the ASPIS, with SZ risk allele predicting weaker performance (Table IV).
Figure 2.
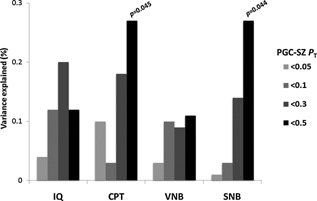
Correlation between SZ polygenic risk scores at different PGC GWAS P‐value thresholds (PT) with cognitive outcomes in the ASPIS. R2 (%) values are presented. Increasing risk score for SZ predicted worseperformance in the ASPIS. IQ, Intelligence Quotient (non‐verbal IQ); CPT, Continuous Performance Test(accuracy); VNB, Verbal N‐back (accuracy); SNB, Spatial N‐back (accuracy); PGC, Psychiatric Genomics Consortium.
Table IV.
PGC‐SZ Genome‐Wide Significant SNPs Nominally Associated With Multiple ASPIS Phenotypes
| ASPIS | Best ASPIS | PGC‐SZ | |||
|---|---|---|---|---|---|
| SNP ID | Location | Outcomes | P‐value | P‐value | Genes in region |
| rs12421382 | 11q22.3 | VNB, SNB | 7.8E‐04 (VNB) | 3.7E‐08 | C11orf87 |
| rs7523273 | 1q32.2 | CPT, ACV | 2.0E‐02 (CPT) | 4.5E‐08 | CD46, CR1L, CD34 |
| rs6704641 | 2q33.1 | SNB, SPEM | 7.5E‐03 (SPEM) | 8.3E‐09 | SATB2 |
| rs7819570 | 8q21.3 | SNB‐RT, VNB‐RT | 2.9E‐03 (SNB‐RT) | 1.2E‐08 | MMP16 |
| rs4129585 | 8q24.3 | CPT‐RT, SNB‐RT | 7.2E‐03 (CPT‐RT) | 1.7E‐15 | TSNARE1 |
| rs7893279 | 10p12.31 | CPT, VNB | 3.4E‐02 (CPT) | 2.0E‐12 | CACNB2 |
| rs77502336 | 11q24.1 | IQ, SPEM | 4.3E‐03 (IQ) | 7.5E‐09 | GRAMD1B |
| rs2068012 | 14q12 | VNB, SNB | 1.9E‐02 (VNB) | 1.4E‐08 | PRKD1, MIR548AI |
PGC, psychiatric genomics consortium.
Two‐sided P‐values are shown.
DISCUSSION
The aim of the current study was to evaluate the contribution of common genetic variation to individual neupsychological and oculomotor performance differences among young adults from the general population, and whether SZ risk loci could predict such differences. We studied traits that represent promising endophenotypes for SZ with presumed less complex biology and influenced by overlapping genetic variation [Braff DL et al., 2007; Glahn DC et al., 2014]. Since compelling evidence has shown that neurocognitive disruptions in SZ exist prior to the onset of clinical symptoms [Kahn RS and Keefe RS 2013; Bora E and Murray RM 2013], the discovery of genetic loci implicated in the modulation of cognitive abilities in young adulthood, may shed light into neuronal processes and the underlying molecular mechanisms that, when compromised, increase the risk to develop SZ. Due to the limited power of our discovery sample to detect SNP associations with high confidence, we intended to validate the most promising results in an internal follow‐up sample (ASPIS) and an independent sample with almost identical demographic and phenotypic characteristics (LOGOS). Overall, the observed associations replicated weakly and inconsistently; however, given the sample size limitations and the vicinity of genes that are strong functional candidates, these results warrant attention for future genetic and functional studies. The marker showing the strongest association with sustained attention/vigilance, which surpassed genome‐wide significance cut‐off, is of potential interest since it is located within a brain expressed gene (CNTNAP5) previously implicated in neuropsychiatric diseases with known disturbances in sustained attention, that is bipolar disorder, autism and attention‐deficit hyperactivity disorder [Djurovic S et al., 2010; Pagnamenta AT et al., 2010; Neale BM et al., 2010 ]. CNTNAP5 protein belongs to the neurexin superfamily of cell‐adhesion molecules, which have been shown to constitute key regulators of synapse formation and neurotransmission [Anderson GR et al., 2012; Karayannis T et al., 2014]. Suggestive evidence of association was observed for three additional loci, located within genes whose protein products are involved in glutamatergic signaling (GRIK3) and synaptic vesicle trafficking processes (ERC2, BIN1). Genetic variation within GRIK3 has been previously linked to SZ and developmental delay [Djurovic S et al., 2009; Takenouchi T et al., 2014].
Our analyses suggest that while single‐SNP effects are small, the aggregate effect of common SNPs (SNP‐heritability) can explain a substantial portion of the phenotypic variance for at least two phenotypes, verbal and spatial WM accuracy (N‐back task). Of note, this result represents a direct replication of the significant SNP‐heritability observed independently for N‐back performance in a cohort of healthy young adults [Vogler C et al., 2014]. Moreover, these findings are in agreement with reported heritability estimates of diverse cognitive abilities in children and adolescents using the same genetic approach [Benyamin B et al., 2013; Trzaskowski M et al., 2013; Roninson EB et al., 2014], supporting the contribution of multiple common variants to neurocognitive functioning. Twin and family studies in clinical and non‐clinical samples have also revealed a considerable heritability for WM [Greenwood TA et al., 2007; Wilson RS et al., 2011; Goldberg X et al., 2013], as well as a significant genetic relationship between general cognitive ability and aspects of executive function, including WM [Aukes MF et al., 2009; Lee T et al., [Link]]. In addition, neuroimaging findings in young twins of the same age range as the participants in the current study, who performed the same WM N‐back task, demonstrated an increased heritability for WM‐related brain activation [Blokland GA et al., 2011]. Jointly, the above observations underscore the strong influence of genetic components on WM, which has been shown to be a reliable endophenotype for SZ [Horan WP et al., 2008].
While the sample size of the ASPIS did not allow robust genetic associations for individual loci, our permutation analyses detected significantly more associated loci than the null expectation for 4 of the 11 outcomes tested, suggesting that within our strongest signals there are true‐positives and allowing an estimate of their minimum number at 95% confidence. Verbal WM and intra‐subject reaction time variability in the antisaccade task showed the most promising results, with an estimate of at least 39 and 61 true‐positives among the 418 and 448 top‐associated signals with P < 0.001 respectively, and with such numbers of signals not reached in 3,000 permutations. These results are encouraging for future genome‐wide and follow‐up studies as they suggest that there are some relatively strong genetic effects influencing these phenotypes and they will likely be among the first to reach genome‐wide significance with the inclusion of additional individuals. It is of interest that the intra‐subject antisaccade reaction time variability is an oculomotor measure that we have repeatedly found to show different distributions between SZ cases and controls, and therefore may prove a useful SZ endophenotype [Smyrnis N et al., 2009; Theleritis C et al., 2014].
On another front, our results provide independent validation of previously reported GWAS findings on human general cognitive ability. Although we could not replicate individual single‐SNP associations, likely due to small effect sizes of the respective variants, the cumulative effect of multiple SNPs, as indexed by the computed polygenic score, shows correlation with WM which is central to general cognitive ability and a key component of the composite phenotypic construct analyzed by COGENT [Lencz T et al., 2014]. Applying the same polygenic strategy, we explored the extent of the overlapping genetic determinants between neurocognitive performance and SZ risk, if any. To the best of our knowledge, this is the first general population study assessing the contribution of a SZ polygenic risk score derived from the largest to date SZ GWAS meta‐ analysis [Ripke S et al., 2014], on cognitive and oculomotor performance. We found weak evidence that SZ risk alleles predispose to aberrant sustained attention and spatial WM, at least in young adulthood. We acknowledge that this result could not be considered striking in terms of the obtained statistical evidence in our limited number of individuals; yet it is in agreement with the genetic overlap between neurocognition and SZ observed in twin and family studies [Toulopoulou T et al., 2007, 2010]. Similar findings have also been reported for general cognitive ability by COGENT which studied a much larger sample than the ASPIS, as well as for WM‐related prefrontal brain activation in a small cohort of SZ patients and healthy controls [Kauppi K et al., 2014]. We may, therefore, hypothesize that the overlapping variants could modify the function of genes that orchestrate neurodevelopmental processes implicated to both cognitive dysfunction and psychosis (Bora E and Murray RM 2013); however this hypothesis cannot be tested with the existing data. It should be stressed that our results are based on measurements in healthy individuals, thus we cannot rule out a more pronounced effect of PGC‐SZ polygenic risk on neurocognitive functioning in a clinical population.
Taken together, our GWAS results reveal associations within or near genes encoding proteins with well‐defined neuronal functions and potentially vital involvement in mechanisms shaping human neurocognition, although independent studies will be needed to adequately validate the reported findings. Furthermore, this study underscores the polygenic nature of WM and its genetic relationship with SZ, which even though is of minor magnitude, strengthens the notion that WM may represent a highly suitable phenotype for future collaborative efforts, aiming at the identification and characterization of genetic risk factors that enhance both symptoms of psychopathology and neurocognitive impairment.
Supporting information
Additional supporting information may be found in the online version of this article at the publisher's web‐site
Supporting Information Figure S1: Quantile‐quantile (QQ) plots of the GWAS results for the 12 phenotypic outcomes examined in the ASPIS discovery sample.
Supporting Information Table S1: Top GWAS SNPs selected for replication in the ASPIS follow‐up and the LOGOS samples.
Supporting Information Table S2: ASPIS GWAS hits with p<.0001 for each phenotypic outcome analyzed.
Supporting Information Table S3: Comparison of task performance between the ASPIS discovery and follow‐up sub‐samples.
Supporting Information Table S4:Correlation analyses between PGC‐SZ polygenic risk scores and ASPIS phenotypes.
ACKNOWLEDGMENTS
Human tissue was provided by the National Institute of Child Health and Development (NICHD) Brain and Tissue Bank for Developmental Disorders, contract number NO1‐HD‐4‐3368 and NO1‐HD‐4‐3383, and from the Harvard Brain Tissue resource center.
Hatzimanolis A, Bhatnagar P, Moes A, Wang R, Roussos P, Bitsios P, Stefanis CN, Pulver AE, Arking DE, Smyrnis N, Stefanis NC, Avramopoulos D. 2015. Common genetic variation and schizophrenia polygenic risk influence neurocognitive performance in young adulthood. Am J Med Genet Part B 168B:392–401.
Alex Hatzimanolis and Pallav Bhatnagar contributed equally to this study.
Senior authors Nicholas C. Stefanis and Dimitrios Avramopoulos contributed equally to this study.
Conflicts of interest: None.
REFERENCES
- Almasy L, Gur RC, Haack K, Cole SA, Calkins ME, Peralta JM, Hare E, Prasad K, Pogue‐Geile MF, Nimgaonkar V. et al. 2008. A genome screen for quantitative trait loci influencing schizophrenia and neurocognitive phenotypes. Am J Psychiatry 165:1185–1192. [DOI] [PMC free article] [PubMed] [Google Scholar]
- Anderson GR, Galfin T, Xu W, Aoto J, Malenka RC, Südhof TC. 2012. Candidate autism gene screen identifies critical role for cell‐adhesion molecule CASPR2 in dendritic arborization and spine development. Proc Natl Acad Sci 109:18120–18125. [DOI] [PMC free article] [PubMed] [Google Scholar]
- Ando J, Ono Y, Wright MJ. 2001. Genetic structure of spatial and verbal working memory. Behavr Genet 31:615–624. [DOI] [PubMed] [Google Scholar]
- Aukes MF, Alizadeh BZ, Sitskoorn MM, Kemner C, Ophoff RA, Kahn RS. 2009. Genetic overlap among intelligence and other candidate endophenotypes for schizophrenia. Biol Psychiatry 65:527–534. [DOI] [PubMed] [Google Scholar]
- Blokland GA, McMahon KL, Thompson PM, Martin NG, de Zubicaray GI, Wright MJ. 2011. Heritability of working memory brain activation. J Neuroscience 31:10882–10890. [DOI] [PMC free article] [PubMed] [Google Scholar]
- Bora E, Murray RM. 2013. Meta‐analysis of Cognitive Deficits in Ultra‐high Risk to Psychosis and First‐Episode Psychosis: Do the Cognitive Deficits Progress Over, or After, the Onset of Psychosis? Schizophr Bull 40:744–755. [DOI] [PMC free article] [PubMed] [Google Scholar]
- Braff DL, Freedman R, Schork NJ, Gottesman II. 2007. Deconstructing schizophrenia: An overview of the use of endophenotypes in order to understand a complex disorder. Schizophr Bull 33:21–32. [DOI] [PMC free article] [PubMed] [Google Scholar]
- Benyamin B, Pourcain B, Davis OS, Davies G, Hansell NK, Brion MJ, Kirkpatrick RM, Cents RA, Franić S, Miller MB, et al. 2014. Childhood intelligence is heritable, highly polygenic and associated with FNBP1L. Molecular Psychiatry 19:253–258. [DOI] [PMC free article] [PubMed] [Google Scholar]
- Cannon TD, Keller MC. 2006. Endophenotypes in the genetic analyses of mental disorders. Annu Rev Clin Psychol 2:267–290. [DOI] [PubMed] [Google Scholar]
- Cross‐Disorder Group of the Psychiatric Genomics Consortium, Lee SH, Ripke S, Neale BM, Faraone SV, Purcell SM. 2013. Genetic relationship between five psychiatric disorders estimated from genome‐wide SNPs. Nat Genet 45:984–994. [DOI] [PMC free article] [PubMed]
- Djurovic S, Kähler AK, Kulle B, Jönsson EG, Agartz I, Le Hellard S, Hall H, Jakobsen KD, Hansen T, Melle I. et al. 2009. A possible association between schizophrenia and GRIK3 polymorphisms in a multicenter sample of Scandinavian origin (SCOPE). Schizophr Res 107:242–248. [DOI] [PubMed] [Google Scholar]
- Djurovic S, Gustafsson O, Mattingsdal M, Athanasiu L, Bjella T, Tesli M, Agartz I, Lorentzen S, Melle I, Morken G. et al. 2010. A genome‐wide association study of bipolar disorder in Norwegian individuals, followed by replication in Icelandic sample. J Affect Disord 126:312–316. [DOI] [PubMed] [Google Scholar]
- Donohoe G, Deary IJ, Glahn DC, Malhotra AK, Burdick KE. 2013. Neurocognitive phenomics: Examining the genetic basis of cognitive abilities. Psychol Med 43:2027–2036. [DOI] [PubMed] [Google Scholar]
- Glahn DC, Knowles EE, McKay DR, Sprooten E, Raventós H, Blangero J, Gottesman II, Almasy L. 2014. Arguments for the sake of endophenotypes: Examining common misconceptions about the use of endophenotypes in psychiatric genetics. Am J Med Genet Part B Neuropsychiatr Genet 165B:122–130. [DOI] [PMC free article] [PubMed] [Google Scholar]
- Gottesman II, Gould TD. 2003. The endophenotype concept in psychiatry: Etymology and strategic intentions. Am J Psychiatry 160:636–645. [DOI] [PubMed] [Google Scholar]
- Goldberg X, Alemany S, Rosa A, Picchioni M, Nenadic I, Owens SF, Rijsdijk F, Rebollo I, Sauer H, Murray RM. et al. 2013. Substantial genetic link between IQ and working memory: Implications for molecular genetic studies on schizophrenia. the European twin study of schizophrenia (EUTwinsS). Am J Med Genet B Neuropsychiatr Genetics 162B:413–418. [DOI] [PubMed] [Google Scholar]
- Greenwood TA, Braff DL, Light GA, Cadenhead KS, Calkins ME, Dobie DJ, Freedman R, Green MF, Gur RE, Gur RC. et al. 2007. Initial heritability analyses of endophenotypic measures for schizophrenia: The consortium on the genetics of schizophrenia. Archives General Psychiatry 64:1242–1250. [DOI] [PMC free article] [PubMed] [Google Scholar]
- Greenwood TA, Lazzeroni LC, Murray SS, Cadenhead KS, Calkins ME, Dobie DJ, Green MF, Gur RE, Gur RC, Hardiman G. et al. 2011. Analysis of 94 candidate genes and 12 endophenotypes for schizophrenia from the Consortium on the Genetics of Schizophrenia. Am J Psychiatry 168:930–946. [DOI] [PMC free article] [PubMed] [Google Scholar]
- Greenwood TA, Swerdlow NR, Gur RE, Cadenhead KS, Calkins ME, Dobie DJ, Freedman R, Green MF, Gur RC, Lazzeroni LC. et al. 2013. Genome‐wide linkage analyses of 12 endophenotypes for schizophrenia from the Consortium on the Genetics of Schizophrenia. Am J Psychiatry 170:521–532. [DOI] [PMC free article] [PubMed] [Google Scholar]
- Gur RC, Calkins ME, Satterthwaite TD, Ruparel K, Bilker WB, Moore TM, Savitt AP, Hakonarson H, Gur RE. 2014. Neurocognitive Growth Charting in Psychosis Spectrum Youths. JAMA Psychiatry DOI: 10.1001/jamapsychiatry.2013.4190. [DOI] [PubMed] [Google Scholar]
- Gur RE, Nimgaonkar VL, Almasy L, Calkins ME, Ragland JD, Pogue‐Geile MF, Kanes S, Blangero J, Gur RC. 2007. Neurocognitive endophenotypes in a multiplex multigenerational family study of schizophrenia. Am J Psychiatry 164:813–819. [DOI] [PubMed] [Google Scholar]
- Hatzimanolis A, Smyrnis N, Avramopoulos D, Stefanis CN, Evdokimidis I, Stefanis NC. 2012. Bipolar disorder ANK3 risk variant effect on sustained attention is replicated in a large healthy population. Psychiatr Genet 22:210–213. [DOI] [PMC free article] [PubMed] [Google Scholar]
- Haworth CM, Wright MJ, Luciano M, Martin NG, de Geus EJ, van Beijsterveldt CE, Bartels M, Posthuma D, Boomsma DI, Davis OS. et al. 2010. The heritability of general cognitive ability increases linearly from childhood to young adulthood. Mol Psychiatry 15:1112–1120. [DOI] [PMC free article] [PubMed] [Google Scholar]
- Horan WP, Braff DL, Nuechterlein KH, Sugar CA, Cadenhead KS, Calkins ME, Dobie DJ, Freedman R, Greenwood TA, Gur RE. et al. 2008. Verbal working memory impairments in individuals with schizophrenia and their first‐ degree relatives: Findings from the Consortium on the Genetics of Schizophrenia. Schizophrenia Research 103:218–228. [DOI] [PMC free article] [PubMed] [Google Scholar]
- Howie BN, Donnelly P, Marchini J. 2009. A flexible and accurate genotype imputation method for the next generation of genome‐wide association studies. PLoS Genet 5(6):e1000529. [DOI] [PMC free article] [PubMed] [Google Scholar]
- International Schizophrenia Consortium, Purcell SM, Wray NR, Stone JL, Visscher PM, O'Donovan MC, Sullivan PF, Sklar P. 2009. Common polygenic variation contributes to risk of schizophrenia and bipolar disorder. Nature 460:748–752. [DOI] [PMC free article] [PubMed]
- Kahn RS, Keefe RS. 2013. Schizophrenia is a cognitive illness: Time for a change in focus. JAMA Psychiatry 70:1107–1112. [DOI] [PubMed] [Google Scholar]
- Karayannis T, Au E, Patel JC, Kruglikov I, Markx S, Delorme R, Héron D, Salomon D, Glessner J, Restituito S. et al. 2014. Cntnap4 differentially contributes to GABAergic and dopaminergic synaptic transmission. Nature 511:236–240. [DOI] [PMC free article] [PubMed] [Google Scholar]
- Kattoulas E, Stefanis NC, Avramopoulos D, Stefanis CN, Evdokimidis I, Smyrnis N. 2012. Schizophrenia‐related RGS4 gene variations specifically disrupt prefrontal control of saccadic eye movements. Psychol Med 42:757–767. [DOI] [PubMed] [Google Scholar]
- Kauppi K, Westlye LT, Tesli M, Bettella F, Brandt CL, Mattingsdal M, Ueland T, Espeseth T, Agartz I, Melle I. et al. 2014. Polygenic Risk for Schizophrenia Associated With Working Memory‐related Prefrontal Brain Activation in Patients With Schizophrenia and Healthy Controls. Schizophr Bull 41: 736–743. [DOI] [PMC free article] [PubMed] [Google Scholar]
- Lencz T, Knowles E, Davies G, Guha S, Liewald DC, Starr JM, Djurovic S, Melle I, Sundet K, Christoforou A. et al. 2014. Molecular genetic evidence for overlap between general cognitive ability and risk for schizophrenia: A report from the Cognitive Genomics consorTium (COGENT). Mol Psychiatry 19:168–174. [DOI] [PMC free article] [PubMed] [Google Scholar]
- Lee T, Mosing MA, Henry JD, Trollor JN, Ames D, Martin NG, Wright MJ, Sachdev PS. OATS Research Team. 2012. Genetic influences on four measures of executive functions and their covariation with general cognitive ability: The Older Australian Twins Study. Behav Genet 42:528–538. [DOI] [PubMed] [Google Scholar]
- Marchini J, Howie B. 2010. Genotype imputation for genome‐wide association studies. Nat Rev Genet 11:499–511. [DOI] [PubMed] [Google Scholar]
- McIntosh AM, Gow A, Luciano M, Davies G, Liewald DC, Harris SE, Corley J, Hall J, Starr JM, Porteous DJ. et al. 2013. Polygenic risk for schizophrenia is associated with cognitive change between childhood and old age. Biol Psychiatry 73:938–943. [DOI] [PubMed] [Google Scholar]
- Meier MH, Caspi A, Reichenberg A, Keefe RS, Fisher HL, Harrington H, Houts R, Poulton R, Moffitt TE. 2014. Neuropsychological decline in schizophrenia from the premorbid to the postonset period: Evidence from a population‐representative longitudinal study. Am J Psychiatry 171:91–101. [DOI] [PMC free article] [PubMed] [Google Scholar]
- Neale BM, Medland S, Ripke S, Anney RJ, Asherson P, Buitelaar J, Franke B, Gill M, Kent L, Holmans P. et al. 2010. Case‐control genome‐wide association study of attention‐deficit/hyperactivity disorder. J Am Acad Child Adolesc Psychiatry 49:06–20. [DOI] [PMC free article] [PubMed] [Google Scholar]
- Nicolae DL, Gamazon E, Zhang W, Duan S, Dolan ME, Cox NJ. 2010. Trait‐associated SNPs are more likely to be eQTLs: Annotation to enhance discovery from GWAS. PLoS Genet 6(4):e1000888. [DOI] [PMC free article] [PubMed] [Google Scholar]
- Owens SF, Picchioni MM, Rijsdijk FV, Stahl D, Vassos E, Rodger AK, Collier DA, Murray RM, Toulopoulou T. 2011. Genetic overlap between episodic memory deficits and schizophrenia: Results from the Maudsley Twin Study. Psychol Med 41:521–532. [DOI] [PubMed] [Google Scholar]
- Pagnamenta AT, Bacchelli E, de Jonge MV, Mirza G, Scerri TS, Minopoli F, Chiocchetti A, Ludwig KU, Hoffmann P, Paracchini S. et al. 2010. Characterization of a family with rare deletions in CNTNAP5 and DOCK4 suggests novel risk loci for autism and dyslexia. Biol Psychiatry 15:320–328. [DOI] [PMC free article] [PubMed] [Google Scholar]
- Papassotiropoulos A, Stefanova E, Vogler C, Gschwind L, Ackermann S, Spalek K, Rasch B, Heck A, Aerni A, Hanser E. et al. 2013. A genome‐wide survey and functional brain imaging study identify CTNNBL1 as a memory‐related gene. Mol Psychiatry 18:255–263. [DOI] [PMC free article] [PubMed] [Google Scholar]
- Price AL, Patterson NJ, Plenge RM, Weinblatt ME, Shadick NA, Reich D. 2006. Principal components analysis corrects for stratification in genome‐wide association studies. Nat Genet 38:904–909. [DOI] [PubMed] [Google Scholar]
- Purcell S, Neale B, Todd‐Brown K, Thomas L, Ferreira MA, Bender D, Maller J, Sklar P, de Bakker PI, Daly MJ. et al. 2010. PLINK: A tool set for whole‐genome association and population‐based linkage analyses. Am J Hum Genet 81:559–575. [DOI] [PMC free article] [PubMed] [Google Scholar]
- Raven J, Raven JC, Court JH. 2004. Manual for Raven's Progressive Matrices and Vocabulary Scales. San Antonio, TX: Harcourt Assessment. [Google Scholar]
- Robinson EB, Kirby A, Ruparel K, Yang J, McGrath L, Anttila V, Neale BM, Merikangas K, Lehner T, Sleiman PM. et al. 2014. The genetic architecture of pediatric cognitive abilities in the Philadelphia Neurodevelopmental Cohort. Mol Psychiatry DOI: 10.1038/mp.2014.65. [DOI] [PMC free article] [PubMed] [Google Scholar]
- Roussos P, Giakoumaki SG, Georgakopoulos A, Robakis NK, Bitsios P. 2011. The CACNA1C and ANK3 risk alleles impact on affective personality traits and startle reactivity but not on cognition or gating in healthy males. Bipolar Disord 13:250–259. [DOI] [PubMed] [Google Scholar]
- Schizophrenia Working Group of the Psychiatric Genomics Consortium Ripke S, Neale BM, Corvin A, Walters JT, Farh KH, Holmans PA, Lee P, Bulik‐ Sullivan B, Collier DA, Huang H. et al. 2014. Biological Insights from 108 Schizophrenia‐associated genetic loci. Nature 511:421–427. [DOI] [PMC free article] [PubMed] [Google Scholar]
- Smyrnis N, Kattoulas E, Evdokimidis I, Stefanis NC, Avramopoulos D, Pantes G, Theleritis C, Stefanis CN. 2004. Active eye fixation performance in 940 young men: Effects of IQ, schizotypy, anxiety and depression. Exp Brain Res 156:1–10. [DOI] [PubMed] [Google Scholar]
- Smyrnis N, Karantinos T, Malogiannis I, Theleritis C, Mantas A, Stefanis NC, Hatzimanolis J, Evdokimidis I, . 2009. Larger variability of saccadic reaction times in schizophrenia patients. Psychiatr Res 168:129–136. [DOI] [PubMed] [Google Scholar]
- Smyrnis N, Avramopoulos D, Evdokimidis I, Stefanis CN, Tsekou H, Stefanis NC. 2007. Effect of schizotypy on cognitive performance and its tuning by COMT val158 met genotype variations in a large population of young men. Biol Psychiatry 61:845–853. [DOI] [PubMed] [Google Scholar]
- Smyrnis N, Kattoulas E, Stefanis NC, Avramopoulos D, Stefanis CN, Evdokimidis I, . 2011. Schizophrenia‐related neuregulin‐1 single‐nucleotide polymorphisms lead to deficient smooth eye pursuit in a large sample of young men. Schizophr Bull 37:822–831. [DOI] [PMC free article] [PubMed] [Google Scholar]
- Stefanis NC, Trikalinos TA, Avramopoulos D, Smyrnis N, Evdokimidis I, Ntzani EE, Ioannidis JP, Stefanis CN. 2007. Impact of schizophrenia candidate genes on schizotypy and cognitive endophenotypes at the population level. Biol Psychiatry 62:784–792. [DOI] [PubMed] [Google Scholar]
- Takenouchi T, Hashida N, Torii C, Kosaki R, Takahashi T, Kosaki K. 2014. 1p34.3 deletion involving GRIK3: Further clinical implication of GRIK family glutamate receptors in the pathogenesis of developmental delay. Am J Med Genet B Neuropsychiatr Genet 164:456–460. [DOI] [PubMed] [Google Scholar]
- Tamminga CA, Pearlson G, Keshavan M, Sweeney J, Clementz B, Thaker G. 2014. Bipolar and schizophrenia network for intermediate phenotypes: outcomes across the psychosis continuum. Schizophr Bull 2:S131–S137. [DOI] [PMC free article] [PubMed] [Google Scholar]
- Terwisscha van Scheltinga AF, Bakker SC, van Haren NE, Derks EM, Buizer‐ Voskamp JE, Boos HB, Cahn W, Hulshoff Pol HE, Ripke S, Ophoff RA, Kahn RS. et al. 2013. Genetic schizophrenia risk variants jointly modulate total brain and white matter volume. Biol Psychiatry 73:525–531. [DOI] [PMC free article] [PubMed] [Google Scholar]
- Theleritis C, Evdokimidis I, Smyrnis N. 2014. Variability in the decision process leading to saccades: A specific marker for schizophrenia? Psychophysiology 51:327–336. [DOI] [PubMed] [Google Scholar]
- Toulopoulou T, Picchioni M, Rijsdijk F, Hua‐Hall M, Ettinger U, Sham P, Murray R. 2007. Substantial genetic overlap between neurocognition and schizophrenia: Genetic modeling in twin samples. Arch Gen Psychiatry 64:1348–1355. [DOI] [PubMed] [Google Scholar]
- Toulopoulou T, Goldberg TE, Mesa IR, Picchioni M, Rijsdijk F, Stahl D, Cherny SS, Sham P, Faraone SV, Tsuang M. et al. 2010. Impaired intellect and memory: A missing link between genetic risk and schizophrenia? Arch Gen Psychiatry 67:905–913. [DOI] [PubMed] [Google Scholar]
- Trzaskowski M, Yang J, Visscher PM, Plomin R. 2014. DNA evidence for strong genetic stability and increasing heritability of intelligence from age 7 to 12. Mol Psychiatry 19:380–384. [DOI] [PMC free article] [PubMed] [Google Scholar]
- Vaidyanathan U, Malone SM, Donnelly JM, Hammer MA, Miller MB, McGue M, Iacono WG. 2014. Heritability and molecular genetic basis of antisaccade eye tracking error rate: A genome‐wide association study. Psychophysiology 51:1272–1284. [DOI] [PMC free article] [PubMed] [Google Scholar]
- Visscher PM, Hemani G, Vinkhuyzen AA, Chen GB, Lee SH, Wray NR, Goddard ME, Yang J. 2014. Statistical power to detect genetic (co) variance of complex traits using SNP data in unrelated samples. PLoS Genet 10(4):e1004269. [DOI] [PMC free article] [PubMed] [Google Scholar]
- Vogler C, Gschwind L, Coynel D, Freytag V, Milnik A, Egli T, Heck A, de Quervain DJ, Papassotiropoulos A. 2014. Substantial SNP‐based heritability estimates for working memory performance. Transl Psychiatry 4:e438 DOI: 10.1038/tp.2014.81. [DOI] [PMC free article] [PubMed] [Google Scholar]
- Walters JT, Rujescu D, Franke B, Giegling I, Vásquez AA, Hargreaves A, Russo G, Morris DW, Hoogman M, Da Costa A, et al. 2013. The role of the major histocompatibility complex region in cognition and brain structure: A schizophrenia GWAS follow‐ up. Am J Psychiatry 170:877–885. [DOI] [PubMed] [Google Scholar]
- Yang J, Lee SH, Goddard ME, Visscher PM. 2011. GCTA: A tool for genome‐wide complex trait analysis. Am J Hum Genet 88:76–82. [DOI] [PMC free article] [PubMed] [Google Scholar]
Associated Data
This section collects any data citations, data availability statements, or supplementary materials included in this article.
Supplementary Materials
Additional supporting information may be found in the online version of this article at the publisher's web‐site
Supporting Information Figure S1: Quantile‐quantile (QQ) plots of the GWAS results for the 12 phenotypic outcomes examined in the ASPIS discovery sample.
Supporting Information Table S1: Top GWAS SNPs selected for replication in the ASPIS follow‐up and the LOGOS samples.
Supporting Information Table S2: ASPIS GWAS hits with p<.0001 for each phenotypic outcome analyzed.
Supporting Information Table S3: Comparison of task performance between the ASPIS discovery and follow‐up sub‐samples.
Supporting Information Table S4:Correlation analyses between PGC‐SZ polygenic risk scores and ASPIS phenotypes.