

Summary
Chemotaxis enables bacteria to navigate chemical gradients in their environment, accumulating toward high concentrations of attractants and avoiding high concentrations of repellents. Although finding nutrients is likely to be an important function of bacterial chemotaxis, not all characterized attractants are nutrients. Moreover, even for potential nutrients, the exact relation between the metabolic value of chemicals and their efficiency as chemoattractants has not been systematically explored. Here we compare the chemotactic response of amino acids with their use by bacteria for two well‐established models of chemotactic behavior, E scherichia coli and B acillus subtilis. We demonstrate that in E . coli chemotaxis toward amino acids indeed strongly correlates with their utilization. However, no such correlation is observed for B . subtilis, suggesting that in this case, the amino acids are not followed because of their nutritional value but rather as environmental cues.
Introduction
In order to grow and reproduce, heterotrophic bacteria must acquire nutrients from their environment. When nutrients are limited, chemotaxis would be advantageous, because it allows for motile bacteria to find nutritional sources by actively following gradients. Chemotaxis in bacteria has been extensively studied (Szurmant and Ordal, 2004; Wadhams and Armitage, 2004; Porter et al., 2011; Hazelbauer, 2012). Typically, environmental stimuli are perceived through sensory complexes consisting of transmembrane chemoreceptors, an adaptor protein CheW and a kinase CheA (Sourjik, 2004; Hazelbauer et al., 2008). In the cell, these complexes are organized into large clusters that are essential for amplification and integration of chemotactic signals. Binding of effectors to the receptor modulates the rate of CheA autophosphorylation. The phosphate group is then transferred to the response regulator CheY. Phosphorylated CheY (CheY‐P) interacts with the flagellar motor changing either the rotational direction or speed of flagella rotation and causes reorientation (tumbling) of the cell. These proteins are the core of the chemotaxis pathway and are conserved among bacteria, with some variability (Szurmant and Ordal, 2004; Porter et al., 2011). For example, binding of attractant to the receptor inhibits CheA activity in Escherichia coli but activates it in Bacillus subtilis, whereas interaction of CheY‐P with the motor induces clockwise rotation in E. coli and counterclockwise rotation in B. subtilis (Fig. S1). Furthermore, whereas in E. coli the phosphoryl group from CheY‐P is removed by a phosphatase CheZ that localizes at the sensory complexes (Wang and Matsumura, 1996; Sourjik and Berg, 2000; Cantwell et al., 2003), in B. subtilis this function is performed by the motor‐associated protein FliY (Szurmant et al., 2004).
Amino acids are one of the most valuable nutrient sources for bacteria and can be utilized as sole nitrogen, carbon or energy sources (Halvorson, 1972). Previous studies have shown that most bacteria, including E. coli and B. subtilis, exhibit chemotaxis toward multiple amino acids (Mesibov and Adler, 1972; Van Der Drift and De Jong, 1974; Ordal and Gibson, 1977; Gotz et al., 1982; Hedblom and Adler, 1983; Hugdahl et al., 1988; Taguchi et al., 1997), albeit with different preferences. In E. coli, amino acid attractants are sensed by the two major receptors Tar and Tsr, which have the highest affinity for aspartate and serine respectively. These two amino acids are also rapidly consumed by E. coli in complex medium (Pruss et al., 1994; Chang et al., 1999; Selvarasu et al., 2009) and serve as precursors of other important intermediate metabolites (Reitzer, 2003; Keseler et al., 2013). This indicates that the chemotactic and nutritional preferences of E. coli are related, despite the fact that the chemotactic signaling toward amino acids is decoupled from their uptake and metabolism (Mesibov and Adler, 1972; Kahane et al., 1976).
Here we used pathway activity reporters based on fluorescence resonance energy transfer (FRET) to systematically quantify the chemotactic response of two model organisms, E. coli and B. subtilis, toward all 20 proteinogenic L‐amino acids. We further investigated the utilization of amino acids during growth in chemically defined medium. Our results demonstrate that most of the amino acids that attract E. coli are also preferentially utilized during growth, with a strong correlation between the order of utilization and the chemoattractant potency. However, such correlation was not observed in B. subtilis, suggesting that it is not universal but may be rather related to the environment or physiology of an organism.
Results
Chemotactic response of E . coli to amino acids
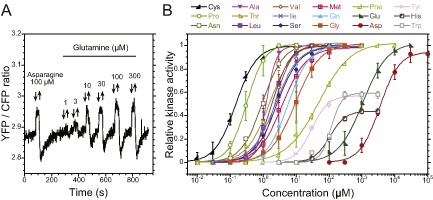
To measure the intracellular response of the chemotaxis pathway in E. coli, we used a previously described FRET reporter that relies on phosphorylation‐dependent interaction between CheY fused to yellow fluorescent protein (CheY‐YFP) and CheZ fused to cyan fluorescent protein (CheZ‐CFP) (Sourjik and Berg, 2002; Sourjik et al., 2007) (Fig. S1A). Cells expressing this FRET pair were stimulated with serial dilutions of all 20 L‐amino acids to measure the dose responses and to determine the EC50 – ligand concentration eliciting the half‐maximum FRET response (Fig. 1A, Table S1). Mostly consistent with previous observations (Mesibov and Adler, 1972; Hedblom and Adler, 1983), wild‐type E. coli cells showed response to seven amino acids in the sub‐millimolar range (Fig. 1B, Table S1). Aspartate, serine and cysteine were the strongest attractants, with EC50 values below 10 μM. Asparagine, alanine and glutamate showed EC50 values of ∼ 10–100 μM, whereas the EC50 for glycine was above 100 μM. In addition, weak attractant responses were also observed at millimolar concentrations of threonine and methionine (Table S1).
Figure 1.

FRET‐based analysis of chemotactic responses of E . coli to amino acids.
A. Exemplary measurement of FRET response to alanine in the wild‐type cells, using the phosphorylation‐dependent interaction between CheZ‐CFP and CheY‐YFP. Buffer‐adapted cells were stimulated with step‐like addition and subsequent removal of indicated concentrations of amino acid (indicated by arrows). The response to a saturating stimulus, 100 μM α‐methyl‐DL‐aspartate (MeAsp), was used as a positive control. Ratio of YFP to CFP fluorescence is proportional to the amount of FRET complex formed and thus to the kinase activity.
B. Dose responses of wild‐type cells to amino acid attractants. Relative kinase activity, derived from the YFP/CFP ratio, was plotted relative to the steady‐state activity in the buffer. Zero activity was obtained by a saturating stimulation with 100 μM MeAsp. Data were fitted using a Hill equation. Error bars here and throughout indicate standard errors.
C and D. Correlation between the values of EC 50 in the wild type and in receptorless cells expressing Tar (C) or Tsr (D) as a sole receptor. Amino acid ligands sensed by Tar fall into two groups indicated by dotted lines, suggesting that Tar is primary sensor for group 1 and secondary sensor for group 2 amino acids.
To further identify the roles of Tar and Tsr in the overall specificity of the amino acid response of E. coli, FRET measurements were also performed in strains expressing Tar or Tsr as the sole receptor. We observed that in the sub‐millimolar range Tar mediates attractant responses to aspartate, asparagine, glutamate, serine, cysteine, alanine, methionine and glycine (Fig. S2A), whereas Tsr mediates attractant responses to serine, cysteine, glycine, alanine and asparagine (Fig. S2B). Interestingly, all of the Tsr‐specific amino acids are also sensed by Tar, suggesting redundancy in the specificities of these two major receptors. This redundancy was not due to the impurities of the amino acid solutions, as suggested previously (Hedblom and Adler, 1983), as identical responses were observed to synthetic amino acids.
To determine relative contribution of Tar and Tsr in the detection of particular amino acids in the wild type, we performed a correlation analysis between the EC50 values of the wild type and Tar‐ or Tsr‐only cells. Such analysis for Tar clearly revealed two groups of amino acid attractants, one containing aspartate, asparagine and glutamate, and the other containing serine, cysteine, alanine and glycine (Fig. 1C). Although in both cases the EC50 values of Tar‐only cells show a good correlation with the values of the wild type (Fig. S3A), the Tar values are lower for the first group and higher for the second group of amino acids. Since lower EC50 means higher sensitivity, these results suggest that the first group is exclusively (or primarily) detected by Tar. The observed higher sensitivity of Tar‐only cells to these amino acids in comparison with the wild type is also consistent with previous studies for the Tar‐specific attractant α‐methyl‐DL‐aspartate (Sourjik and Berg, 2004) and can be explained by cooperative activation/inactivation of multiple receptors that are coupled in signaling teams (Mello and Tu, 2003; Sourjik and Berg, 2004; Keymer et al., 2006). This cooperativity results in signal amplification, which is stronger for the homogeneous teams that consist of only one type of receptor (Neumann et al., 2010).
The second group of amino acids is apparently detected primarily by Tsr, because Tsr‐only cells sense all amino acids in group two with higher sensitivity than Tar‐only cells, and clear correlation is observed between the Tsr and the wild‐type specificity (Fig. 1D and Fig. S3B). Again, the sensitivity of the Tsr‐only strain in detecting this second group of amino acids is higher than that of the wild type. Interestingly, although Tar is only a secondary receptor for serine, cysteine, alanine and glycine, it detects all of them and in the same order of sensitivity as Tsr. In contrast, Tsr detects only asparagine as a secondary ligand.
Tar‐mediated response to serine
Although Tar responded to all of the amino acids that are sensed by Tsr, the response to serine was markedly different. Although the pathway activity in Tar‐only cells was fully inhibited in presence of saturating concentrations of all other amino acid ligands, the response to serine saturated at ∼ 20% of the initial activity (Fig. S2A). Moreover, Tar‐only cells adapted rapidly to the initial serine stimulation, even at highest concentrations tested (Fig. S4). These differences suggested that the mechanism of serine sensing by Tar might be different from the conventional response mediated by ligand binding to the periplasmic sensory domain, as already proposed in a previous study (Neumann et al., 2010).
To determine whether serine response is mediated by the periplasmic domain of Tar, we used a ‘pinhead’ Tar construct that lacks the entire periplasmic domain but is nevertheless able to activate the kinase (Gosink et al., 2006) (Fig. S4A). Pinhead‐Tar mediated response to serine with similar sensitivity and strength as the wild‐type Tar (Fig. S4B). In contrast, responses of pinhead‐Tar to other amino acid attractants were either severely weakened as compared with the full‐length Tar or were entirely abolished (Fig. S4C–H). This result confirms that – in addition to the conventional sensing via the periplasmic domain of Tsr – serine is also detected by Tar through a mechanism that involves only the cytoplasmic domain.
Correlation between amino acid utilization and chemotaxis in E . coli
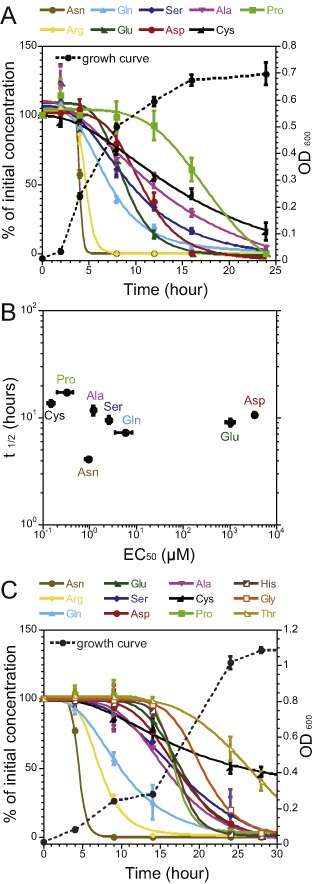
Wild‐type E. coli is able to utilize several amino acids as carbon and nitrogen sources (McFall and Newman, 1996; Reitzer, 1996). Serine and aspartate, for which cells have the highest requirement (Reitzer, 2003), are the first amino acids consumed by E. coli in the complex medium (Pruss et al., 1994; Selvarasu et al., 2009). Because serine and aspartate are also the best amino acid attractants for E. coli, we investigated whether there might be a general correlation between chemotaxis and catabolism of amino acids. To address this question, we first tested utilization of amino acids in E. coli MG1655 culture grown in the minimal medium with an equal‐molar (1 mM) mixture of all 20 amino acids and without other carbon or nitrogen sources. Changes in the levels of all amino acids in the medium could be monitored over time using liquid chromatography, except for tryptophan, which was not detected in our measurements. Our results showed that MG1655 cells are able to utilize at least seven amino acids during the time course of culture growth (Fig. 2A). In the early exponential phase, cells preferentially consume serine, cysteine and aspartate. Glutamine, glycine and glutamate were consumed during the late exponential phase, and alanine was consumed only after cells entered the stationary phase. A minor consumption of threonine and proline has also been observed, whereas the amounts of other amino acids either remained relatively constant or even increased, such as lysine (Fig. S5A). No amino acid degradation was detected in the absence of bacteria (Fig. S5B).
Figure 2.

Consumption of amino acids by E . coli.
A. Profile of amino acid uptake by E . coli MG1655 in minimal medium containing equimolar mixture of amino acids as the sole source of carbon and nitrogen. Profiles of amino acids with less than 50% utilization are shown in Fig. S5A.
B. Correlation between t1/2 of amino acid uptake, derived from (A), and the EC 50 of chemotactic response as determined in Fig. 1B.
C. Profiles of amino acid uptake by E . coli NCM3722 under the same growth conditions as in (A). Profiles of amino acids with less than 50% utilization are shown in Fig. S9A.
D. Profiles of amino acid uptake by E . coli NCM3722 in minimum medium under anaerobic conditions. Profiles of amino acids with less than 50% utilization are shown in Fig. S9B.
Comparison of these data with the set of amino acid attractants (Fig. 1B) showed nearly perfect overlap between the sets of chemoattractive and catabolized amino acids (summarized in Table S1). Among seven amino acids that are strong attractants (EC50 < 1 mM), only asparagine was not utilized from the mixture of amino acids under aerobic conditions (but see below). Vice versa, among seven efficiently utilized amino acids only glutamine is not an attractant for E. coli. The correlation between the utilization and chemotaxis becomes even more pronounced when comparing the time point at which 50% of the respective amino acid is consumed, t1/2, with the EC50 of the chemotactic response (Fig. 2B). These results suggest that stronger amino acid attractants are also consumed earlier during cell growth, indicating that chemotaxis to amino acids in E. coli has evolved to follow environmental gradients of catabolizable free amino acids.
To verify the generality of our conclusions, we further investigated how the consumption of amino acids by MG1655 is affected by the presence of other carbon (glucose or glycerol) or nitrogen (ammonia) sources (Fig. S6). Although the set of utilized amino acids was smaller in this case compared with the measurements performed with the mixture of amino acids as sole carbon and nitrogen source, three out of four amino acids that were consumed (serine, aspartate and glycine) are attractants and only one (glutamine) is not (cysteine was not measured in these experiments). We have further tested the capability of MG1655 to utilize individual amino acids as sole sources of carbon and/or nitrogen (Fig. S7A). Although none of individual amino acids could support efficient growth as sole carbon source, several amino acids could serve as nitrogen source. As expected, these are largely the same amino acids (serine, aspartate, cysteine, alanine, glutamine and glycine) that were utilized during growth on a mixture of amino acids and are (except glutamine) chemoattractants. Notably, asparagine (a potent attractant) could also efficiently support growth as a sole nitrogen source. In addition, several amino acids that are neither attractants nor utilized during growth on a mixture of amino acids (tryptophan, arginine and proline) could nevertheless serve as nitrogen sources. However, except glutamate (see below), none of the amino acids that could not serve as nitrogen sources were efficient attractants.
We further extended our analysis to E. coli strain NCM3722, a physiologically more robust parental strain of E. coli K‐12 (Soupene et al., 2003). As expected, NCM3722 showed chemotactic response to the same set of amino acids as MG1655, and also very similar EC50 values (Fig. S8), except for a more sensitive response to asparagine. The profile of amino acid utilization by NCM3722 (Fig. 2C and Fig. S9A) was also similar to that of MG1655, with only some differences in the order of consumption and more efficient utilization of proline and threonine. Consistently, NCM3722 could utilize largely the same amino acids as a sole nitrogen source as MG1655 (Fig. S7B), with addition of glutamate (another attractant), methionine (also a weak attractant) and lysine (not an attractant).
Finally, we also tested the utilization of amino acids by E. coli NCM3722 under anaerobic condition, which might better reflect the environment of the gut. Under these conditions, only six amino acids were utilized (Fig. 2D and Fig. S9B), and the ones most rapidly consumed were the highest affinity attractants serine, aspartate and cysteine, and also asparagine – an attractant that was not utilized aerobically. Taken together, these results confirm that the correlation between chemotaxis and utilization of amino acids in E. coli is a general phenomenon, largely independent on the strain or growth conditions.
Repellent response and inhibition of growth
In addition to attractant responses, clear repellent responses were observed when wild‐type cells were stimulated with isoleucine, leucine, tryptophan or valine. The values of EC50 for these responses were in the range of ∼ 0.1–3 mM (Fig. 3A). Repellent responses to these amino acids were also observed in Tsr‐only but not in Tar‐only cells, with similar response strength as in the wild type, suggesting that they are Tsr‐specific (Fig. S10). By using hybrid receptors that combine sensory domain of Tsr with the signaling domain of Tar or vice versa, we confirmed that repellent sensing is mediated by the sensory domain of Tsr (Fig. S11). Aspartate, glutamate, phenylalanine, histidine and glutamine also elicited weak repellent responses in Tsr‐only cells, but no obvious repellent response was observed up to 1 mM of these amino acids in the wild type.
Figure 3.

Repellent responses and growth inhibition by amino acids in E. coli.
A. Dose responses to amino acid repellents. Measurements were done and plotted as in Fig. 1A and B. The response was normalized to the prestimulus pathway activity as in Fig. 1B.
B. Growth inhibition by amino acids. Cells were grown in the M9 minimal glucose medium containing individual L‐amino acids at the final concentration of 1 mM. Culture density was determined after 8 h, and relative growth was quantified by normalizing OD 600 values to the control culture with no addition of amino acids. Red line indicates the relative growth of control culture.
Because some of these amino acids are known to inhibit bacterial growth (Quay et al., 1977; De Felice et al., 1979), we investigated whether the observed repulsion might be related to this inhibitory effect. Indeed, significant growth inhibition was observed when 1 mM of serine, cysteine, leucine or valine was added to the culture (Fig. 3B). Thus, at least for leucine and valine, repellent response might have evolved to avoid toxic level of these non‐catabolized amino acids. In contrast, although cysteine and serine can inhibit cell growth, they are rapidly catabolized by E. coli and hence rather serve as attractants. Nevertheless, E. coli has been shown to avoid chemotactic accumulation to high concentrations of these amino acids through a different mechanism (Neumann et al., 2014) (see Discussion ).
Amino acid chemotaxis and utilization in B . subtilis
To further test the generality of the observed correlation between chemoattraction and catabolism of amino acids, we used another model system for bacterial chemotaxis, a Gram positive and soil‐dwelling B. subtilis. Despite the large evolutionary distance between B. subtilis and E. coli, the core of the chemotaxis pathway in both organisms is well conserved (Fig. S1). Because B. subtilis lacks a homologue of CheZ and instead uses a cytoplasmic component of the motor FliY as the primary phosphatase for CheY‐P, we constructed the B. subtilis FRET reporter of the chemotaxis pathway based on the phosphorylation‐dependent interaction between CheY‐YFP and CFP‐FliY. Similar to the CheY‐YFP/CheZ‐CFP FRET pair for E. coli, CheY‐YFP/CFP‐FliY pair in B. subtilis allows monitoring changes of the intracellular CheA activity upon ligand stimulation (Fig. 4A). Expectedly, the FRET response to attractants in B. subtilis was opposite from that in E. coli, as the binding of attractant induces an increase in the kinase activity in B. subtilis.
Figure 4.
Chemotactic response to amino acids in B . subtilis.
A. Exemplary FRET measurement of the chemotactic response in B . subtilis cells, using the phosphorylation‐dependent interaction between CFP‐FliY and CheY‐YFP. Measurements were performed as in Fig. 1A. The response to a saturating stimulus of 100 μM asparagine served as positive control. Arrows indicate addition and removal of the indicated stimuli.
B. Dose responses to all amino acids attractants in B . subtilis, derived from FRET measurements performed as in (A).
Using this FRET reporter, we could detect attractant responses of B. subtilis to 18 out of 20 tested L‐amino acids (Fig. 4A and B and Table S3). Lysine and arginine were the only amino acids that did not elicit clear responses at the tested concentrations. Cysteine, proline and asparagine were most effective, with EC50 below 1 μM, and glutamate and aspartate were least effective with EC50 above 1 mM. Notably, the responses elicited by tyrosine, histidine and tryptophan were distinctly different, leading to lesser maximal activation of the pathway activity than other amino acids.
We further investigated the sequence of amino acid uptake in B. subtilis, showing that in the absence of other carbon and nitrogen sources, it can utilize nine amino acids during growth in minimal medium (Fig. 5). Fastest consumption was observed for asparagine and arginine, followed by glutamine, glutamate, serine, aspartate, alanine and cysteine. Proline was primarily consumed during the late exponential phase and stationary phase (Fig. 5A). The levels of other 10 amino acids remained relatively constant throughout the growth (Fig. S12A). Despite several differences in the order of consumption, the overall set of amino acids consumed by B. subtilis was similar to that of E. coli. The exceptions are arginine and asparagine, which are rapidly consumed by B. subtilis but are not catabolized by E. coli under aerobic conditions. A similar pattern of amino acid utilization was obtained for the parental wild‐type strain of B. subtilis NCIB3610, although this strain could utilize several additional amino acids during the late exponential phase of growth (Fig. 5C and Fig. S12B).
Figure 5.
Consumption of amino acids by B . subtilis.
A. Amino acid uptake profiles for B . subtilis cells grown in the minimal medium containing equimolar mixture of 20 l‐amino acids as the sole source of carbon and nitrogen. Profiles of amino acids with less than 50% utilization are shown in Fig. S12A.
B. Correlation analysis between t1/2 of amino acid uptake derived from (A) and the EC 50 of chemotactic responses determined from Fig. 4B.
C. Amino acid uptake profiles for B . subtilis NCIB3610 grown under the same conditions as in (A). Profiles of amino acids with less than 50% utilization are shown in Fig. S12B.
In contrast to E. coli, however, no obvious correlation could be observed between the timing of uptake and chemotactic efficiency of amino acids in B. subtilis (Fig. 5B). For example, proline is a strong attractant but consumed at a later growth stage, whereas arginine is not an efficient chemoattractant but consumed rapidly. Some other strong amino acid attractants, such as leucine, isoleucine and valine, are not metabolized at all under the experimental conditions.
Discussion
Although most studied bacteria exhibit chemotaxis to amino acids and can also use them as nutrients, the relation between chemotaxis and consumption of amino acids remains largely unclear. In this study, we systematically characterized this relation for two model bacterial organisms, E. coli and B. subtilis. The chemotactic effectiveness of amino acids, quantified using FRET reporters of pathway activity for both organisms, was quite consistent with previous results from capillary assays (Mesibov and Adler, 1972; Van Der Drift and De Jong, 1974; Ordal and Gibson, 1977; Hedblom and Adler, 1983), further confirming the validity of the FRET assay for measurements of the chemotactic responses. Because of our observations that in the millimolar range many amino acids elicit apparently non‐specific attractant responses in the absence of the receptor sensory domain (Fig. S4), we only consider seven amino acids – aspartate, serine, cysteine, asparagine, alanine, glutamate and glycine – to be specific attractants for wild‐type E. coli. For B. subtilis, attractant response was observed for most amino acids, except glutamate, aspartate, arginine, and lysine that elicited only very weak or no response. Notably, these amino acids also showed least efficient chemotaxis in the capillary assays (Ordal and Gibson, 1977).
Importantly, the observed sets of the amino acid attractants are not expected to vary significantly between strains of E. coli or B. subtilis or to depend on growth conditions, and the two E. coli strains used in this study indeed showed nearly identical chemotactic responses to amino acids (Fig. 1 and Fig. S8). Bacterial chemotaxis system is known to function as a module (Hartwell et al., 1999), largely independent of the other cellular processes. Moreover, in both E. coli and B. subtilis (as well as in other bacteria where amino acid chemotaxis has been characterized), the amino acid attractants are detected by specific receptors that are expressed as part of the chemotaxis module, meaning that the overall amino acid specificity is hard‐wired in the chemotaxis system. Nevertheless, within this set of amino acid attractants, relative preferences for individual amino acids might change due to changes in the relative expression of different receptors, e.g. dependent on the growth stage of the culture (Salman and Libchaber, 2007; Sourjik et al., 2007; Kalinin et al., 2010; Neumann et al., 2010).
In general, there was little similarity in the spectrum and efficiency of amino acid attractants between E. coli and B. subtilis. For example, aspartate, the best chemoattractant for E. coli, is very inefficient for B. subtilis, whereas leucine is a strong attractant for B. subtilis but repellent for E. coli. Moreover, the number of chemoattractive amino acids is much higher for B. subtilis, which may reflect differences in the habitat and in the life style. On average, among bacteria where the amino acid chemotaxis has been studied, the number of attractive amino acids is on average significantly larger in environmental than in intestinal bacteria (Table S4).
In contrast, E. coli and B. subtilis show very similar profiles of amino acid utilization, despite some strain‐ and specie‐specific differences in the number of amino acids that can be utilized and in the order of consumption. Both E. coli and B. subtilis can utilize serine, aspartate, cysteine, glutamate, glutamine and alanine, and with lower efficiency proline and threonine. B. subtilis additionally consumes arginine and asparagine, whereas E. coli only consumes asparagine under anaerobic conditions. These findings are in general agreement with previous reports that used more complex media (Liebs et al., 1988; Pruss et al., 1994; Selvarasu et al., 2009) and confirm strong evolutionary conservation of the metabolic network.
Most importantly, for E. coli, we observed a nearly perfect overlap between chemoattractive and catabolized amino acids (Table S1), with an additional correlation between the order of amino acid utilization and their efficiency as chemoattractants. This correlation was strongest with the amino acid utilization during aerobic growth on a mixture of amino acids as the sole carbon and nitrogen source, with six out of seven amino acids utilized by E. coli MG1655 (serine, aspartate, cysteine, glycine, glutamate and alanine) being attractants. Similar results were obtained for E. coli NCM3722, although this strain could additionally utilize, albeit less efficiently, several amino acids that were not attractants. Although fewer amino acids were utilized under anaerobic conditions, the strongest attractants serine, aspartate, cysteine and asparagine were also the first amino acids to be consumed anaerobically. Thus, all of the efficient chemoattractive amino acids are also efficiently used, either aerobically or anaerobically, whereas none of the non‐utilized amino acids are attractants. Although several of the least efficiently utilized amino acids are not attractants, these are presumably also least nutritionally valuable. The only interesting exception is glutamine, which is apparently nutritionally valuable but is not chemoattractive. Altogether, these results indicate that the chemotaxis system of E. coli has evolved to specifically locate sources of most nutritionally valuable amino acids under both aerobic and anaerobic conditions. Our conclusions are consistent with the theoretical analysis that suggested that chemotaxis is beneficial for bacteria to maximize their nutrient uptake even in a highly variable environment (Celani and Vergassola, 2010), such as that of the intestine.
Chemotaxis also apparently enables E. coli to avoid high concentrations of toxic amino acids, such as valine and leucine, which inhibit cell growth by affecting biosynthesis of other amino acids (Amos and Cohen, 1954; De Felice et al., 1979; Harris, 1981; Hama et al., 1990; 1991; Valle et al., 2008). Because high levels of valine may also be produced by bacterial biofilms (Valle et al., 2008), repulsion by valine could help to avoid nutrient‐exhausted environment. An interesting dilemma is presented by serine and cysteine, which are valuable and rapidly catabolized nutrients but at the same time are growth‐inhibitory. Serine and cysteine thus serve as highly efficient attractants sensed by Tsr, but cell accumulation toward toxic concentration of these amino acids is nevertheless prevented by a failure of Tsr to adapt to high levels of its ligands, which disables chemotaxis in the millimolar concentration range (Neumann et al., 2014).
The importance of the catabolized amino acids as attractants is further emphasized by both the receptor specificity and the observed redundancy of their detection by Tsr and Tar. Although Tsr is clearly a primary sensor for serine, cysteine, alanine and glycine, these amino acids are also sensed by Tar with the same order of preference. We speculate that such redundancy may be important to ensure detection of these attractants independent of cell density, because the ratio of Tar to Tsr is known to rise at later growth stages of bacterial culture (Salman and Libchaber, 2007; Kalinin et al., 2010). Expression of Tsr is highest at low cell density, which enhances chemotaxis toward its primary ligands serine and cysteine that are also the first amino acids to be catabolized. When Tsr is diluted at high cell density, the chemotactic preference is shifted to Tar ligands that are catabolized next, but certain sensitivity to serine and cysteine is maintained independent of Tsr expression because of their detection by Tar. Such redundant sensing may be a general feature of bacterial chemotaxis, because it is commonly found in bacteria (Hanlon and Ordal, 1994; Muller et al., 1997; Taguchi et al., 1997). Interestingly, whereas all other responses to amino acid attractants and repellents in E. coli are clearly mediated by the periplasmic sensory domains of receptors, the Tar‐mediated serine response is apparently conferred directly by the cytoplasmic portion of Tar.
The strong correlation between metabolic and chemotactic preferences observed for E. coli suggests that in its natural environment E. coli is exposed to amino acid gradients of varying composition and that it benefits from being able to follow gradients with the highest metabolic value. However, this correlation for amino acids does not mean that E. coli exclusively uses chemotaxis to find nutrients, and E. coli chemotaxis toward both bacterial and mammalian signaling molecules has been demonstrated (Hegde et al., 2011; Pasupuleti et al., 2014). Furthermore, we show that B. subtilis is apparently attracted by a much broader spectrum of amino acids irrespective of their nutritional value. We thus speculate that – in contrast to E. coli – B. subtilis rather uses gradients of amino acids as general cues to locate sources of nutrients such as plant roots or to initiate symbiosis or pathogenesis (Caetano‐Anolles et al., 1988; De Weert et al., 2002; Bacilio‐Jimenez et al., 2003; Yao and Allen, 2006). This hypothesis is supported by the observation that such soil‐dwelling bacteria as Pseudomonas aeruginosa, P. fluorescens or Sinorhizobium meliloti have similarly broad spectra of amino acid attractants (Burg et al., 1982; Gotz et al., 1982; Taguchi et al., 1997).
Experimental procedures
Strains and plasmids
All strains and plasmids used in this work are listed in Table S3. For E. coli, FRET pair CheY‐YFP and CheZ‐CFP was expressed from a bicistronic construct pVS88 (Sourjik and Berg, 2004). Strain VS104 [Δ(cheY cheZ)] (Sourjik and Berg, 2002) and NCM3722 were transformed with pVS88 were used as the wild type for FRET. Receptorless strain VS181 [Δ(cheY cheZ) Δ(tar tsr tap trg aer)] (Sourjik and Berg, 2004) was transformed with pVS88 and a plasmid expressing the receptor of interest. FRET reporter strain CH7‐Bs for B. subtilis was constructed by genome integration of CFP‐FliY‐CheY‐YFP at the amyE locus of B. subtilis 168.
Culture medium and growth conditions
For FRET experiments, E. coli cells were grown as previously described in TB (1% tryptone, 0.5% NaCl) at 34°C, 275 r.p.m., supplemented with appropriate antibiotics (100 mg ml−1 ampicillin; 17 mg ml−1 chloramphenicol) and inducers. Cells were harvested at OD600 of 0.6. B. subtilis cells were grown under the same conditions, except that the overnight culture was grown in Luria–Bertani (1% tryptone, 0.5% yeast extract and 0.5% NaCl), and the day culture was harvested at OD600 of 0.4.
For amino acid uptake experiments, E. coli MG1655 or NCM3722 were grown in modified M9 minimal medium (47 mM Na2HPO4, 22 mM KH2PO4, 8 mM NaCl2, 2 mM MgSO4, 100 μM CaCl2) supplemented with 1 mM of each 20 l‐amino acids as the sole source of carbon and nitrogen. Alternatively, 0.4% glucose, 0.4% glycerol and/or 0.1% NH4Cl were added to the medium, as indicated. For anaerobic growth of NCM3722, 0.4% glucose was added to the medium. B. subtilis 168 and NCIB3610 were grown in modified S7 minimal medium (4 mM KPO4, 50 mM MOPS, 50 μM MnSO4, 5 μM FeSO4, 2 mM MgSO4, 2 μM thiamine, 1 μM ZnCl2, 700 μM CaCl2) with the same amino acid supplementation as for E. coli. All bacteria were cultured at 37°C, 120 r.p.m. and sampling at regular time points for analyzing the residual concentration of each amino acid in the medium.
For the growth inhibition of E. coli by different amino acids, 1 mM of a single L‐amino acid was added to the M9 medium (glucose as carbon source) in the beginning of culturing at 37°C, 120 r.p.m.
Growth of E. coli with individual amino acids as the sole carbon or nitrogen source was tested in the same modified M9 minimal medium, but 1 mM of one amino acid was added to each culture in the absence of any other carbon or nitrogen source, or in the presence of 0.4% glycerol (carbon source) or 0.1% NH4Cl (nitrogen source). Cells were grown in 24‐well plates, and OD600 values were detected with a plate reader (Tecan Infinite M1000, Tecan Deutschland GmbH, Crailsheim, Germany) after 48 h.
FRET assay
Measurements were performed on an upright fluorescence microscope (Zeiss Axio Imager.Z1, Carl Zeiss Microscopy GmbH, Jena, Germany) as previously described (Sourjik et al., 2007; Neumann et al., 2010), using either purified amino acids (Sigma or Applichem, > 98% purity) or synthetic amino acids (MP Biomedicals).
Analysis of amino acid utilization
Non‐thiol‐containing amino acids were quantified after specific labeling with the fluorescence dye AccQ‐TagTM (Waters) according to the manufacturer's protocol. The resulting derivatives were separated by reversed phase chromatography on an Acquity BEH C18 column (150 mm × 2.1 mm, 1.7 μm, Waters) connected to an Acquity H‐class UPLC system and quantified by fluorescence detection (Acquity FLR detector, Waters). The column was heated to 42°C and equilibrated with 5 column volumes of buffer A (140 mM sodium acetate pH 6.3, 7 mM triethanolamine) at a flow rate of 0.45 ml min−1. Baseline separation of amino acid derivates was achieved by increasing the concentration of acetonitrile (B) in buffer A as follows: 1 min 8% B, 7 min 9% B, 7.3 min 15% B, 12.2 min 18% B, 13.1 min 41% B, 15.1 min 80% B, hold for 2.2 min, and return to 8% B in 1.7 min. Data acquisition and processing was performed with the Empower3 software suite (Waters). Cys was determined after labeling with monobromobimane (Calbiochem) as described before (Wirtz et al., 2004).
Supporting information
Supporting information
Acknowledgements
We would like to thank Seigo Shima and Liping Bai for their help in conducting anaerobic growth experiments and Peter Graumann for providing B. subtilis NCIB3610 strain. This work was supported by grant 294761‐MicRobE from the European Research Council and by grants SO 421/11‐1 and ZUK 49/2 from the Deutsche Forschungsgemeinschaft. We would like to thank the Metabolomics Core Technology Platform of the Excellence Cluster CellNetworks for support with HPLC‐based metabolite quantification.
References
- Amos, H. , and Cohen, G.N. (1954) Amino acid utilization in bacterial growth. 2. A study of threonine‐isoleucine relationships in mutants of Escherichia coli . Biochem J 57: 338–343. [DOI] [PMC free article] [PubMed] [Google Scholar]
- Bacilio‐Jimenez, M. , Aguilar‐Flores, S. , Ventura‐Zapata, E. , Perez‐Campos, E. , Bouquelet, S. , and Zenteno, E. (2003) Chemical characterization of root exudates from rice (Oryza sativa) and their effects on the chemotactic response of endophytic bacteria. Plant Soil 249: 271–277. [Google Scholar]
- Burg, D. , Guillaume, J. , and Tailliez, R. (1982) Chemotaxis by Rhizobium meliloti . Arch Microbiol 133: 162–163. [Google Scholar]
- Caetano‐Anolles, G. , Wall, L.G. , De Micheli, A.T. , Macchi, E.M. , Bauer, W.D. , and Favelukes, G. (1988) Role of motility and chemotaxis in efficiency of nodulation by Rhizobium meliloti . Plant Physiol 86: 1228–1235. [DOI] [PMC free article] [PubMed] [Google Scholar]
- Cantwell, B.J. , Draheim, R.R. , Weart, R.B. , Nguyen, C. , Stewart, R.C. , and Manson, M.D. (2003) CheZ phosphatase localizes to chemoreceptor patches via CheA‐short. J Bacteriol 185: 2354–2361. [DOI] [PMC free article] [PubMed] [Google Scholar]
- Celani, A. , and Vergassola, M. (2010) Bacterial strategies for chemotaxis response. Proc Natl Acad Sci USA 107: 1391–1396. [DOI] [PMC free article] [PubMed] [Google Scholar]
- Chang, D.E. , Shin, S. , Rhee, J.S. , and Pan, J.G. (1999) Acetate metabolism in a pta mutant of Escherichia coli W3110: importance of maintaining acetyl coenzyme a flux for growth and survival. J Bacteriol 181: 6656–6663. [DOI] [PMC free article] [PubMed] [Google Scholar]
- De Felice, M. , Levinthal, M. , Iaccarino, M. , and Guardiola, J. (1979) Growth inhibition as a consequence of antagonism between related amino acids: effect of valine in Escherichia coli K‐12. Microbiol Rev 43: 42–58. [DOI] [PMC free article] [PubMed] [Google Scholar]
- De Weert, S. , Vermeiren, H. , Mulders, I.H. , Kuiper, I. , Hendrickx, N. , Bloemberg, G.V. , et al (2002) Flagella‐driven chemotaxis towards exudate components is an important trait for tomato root colonization by Pseudomonas fluorescens . Mol Plant Microbe Interact 15: 1173–1180. [DOI] [PubMed] [Google Scholar]
- Gosink, K.K. , Buron‐Barral, M.D. , and Parkinson, J.S. (2006) Signaling interactions between the aerotaxis transducer Aer and heterologous chemoreceptors in Escherichia coli . J Bacteriol 188: 3487–3493. [DOI] [PMC free article] [PubMed] [Google Scholar]
- Gotz, R. , Limmer, N. , Ober, K. , and Schmitt, R. (1982) Motility and chemotaxis in 2 strains of Rhizobium with complex flagella. J Gen Microbiol 128: 789–798. [Google Scholar]
- Halvorson, H. (1972) Utilization of single L‐amino acids as sole source of carbon and nitrogen by bacteria. Can J Microbiol 18: 1647–1650. [DOI] [PubMed] [Google Scholar]
- Hama, H. , Sumita, Y. , Kakutani, Y. , Tsuda, M. , and Tsuchiya, T. (1990) Target of serine inhibition in Escherichia coli . Biochem Biophys Res Commun 168: 1211–1216. [DOI] [PubMed] [Google Scholar]
- Hama, H. , Kayahara, T. , Tsuda, M. , and Tsuchiya, T. (1991) Inhibition of homoserine dehydrogenase‐I by L‐serine in Escherichia coli . J Biochem 109: 604–608. [DOI] [PubMed] [Google Scholar]
- Hanlon, D.W. , and Ordal, G.W. (1994) Cloning and characterization of genes encoding methyl‐accepting chemotaxis proteins in Bacillus subtilis . J Biol Chem 269: 14038–14046. [PubMed] [Google Scholar]
- Harris, C.L. (1981) Cysteine and growth inhibition of Escherichia coli: threonine deaminase as the target enzyme. J Bacteriol 145: 1031–1035. [DOI] [PMC free article] [PubMed] [Google Scholar]
- Hartwell, L.H. , Hopfield, J.J. , Leibler, S. , and Murray, A.W. (1999) From molecular to modular cell biology. Nature 402: C47–C52. [DOI] [PubMed] [Google Scholar]
- Hazelbauer, G.L. (2012) Bacterial chemotaxis: the early years of molecular studies. Annu Rev Microbiol 66: 285–303. [DOI] [PMC free article] [PubMed] [Google Scholar]
- Hazelbauer, G.L. , Falke, J.J. , and Parkinson, J.S. (2008) Bacterial chemoreceptors: high‐performance signaling in networked arrays. Trends Biochem Sci 33: 9–19. [DOI] [PMC free article] [PubMed] [Google Scholar]
- Hedblom, M.L. , and Adler, J. (1983) Chemotactic response of Escherichia coli to chemically synthesized amino acids. J Bacteriol 155: 1463–1466. [DOI] [PMC free article] [PubMed] [Google Scholar]
- Hegde, M. , Englert, D.L. , Schrock, S. , Cohn, W.B. , Vogt, C. , Wood, T.K. , et al (2011) Chemotaxis to the quorum‐sensing signal AI‐2 requires the Tsr chemoreceptor and the periplasmic LsrB AI‐2‐binding protein. J Bacteriol 193: 768–773. [DOI] [PMC free article] [PubMed] [Google Scholar]
- Hugdahl, M.B. , Beery, J.T. , and Doyle, M.P. (1988) Chemotactic behavior of Campylobacter jejuni . Infect Immun 56: 1560–1566. [DOI] [PMC free article] [PubMed] [Google Scholar]
- Kahane, S. , Marcus, M. , Metzer, E. , and Halpern, Y.S. (1976) Effect of growth conditions on glutamate transport in wild‐type strain and glutamate‐utilizing mutants of Escherichia coli . J Bacteriol 125: 762–769. [DOI] [PMC free article] [PubMed] [Google Scholar]
- Kalinin, Y. , Neumann, S. , Sourjik, V. , and Wu, M.M. (2010) Responses of Escherichia coli bacteria to two opposing chemoattractant gradients depend on the chemoreceptor ratio. J Bacteriol 192: 1796–1800. [DOI] [PMC free article] [PubMed] [Google Scholar]
- Keseler, I.M. , Mackie, A. , Peralta‐Gil, M. , Santos‐Zavaleta, A. , Gama‐Castro, S. , Bonavides‐Martinez, C. , et al (2013) EcoCyc: fusing model organism databases with systems biology. Nucleic Acids Res 41: D605–D612. [DOI] [PMC free article] [PubMed] [Google Scholar]
- Keymer, J.E. , Endres, R.G. , Skoge, M. , Meir, Y. , and Wingreen, N.S. (2006) Chemosensing in Escherichia coli: two regimes of two‐state receptors. Proc Natl Acad Sci USA 103: 1786–1791. [DOI] [PMC free article] [PubMed] [Google Scholar]
- Liebs, P. , Riedel, K. , Graba, J.P. , Schrapel, D. , and Tischler, U. (1988) Formation of some extracellular enzymes during the exponential‐growth of Bacillus subtilis . Folia Microbiol 33: 88–95. [DOI] [PubMed] [Google Scholar]
- McFall, E. , and Newman, E.B. (1996) Amino acids as carbon sources In Escherichia coli and Salmonella: Cellular and Molecular Biology. Neidhardt F.C., Curtiss R., III, and Ingraham J.L. (eds). Washington, DC: ASM Press, pp. 358–379. [Google Scholar]
- Mello, B.A. , and Tu, Y. (2003) Quantitative modeling of sensitivity in bacterial chemotaxis: the role of coupling among different chemoreceptor species. Proc Natl Acad Sci USA 100: 8223–8228. [DOI] [PMC free article] [PubMed] [Google Scholar]
- Mesibov, R. , and Adler, J. (1972) Chemotaxis toward amino acids in Escherichia coli . J Bacteriol 112: 315–326. [DOI] [PMC free article] [PubMed] [Google Scholar]
- Muller, J. , Schiel, S. , Ordal, G.W. , and Saxild, H.H. (1997) Functional and genetic characterization of mcpC, which encodes a third methyl‐accepting chemotaxis protein in Bacillus subtilis . Microbiology 143 (Part 10): 3231–3240. [DOI] [PubMed] [Google Scholar]
- Neumann, S. , Hansen, C.H. , Wingreen, N.S. , and Sourjik, V. (2010) Differences in signalling by directly and indirectly binding ligands in bacterial chemotaxis. EMBO J 29: 3484–3495. [DOI] [PMC free article] [PubMed] [Google Scholar]
- Neumann, S. , Vladimirov, N. , Krembel, A.K. , Wingreen, N.S. , and Sourjik, V. (2014) Imprecision of adaptation in Escherichia coli chemotaxis. PLoS ONE 9: e84904. [DOI] [PMC free article] [PubMed] [Google Scholar]
- Ordal, G.W. , and Gibson, K.J. (1977) Chemotaxis toward amino acids by Bacillus subtilis . J Bacteriol 129: 151–155. [DOI] [PMC free article] [PubMed] [Google Scholar]
- Pasupuleti, S. , Sule, N. , Cohn, W.B. , MacKenzie, D.S. , Jayaraman, A. , and Manson, M.D. (2014) Chemotaxis of Escherichia coli to norepinephrine (NE) requires conversion of NE to 3,4‐dihydroxymandelic acid. J Bacteriol 196: 3992–4000. [DOI] [PMC free article] [PubMed] [Google Scholar]
- Porter, S.L. , Wadhams, G.H. , and Armitage, J.P. (2011) Signal processing in complex chemotaxis pathways. Nat Rev Microbiol 9: 153–165. [DOI] [PubMed] [Google Scholar]
- Pruss, B.M. , Nelms, J.M. , Park, C. , and Wolfe, A.J. (1994) Mutations in NADH: ubiquinone oxidoreductase of Escherichia coli affect growth on mixed amino acids. J Bacteriol 176: 2143–2150. [DOI] [PMC free article] [PubMed] [Google Scholar]
- Quay, S.C. , Dick, T.E. , and Oxender, D.L. (1977) Role of transport systems in amino acid metabolism: leucine toxicity and the branched‐chain amino acid transport systems. J Bacteriol 129: 1257–1265. [DOI] [PMC free article] [PubMed] [Google Scholar]
- Reitzer, L. (2003) Nitrogen assimilation and global regulation in Escherichia coli . Annu Rev Microbiol 57: 155–176. [DOI] [PubMed] [Google Scholar]
- Reitzer, L.J. (1996) Sources of nitrogen and their utilization In Escherichia coli and Salmonella: Cellular and Molecular Biology. Neidhardt F.C., Curtiss R., III, and Ingraham J.L. (eds). Washington, DC: ASM Press, pp. 380–390. [Google Scholar]
- Salman, H. , and Libchaber, A. (2007) A concentration‐dependent switch in the bacterial response to temperature. Nat Cell Biol 9: 1098–1100. [DOI] [PubMed] [Google Scholar]
- Selvarasu, S. , Ow, D.S. , Lee, S.Y. , Lee, M.M. , Oh, S.K. , Karimi, I.A. , et al (2009) Characterizing Escherichia coli DH5alpha growth and metabolism in a complex medium using genome‐scale flux analysis. Biotechnol Bioeng 102: 923–934. [DOI] [PubMed] [Google Scholar]
- Soupene, E. , van Heeswijk, W.C. , Plumbridge, J. , Stewart, V. , Bertenthal, D. , Lee, H. , et al (2003) Physiological studies of Escherichia coli strain MG1655: growth defects and apparent cross‐regulation of gene expression. J Bacteriol 185: 5611–5626. [DOI] [PMC free article] [PubMed] [Google Scholar]
- Sourjik, V. (2004) Receptor clustering and signal processing in E. coli chemotaxis. Trends Microbiol 12: 569–576. [DOI] [PubMed] [Google Scholar]
- Sourjik, V. , and Berg, H.C. (2000) Localization of components of the chemotaxis machinery of Escherichia coli using fluorescent protein fusions. Mol Microbiol 37: 740–751. [DOI] [PubMed] [Google Scholar]
- Sourjik, V. , and Berg, H.C. (2002) Receptor sensitivity in bacterial chemotaxis. Proc Natl Acad Sci USA 99: 123–127. [DOI] [PMC free article] [PubMed] [Google Scholar]
- Sourjik, V. , and Berg, H.C. (2004) Functional interactions between receptors in bacterial chemotaxis. Nature 428: 437–441. [DOI] [PubMed] [Google Scholar]
- Sourjik, V. , Vaknin, A. , Shimizu, T.S. , and Berg, H.C. (2007) In vivo measurement by FRET of pathway activity in bacterial chemotaxis. Methods Enzymol 423: 365–391. [DOI] [PubMed] [Google Scholar]
- Szurmant, H. , and Ordal, G.W. (2004) Diversity in chemotaxis mechanisms among the bacteria and archaea. Microbiol Mol Biol Rev 68: 301–319. [DOI] [PMC free article] [PubMed] [Google Scholar]
- Szurmant, H. , Muff, T.J. , and Ordal, G.W. (2004) Bacillus subtilis CheC and FliY are members of a novel class of CheY‐P‐hydrolyzing proteins in the chemotactic signal transduction cascade. J Biol Chem 279: 21787–21792. [DOI] [PubMed] [Google Scholar]
- Taguchi, K. , Fukutomi, H. , Kuroda, A. , Kato, J. , and Ohtake, H. (1997) Genetic identification of chemotactic transducers for amino acids in Pseudomonas aeruginosa . Microbiology 143 (Part 10): 3223–3229. [DOI] [PubMed] [Google Scholar]
- Valle, J. , Da Re, S. , Schmid, S. , Skurnik, D. , D'Ari, R. , and Ghigo, J.M. (2008) The amino acid valine is secreted in continuous‐flow bacterial biofilms. J Bacteriol 190: 264–274. [DOI] [PMC free article] [PubMed] [Google Scholar]
- Van Der Drift, C. , and De Jong, M.H. (1974) Chemotaxis toward amino acids in Bacillus subtilis . Arch Mikrobiol 96: 83–92. [PubMed] [Google Scholar]
- Wadhams, G.H. , and Armitage, J.P. (2004) Making sense of it all: bacterial chemotaxis. Nat Rev Mol Cell Biol 5: 1024–1037. [DOI] [PubMed] [Google Scholar]
- Wang, H. , and Matsumura, P. (1996) Characterization of the CheA(S)/CheZ complex: a specific interaction resulting in enhanced dephosphorylating activity on CheY‐phosphate. Mol Microbiol 19: 695–703. [DOI] [PubMed] [Google Scholar]
- Wirtz, M. , Droux, M. , and Hell, R. (2004) O‐acetylserine (thiol) lyase: an enigmatic enzyme of plant cysteine biosynthesis revisited in Arabidopsis thaliana . J Exp Bot 55: 1785–1798. [DOI] [PubMed] [Google Scholar]
- Yao, J. , and Allen, C. (2006) Chemotaxis is required for virulence and competitive fitness of the bacterial wilt pathogen Ralstonia solanacearum . J Bacteriol 188: 3697–3708. [DOI] [PMC free article] [PubMed] [Google Scholar]
Associated Data
This section collects any data citations, data availability statements, or supplementary materials included in this article.
Supplementary Materials
Supporting information