

Abstract
Background
The current study evaluates the mortality of 2,354 workers first employed at a Baltimore chromate production plant between 1950 and 1974.
Methods
The National Death Index (NDI Plus) was used to determine vital status and cause of death. Cumulative chromium (VI) exposure and nasal and skin irritation were evaluated as risk factors for lung cancer mortality.
Results
There are 91,186 person‐years of observation and 217 lung cancer deaths. Cumulative chromium (VI) exposure, nasal irritation, nasal perforation, nasal ulceration, and other forms of irritation (e.g., skin irritation) were associated with lung cancer mortality.
Conclusion
Cumulative chromium (VI) exposure was a risk factor for lung cancer death. Cancer deaths, other than lung cancer, were not significantly elevated. Irritation may be a possible mechanism for chromium (VI)‐induced lung cancer. Am. J. Ind. Med. 58:905–913, 2015. © 2015 The Authors. American Journal of Industrial Medicine Published by Wiley Periodicals, Inc.
Keywords: lung cancer, chromium (VI), irritation, smoking, chromium (III)
Abbreviations
- CI
confidence interval
- LTAS
Life Table Analysis System
- NDI
National Death Index
- NIOSH
National Institute for Occupational Safety and Health
- O/E
Observed/Expected
- PEL
Permissible Exposure Limit
- REL
Recommended Exposure Limit
INTRODUCTION
In the middle of the 20th century, several studies identified an increased lung cancer risk among workers in the chromate‐producing industry in the United States [Machle and Gregorius, 1948; Baetjer, 1950; Mancuso and Hueper, 1951; U.S. Public Health Service, 1951]. Since that time additional studies have added to the strength of evidence of the carcinogenicity of chromium (VI). IARC [1990] concluded that there is sufficient evidence in humans for the carcinogenicity of chromium (VI) compounds as encountered in the chromate production, chromate pigment production and chromium plating industries. In its most recent evaluation of chromium VI compounds, IARC [2012] concluded that there is sufficient evidence in humans of the carcinogenicity of chromium (VI) compounds. IARC [2012] also concluded that chromium (VI) compounds cause cancer of the lung and that positive associations have been observed between exposure to chromium (VI) compounds and cancer of the nose and nasal sinuses.
Park et al. [2004], using the data from Gibb et al. [2000a], estimated the excess lifetime risk for various concentrations of chromium (VI) assuming a 45‐year exposure. Park et al. [2004] is the basis of the National Institute of Occupational Safety and Health (NIOSH) Recommended Exposure Limit (REL) for chromium (VI). WHO [2013] used the Park et al. [2004] estimates as the basis of its lifetime lung cancer risk estimates for occupational and environmental exposure to chromium (VI).
The current study is an update of the cohort study by Gibb et al. [2000a] of workers employed at a chromate production plant in Baltimore. Gibb et al. [2000a] is an extension of Hayes et al. [1979]. Hayes et al. [1979] identified 4,217 workers at the Baltimore facility who were newly employed between January 1, 1945 and December 31, 1974 and excluded workers employed fewer than 90 days, women, and those with unknown length of employment. This resulted in a cohort of 1,803 hourly employees and 298 salaried employees. The authors found that the risk of lung cancer increased with duration of employment but did not have the data to quantitatively evaluate chromium (VI) concentrations and lung cancer risk.
Gibb et al. [2000a] obtained measures of airborne chromium (VI) concentrations for the Baltimore facility from company records. The Gibb et al. [2000a] cohort is similar to the Hayes et al. [1979] cohort, but Gibb et al. [2000a] excluded those who began work before August 1, 1950 (n = 734). On that date the construction of a new mill and roast plant was completed, and extensive exposure information was collected from that date forward. Gibb et al. [2000a] included workers who worked fewer than 90 days but began employment after August 1, 1950 (n = 990) to expand the size of the low cumulative exposure group. The resulting cohort size was 2,357. Exposure work histories in Gibb et al. [2000a] were updated through July 1985, the date when operations at the plant ceased. Smoking status at the beginning of employment and clinical findings of irritation were identified from company medical records. The resulting study had 70,736 person‐years of observation and 855 deaths including 122 lung cancer deaths. The authors found that lung cancer risk increased with cumulative chromium (VI) exposure and was not confounded by smoking status. There was no evidence of an increased lung cancer risk with cumulative chromium (III) exposure.
The current study was undertaken to evaluate how the lung cancer risk observed in Gibb et al. [2000a] may have changed over the course of the additional 19‐year follow‐up period and provide additional detail to that presented in the original study. Specifically, the aims of the current study were to (i) evaluate whether an interaction exists between smoking and chromium (VI), (ii) explore the relationship between clinical irritation and lung cancer risk, (iii) determine whether mortality from diseases other than lung cancer is elevated, and (iv) evaluate whether an increased lung cancer risk exists at lower cumulative exposures than those found in Gibb et al. [2000a].
METHODS
The Institutional Review Board approval for this study was granted by the Johns Hopkins Bloomberg School of Public Health Institutional Review Board (FWA#0000287).
Smoking status at hire (yes/no) was recorded from company records. Clinical findings of irritation were based on records from the dispensary, physical examination, and hospital, and in the case of perforated septum, compensation reports. Signs of irritation included irritated nasal septum, ulcerated nasal septum, perforated nasal septum, bleeding nasal septum, irritated skin, ulcerated skin, dermatitis, burn, conjunctivitis, and perforated eardrum. Estimates of exposure to chromium (VI) (CrO3) were assigned by job title and based on approximately 70,000 contemporary measurements of airborne chromium (VI) concentration spanning the period of August 1, 1950, the date of first employment, through July 1985, the date that operations at the plant ceased. These exposure estimates were merged with each study member's work history to provide a profile of annual average exposures throughout their period of employment at the chromate production facility. Chromium (III) exposure was estimated based on the ratio of chromium (VI) to chromium (III) in settled dust. Further detail on the exposure assessment methods is available in Gibb et al. [2000a]. For the current study, the National Death Index (NDI Plus) was used to identify deaths occurring between January 1, 1993 and December 31, 2011. NDI Plus reports causes of death by the International Classification of Diseases codes 8th, 9th, or 10th revisions depending on the date of the death [National Center for Health Statistics, 2013].
The National Institute for Occupational Safety and Health (NIOSH) Life Table Analysis System (LTAS) Version 3.0.3 Build 7 was used to develop O/E ratios and confidence intervals for deaths from different causes [NIOSH, 2013a]. LTAS calculates age‐, race‐, sex‐, and calendar time‐adjusted standardized mortality ratios. We used national cause‐specific reference data (92 underlying causes of death for the period 1940–2007) for the analysis of deaths by all causes. This rate file is based on United States mortality rates stratified by gender, race, and 5‐year calendar time period. Underlying cause of death is defined as the disease or injury that initiated the sequence of events leading directly to death. LTAS estimates national and Maryland rates for 2008–2011 based on the rates for 2005–2007. Expected deaths for those with race unknown assumed a race distribution similar to the rest of the cohort.
Approximately 61% of all deaths occurred in Maryland; thus, Maryland rates in LTAS (119 causes of death for the period 1960–2007) were used to calculate expected lung cancer deaths. After receipt of the NDI Plus update, it was discovered that 12 workers, if alive, would be older than 100 years and 46 workers, if alive, would be older than 96 years. These individuals were likely lost to follow‐up. The oldest age of death in the cohort was 96. Thus it was decided to consider the end of follow‐up as December 31, 2011 or age 96 if the birthdate indicated the individual was beyond the age of 96. One lung cancer death occurred in July 1959; another occurred in November 1959. Because the LTAS rate file for Maryland for 119 causes of death doesn't recognize deaths occurring before 1960, the dates of the two deaths were changed to January 1, 1960 for the analysis. Confidence intervals for the O/E lung cancer deaths were produced using Fisher's exact test [Rothman and Boice, 1979]. Trend for O/E lung cancer death was evaluated using the method of Breslow et al. [1983]. Trend for odds ratios (ORs) of lung cancer death by number of nasal irritations per individual were evaluated by the method of Cochran and Armitage [Cochran, 1954; Armitage, 1955]. Wald confidence limits for the ORs of lung cancer death by number of nasal irritations per individual were estimated using SAS version 9.2 [SAS, 2009]. SAS version 9.2 was also used to produce frequency data, mean exposure for the observed‐to‐expected (O/E) ratios, means and medians of the exposure quartiles, and proportional hazards and logistic regression models [SAS, 2009].
The association of lung cancer with 10 different clinical findings of chromium irritation was examined using logistic regression. Lung cancer risk was also evaluated by frequency of different signs of nasal irritation (irritated nasal septum, ulcerated nasal septum, perforated nasal septum, bleeding nasal septum) per individual.
A proportional hazards model using age as the time variable and cumulative exposure as a time‐varying covariate was used to assess the relationship of chromium exposure and lung cancer risk. The effects of log transformation and different lag periods on the analysis were evaluated. Log transformation of cumulative chromium (VI) and chromium (III) exposures was found to improve the fit of the proportional hazard models (smaller Akaike information criterion) [Akaike, 1973]. The fit for a five year lag was similar to the fit for a zero year and a ten year lag. A five year lag was chosen.
The cohort of Gibb et al. [2000a] included 2,357 individuals. It was discovered in the current update that one of the 2,357 was female and two individuals had the same birth dates, dates of first employment and dates of termination but had different exposure profiles. It was decided to eliminate these three individuals from further analysis resulting in a cohort size of 2,354.
RESULTS
There was a total of 1,613 deaths from all causes (69% of cohort), 217 lung cancer deaths (9.2% of cohort), and 91,186 person‐years of observation (follow‐up to December 31, 2011 or age 96) in the current update. A summary of causes of death for the current update is reported in Table I.
Table I.
Observed/Expected Ratios for Selected Causes of Death a , b of Chromium Production Workers c , Baltimore, MD, 1950–2011
| Cause of Death | Observed | Expected | SMR (O/E) | 95% CI |
|---|---|---|---|---|
| All Causes | 1613 | 1501.14 | 1.07 | 1.02–1.13 |
| All Cancers | 460 | 395.32 | 1.16 | 1.06–1.27 |
| Buccal & pharynx cancer | 12 | 9.71 | 1.24 | 0.64–2.16 |
| Pharynx | 9 | 5.12 | 1.76 | 0.80–3.34 |
| Digestive & peritoneum cancer | 90 | 100.54 | 0.90 | 0.72–1.10 |
| Esophagus | 18 | 14.12 | 1.28 | 0.76–2.02 |
| Stomach | 7 | 14.56 | 0.48 | 0.19–0.99 |
| Intestine | 32 | 32.20 | 0.99 | 0.68–1.40 |
| Rectum | 7 | 6.74 | 1.04 | 0.42–2.14 |
| Biliary, liver, gall bladder | 14 | 12.00 | 1.17 | 0.64–1.96 |
| Pancreas | 12 | 19.65 | 0.61 | 0.32–1.07 |
| Respiratory System Cancer | 229 | 139.39 | 1.64 | 1.44–1.87 |
| Larynx | 10 | 5.30 | 1.89 | 0.90–3.47 |
| Trachea, bronchus & lung | 217 | 133.01 | 1.63 | 1.42–1.86 |
| Male genital cancer | 36 | 45.81 | 0.79 | 0.55–1.09 |
| Prostate | 36 | 44.84 | 0.80 | 0.56–1.11 |
| Urinary cancer | 13 | 18.63 | 0.70 | 0.37–1.19 |
| Bladder & other urinary | 10 | 9.79 | 1.02 | 0.49–1.88 |
| Other & unspecified site cancers | 53 | 45.76 | 1.16 | 0.87–1.52 |
| Skin | 9 | 6.11 | 1.47 | 0.67–2.80 |
| Lymphatic & Hematopoietic Cancer | 27 | 34.95 | 0.77 | 0.51–1.12 |
| Non‐Hodgkin's lymphoma | 6 | 12.37 | 0.49 | 0.18–1.06 |
| Leukemia | 15 | 13.22 | 1.13 | 0.63–1.87 |
| Diabetes mellitus | 35 | 38.79 | 0.90 | 0.63–1.26 |
| Blood and blood‐forming organ disease | 9 | 6.50 | 1.38 | 0.63–2.63 |
| Mental & psych disorders | 38 | 26.82 | 1.42 | 1.00–1.95 |
| Alcoholism | 23 | 9.21 | 2.50 | 1.58–3.75 |
| Other mental disorders | 15 | 17.60 | 0.85 | 0.48–1.41 |
| Nervous system disorders | 19 | 35.80 | 0.53 | 0.32–0.83 |
| Heart disease | 521 | 520.14 | 1.00 | 0.92–1.09 |
| Ischemic heart disease | 414 | 403.99 | 1.02 | 0.93–1.13 |
| Chronic disease of endocardium | 5 | 7.74 | 0.65 | 0.21–1.51 |
| Hypertension with heart disease | 18 | 24.34 | 0.74 | 0.44–1.17 |
| Other heart disease | 82 | 78.36 | 1.05 | 0.83–1.30 |
| Other circulatory system disease | 101 | 142.84 | 0.71 | 0.58–0.86 |
| Hypertension without heart disease | 14 | 11.64 | 1.20 | 0.66–2.02 |
| Cerebrovascular disease (stroke) | 60 | 94.76 | 0.63 | 0.48–0.82 |
| Diseases of the arteries, veins, pulmonary circulation | 27 | 36.45 | 0.74 | 0.49–1.08 |
| Respiratory system disease | 120 | 132.60 | 0.90 | 0.75–1.08 |
| Pneumonia | 36 | 42.94 | 0.84 | 0.59–1.16 |
| Chronic obstructive pulmonary disorder | 54 | 63.15 | 0.86 | 0.64–1.12 |
| Pneumoconiosis & other respiratory diseases | 27 | 22.58 | 1.20 | 0.79–1.74 |
| Digestive system disease | 60 | 66.48 | 0.90 | 0.69–1.16 |
| Genital‐urinary system disease | 33 | 34.94 | 0.94 | 0.65–1.33 |
| Symptoms and ill‐defined conditions | 9 | 20.34 | 0.44 | 0.20–0.84 |
| Accidents | 93 | 77.63 | 1.20 | 0.97–1.47 |
| Transportation accidents | 24 | 35.05 | 0.68 | 0.44–1.02 |
| Accidental poisoning | 5 | 4.05 | 1.24 | 0.40–2.88 |
| Accidental falls | 13 | 11.15 | 1.17 | 0.62–1.99 |
| Other accidents | 50 | 25.35 | 1.97 | 1.46–2.60 |
| Violence | 49 | 42.59 | 1.15 | 0.85–1.52 |
| Suicide | 23 | 19.43 | 1.18 | 0.75–1.78 |
| Homicide | 26 | 23.14 | 1.12 | 0.73–1.65 |
| Other & unspecified causes | 54 | 43.23 | 1.25 | 0.94–1.63 |
CI, Confidence interval; O/E, Observed/Expected; SMR, Standardized mortality ratio.
Expected deaths are based on age‐, race‐, and calendar‐year specific rates for the United States
Observed deaths reported for causes of death with five or more deaths.
The current report includes 1,243 white, 879 nonwhite, and 232 individuals of unknown race. The average number of years of followup for the cohort is 38.9 (SD = 14.2). The average number of years of followup for whites, nonwhites, and race unknown is 39.7, 37.2, and 40.7 years, respectively.
Lung cancer mortality for the total cohort was significantly elevated (O/E = 1.63, 95% CI: 1.42, 1.86). Death from alcoholism (O/E = 2.50, 95%CI: 1.58, 3.75) and other accidents (O/E = 1.97, 95% CI: 1.46, 2.60) were also significantly elevated. Significantly fewer deaths than expected were found for kidney cancer, nervous system disorders and cerebrovascular disease.
Table II provides a description of the entire cohort, the lung cancer cases, and the non‐lung cancer cases by selected continuous exposure‐related variables. The length of time from the date of first employment until the date of lung cancer death ranged from 6.4 years to 57.2 years with a mean of 33.8 (SD = 10.7) years. Figure 1 is a distribution of the time from date of hire until date of death for the 217 lung cancer deaths.
Table II.
Description of Cohort by Cumulative Chromium (VI) Exposure, Cumulative Chromium (III) Exposure, Years of Work at the Plant, Years of Follow‐up, Age at Hire and Calendar Year of Hire [N (Total Group) = 2,354; N (Lung cancer cases) = 217; N (Noncases) = 2,137] for Chromium Production Workers, Baltimore, MD, 1950‐2011
| Cumulative hexavalent exposure (mg CrO3/m3‐years) | Cumulative trivalent exposure (mg/m3‐years) | Work years | Years of follow‐up | Age at hire | Calendar year of hire (19XX) a | |
|---|---|---|---|---|---|---|
| Mean (SD) | ||||||
| Total group | 0.14 (0.36) | 2.01 (5.31) | 3.1 (6.5) | 38.9 (14.2) | 30.2 (7.5) | 58(7.7) |
| Lung cancer cases | 0.23 (0.52) | 3.17 (7.25) | 4.8 (8.6) | 33.8 (10.7) | 31.4 (8.0) | 56 (6.1) |
| Noncases | 0.13 (0.34) | 1.89 (5.06) | 2.9 (6.2) | 39.4 (14.4) | 30.0 (7.5) | 58 (7.8) |
| Median | ||||||
| Total group | 0.01 | 0.11 | 0.4 | 39.9 | 28.6 | 54 |
| Lung cancer cases | 0.02 | 0.18 | 0.5 | 34.4 | 29.5 | 53 |
| Noncases | 0.01 | 0.11 | 0.4 | 40.4 | 28.6 | 54 |
| Min/max | ||||||
| Total group | 0/5.25 | 0/64.67 | 0.003/37.8 | 0.3/61.4 | 16.9/63.0 | 50/74 |
| Lung cancer cases | 0/4.09 | 0/40.70 | 0.003/34.0 | 6.4/57.2 | 20.5/62.6 | 50/74 |
| Noncases | 0/5.25 | 0/64.70 | 0.003/37.8 | 0.3/61.4 | 16.9/63.0 | 50/74 |
| 25th percentile | ||||||
| Total group | 0.001 | 0.02 | 0.1 | 29.4 | 24.4 | 51 |
| Lung cancer cases | 0.002 | 0.02 | 0.1 | 27.1 | 25.1 | 51 |
| Noncases | 0.001 | 0.01 | 0.1 | 30.0 | 24.2 | 51 |
| 75th percentile | ||||||
| Total group | 0.08 | 1.03 | 2.1 | 49.5 | 34.5 | 65 |
| Lung cancer cases | 0.20 | 1.69 | 4.1 | 41.0 | 36.2 | 57 |
| Noncases | 0.07 | 0.95 | 1.9 | 50.4 | 34.2 | 65 |
XX are the last two digits of the year of hire. For example, 55 means that the individual was hired in 1955.
Figure 1.
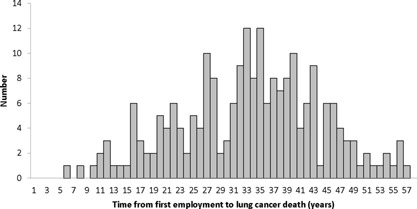
Time from Date of Employment until Death for the 217 Lung Cancer Deaths Among Chromium Production Workers, Baltimore, MD, 1950‐2011
There was a high proportion of cigarette smokers and “any smoking” (includes cigarettes, cigars, and pipes) in the cohort. Eighty, 79, and 65 percent of whites, nonwhites, and race unknown, respectively, were smokers. The vast majority (93%) of lung cancer deaths occurred among cigarette smokers (n = 202) vs. 2% among nonsmokers (n = 4), and 11 (5%) among individuals whose smoking status was unknown.
Table III allows an examination of the effect of age and cumulative chromium (VI) exposure on lung cancer mortality. Table IV is an examination of lung cancer O/E ratios by race (white, nonwhite) for the four cumulative chromium (VI) exposure quartiles. For the total cohort (all races combined including unknown race), there was an increase in the O/E lung cancer ratios from the first to the second quartile, a leveling off between the second and third quartiles, and an increase from the third to the fourth quartile. The trend is statistically significant (P < 0.001).
Table III.
Observed and Expected Lung Cancer Deaths, Person‐Years of Observation, Observed to Expected Ratios, and Cumulative Chromium (VI) Exposure by Age Category a for Chromium Production Workers, Baltimore, MD, 1950–2011
| Age Categories | ||||||||
|---|---|---|---|---|---|---|---|---|
| Cumulative Exposure (mg CrO3/m3‐years) | Metric | 20–29 | 30–39 | 40–49 | 50–59 | 60–69 | 70–79 | 80+ |
| 0–0.00149 | Observed | 0 | 1 | 0 | 14 | 14 | 13 | 3 |
| Expected | 0.0275 | 0.3466 | 2.2253 | 7.1421 | 12.2755 | 11.3581 | 7.0446 | |
| O/E | 0.00 | 2.89 | 0.00 | 1.96 | 1.14 | 1.14 | 0.43 | |
| Person‐Years | 5,545.87 | 7,672.32 | 6,468.66 | 5,392.98 | 3,942.02 | 2,376.38 | 1,351.31 | |
| Mean exposure | 0.000033 | 0.000224 | 0.000424 | 0.000513 | 0.000524 | 0.000522 | 0.000481 | |
| 0.0015–0.0089 | Observed | 0 | 0 | 2 | 10 | 20 | 19 | 3 |
| Expected | 0.0023 | 0.1854 | 1.7781 | 6.2058 | 10.4293 | 8.8081 | 3.8269 | |
| O/E | 0.00 | 0.00 | 1.12 | 1.61 | 1.92 | 2.16 | 0.78 | |
| Person‐Years | 435.22 | 3,315.10 | 4,862.83 | 4,685.27 | 3,472.45 | 1,890.98 | 738.86 | |
| Mean exposure | 0.0043 | 0.0043 | 0.0043 | 0.0043 | 0.0041 | 0.0040 | 0.0040 | |
| 0.009–0.0769 | Observed | 0 | 0 | 3 | 12 | 20 | 9 | 6 |
| Expected | 0.0029 | 0.1938 | 1.8068 | 6.4178 | 11.0683 | 9.2413 | 3.6495 | |
| O/E | 0.00 | 0.00 | 1.66 | 1.87 | 1.81 | 0.97 | 1.64 | |
| Person‐Years | 564.68 | 3,682.89 | 5,075.77 | 4,995.92 | 3,751.88 | 1,975.74 | 708.86 | |
| Mean exposure | 0.030 | 0.031 | 0.030 | 0.030 | 0.031 | 0.031 | 0.028 | |
| 0.077–5.25 | Observed | 0 | 0 | 8 | 12 | 30 | 17 | 1 |
| Expected | 0.0010 | 0.1574 | 1.6448 | 6.1926 | 10.3370 | 8.0835 | 2.5588 | |
| O/E | 0.00 | 0.00 | 4.86 | 1.94 | 2.90 | 2.10 | 0.39 | |
| Person‐Years | 205.54 | 2,871.27 | 4,608.52 | 4,839.11 | 3,525.14 | 1,743.25 | 487.26 | |
| Mean exposure | 0.199 | 0.297 | 0.391 | 0.465 | 0.515 | 0.572 | 0.624 | |
O/E, Observed/Expected.
Expected deaths are based on age‐, race‐, and calendar‐year specific rates for Maryland.
Table IV.
Lung Cancer Observed and Expected a Deaths, Person‐Years of Observation, and Observed‐to‐Expected Ratios by Race for the Four Exposure Quartiles for Chromium Production Workers, Baltimore, MD, 1950‐2011
| Cumulative Exposure (mg CrO3/m3‐years) | O | E | O/E | Person‐ Years | 95% CI |
|---|---|---|---|---|---|
| White | |||||
| 0–0.00149 | 26 | 26.14 | 0.99 | 18,966 | 0.65–1.46 |
| 0.0015–0.0089 | 35 | 16.82 | 2.08 | 9,101 | 1.45–2.89 |
| 0.009–0.0768 | 29 | 17.90 | 1.62 | 20,512 | 1.08–2.33 |
| 0.077–5.25 | 31 | 17.13 | 1.81 | 499 | 1.23–2.57 |
| Non‐white | |||||
| 0–0.00149 | 15 | 12.06 | 1.24 | 10,013 | 0.70–2.05 |
| 0.0015–0.0089 | 17 | 13.39 | 1.27 | 6,968 | 0.74–2.03 |
| 0.009–0.0768 | 18 | 13.58 | 1.33 | 7,667 | 0.79–2.10 |
| 0.077–5.25 | 36 | 13.29 | 2.71 | 8,024 | 1.90–3.75 |
| Unknown Race | |||||
| 0‐0.00149 | 4 | 4.52 | 0.89 | 3,770 | 0.24–2.27 |
| 0.0015–0.0089 | 2 | 3.64 | 0.55 | 2,832 | 0.06–1.98 |
| 0.009–0.0768 | 3 | 3.18 | 0.95 | 2,238 | 0.19–2.76 |
| 0.077–5.25 | 1 | 0.67 | 1.51 | 596 | 0.02–8.30 |
| Total | |||||
| 0–0.00149 | 45 | 42.72 b | 1.05 | 32,750 | 0.77–1.41 |
| 0.0015–0.0089 | 54 | 33.85 b | 1.60 | 18,901 | 1.20–2.08 |
| 0.009–0.0768 | 50 | 34.66 b | 1.44 | 30,416 | 1.07–1.90 |
| 0.077–5.25 | 68 | 31.09 b | 2.19 c | 9,119 | 1.70–2.77 |
E, Expected; O, Observed; O/E, Observed/Expected.
Expected deaths are based on age‐, race‐, and calendar‐year specific rates for Maryland.
Weighted E; Expected counts for unknown race were calculated by the weighted average of the expected counts for whites and nonwhites based on the ratio of whites and nonwhites in the population.
Trend test P < 0.001.
In a mortality analysis limited to smokers, the O/E for lung cancer became more pronounced within each exposure quartile, and the exposure‐response for the total group was monotonic: First Quartile O/E = 1.18 (95% CI 0.84–1.60); Second Quartile O/E = 1.81 (95% CI 1.34–2.39); Third Quartile O/E = 1.95 (95%CI 1.44–2.58); Fourth Quartile O/E = 2.54 (95% CI 1.96–3.24).
Cumulative chromium (VI) exposure was a significant (P > 0.05) predictor of lung cancer when included in a model with smoking and years worked. When cumulative chromium (VI) exposure and cumulative chromium (III) exposure were included in a model with smoking, neither was statistically significant (P > 0.05), but the parameter estimate for cumulative chromium (III) exposure was negative. The log cumulative chromium (VI) exposure and log cumulative chromium (III) exposure are strongly correlated (Pearson correlation coefficient = 0.98, P < 0.001). In a proportional hazards model with smoking, each unit increase in log10 cumulative chromium (VI) exposure was associated with a 1.255‐fold (P < 0.001) increase in the risk of lung cancer mortality. Smoking was associated with a 13.498‐fold (P < 0.001) increase in risk.
Slightly over 80% of the cohort experienced at least one sign of nasal irritation. Among lung cancer cases, 84.8% experienced at least one sign of nasal irritation; among non‐lung cancer cases 79.8% experienced at least one sign of nasal irritation. The percentage of lung cancer cases that experienced one or more signs of irritation was 87.6%, while among non‐cancer cases it was 83.0%. A significant association (P > 0.05) of lung cancer with the occurrence of irritated nasal septum, ulcerated nasal septum, perforated nasal septum, ulcerated skin, irritated skin, dermatitis, burn, and conjunctivitis was found using separate logistic regression models. The data are not shown. The risk of lung cancer death increased with frequency of nasal irritations per individual and differed with type of nasal irritation (Table V).
Table V.
Odds Ratios of Lung Cancer by the Number of Different Nasal Effects per Individual for Chromium Production Workers, Baltimore, MD 1950–2011
| Effect | Odds Ratio | |
|---|---|---|
| Point Estimate | 95% Wald Confidence Limits | |
| Irritated Nasal Septum | ||
| None (referent) | 1.000 | — |
| 1 or 2 from dispensary record, physical exam or hospital | 1.218 | 0.826, 1.795 |
| 3 or more from dispensary record, physical exam or hospital | 1.597 a | 1.134, 2.250 |
| Ulcerated Nasal Septum | ||
| None | 1.000 | — |
| 1 or 2 from dispensary record, physical exam or hospital | 1.078 | 0.681, 1.707 |
| 3 or more from dispensary record, physical exam or hospital | 1.715 b | 1.247, 2.361 |
| Perforated Nasal Septum | ||
| None (referent) | 1.000 | — |
| 1 or 2 from dispensary record, physical exam or hospital | 1.572 | 1.004, 2.463 |
| 1 or more from compensation report | 2.293 | 1.480, 3.552 |
| 3 or more from dispensary record, physical exam or hospital | 2.656 b | 1.148, 6.145 |
| Bleeding Nasal Septum | ||
| None (referent) | 1.000 | — |
| 1 or 2 from dispensary record, physical exam or hospital | 0.876 | 0.536, 1.433 |
| 3 or more from dispensary record, physical exam or hospital | 1.432 | 0.639, 3.210 |
P for trend <0.01.
P for trend <0.001.
DISCUSSION
The current report adds more than 20,000 person‐years of observation to the study of the Baltimore chromium production workers. Death from lung cancer remains significantly elevated. Deaths from other types of cancer were not elevated. The lung cancer risk was elevated in all four quartiles compared to the expected based on Maryland rates and was significantly elevated in the 2nd, 3rd, and 4th cumulative exposure quartiles.
Considering person‐years over the age of 96 as lost to follow‐up had little effect on the estimates. Forty‐six of the 2,354 persons in the cohort were found to be over the age of 96 meaning that 280 person‐years were not included in the analysis. The average age of death in the cohort was 65. The average age of death from lung cancer was also 65.
Despite the significant prevalence of smoking in the cohort (>80%), cumulative chromium (VI) exposure was still a significant predictor of lung cancer risk. Only four lung cancer cases did not smoke, and the smoking status of 11 lung cancer cases was unknown. When the O/E analysis was limited to smokers, the O/E for each cumulative chromium (VI) exposure quartile increased, and there was a monotonic increase in the SMR across quartiles. This may suggest an interaction of chromium (VI) exposure and smoking with respect to lung cancer risk; however, the limited number of lung cancer cases who did not smoke (N = 4) did not permit further statistical evaluation.
The mean length of time from the date of first employment until the date of lung cancer death was 33.8 (SD = 10.7) years, suggesting a fairly long latency. The range was 6.4–57.2 years. Enterline [1974] stated that the risk of lung cancer death was highest shortly after active employment in the chromate production industry suggesting a “short latency period probably as the result of exposure to a very potent carcinogen.” To be included in the cohort described by Enterline [1974]; workers had to have been employed “sufficiently long” at any one of three chromium production plants during the period January 1, 1937 to December 31, 1940 [Taylor, 1966]. Exposure in the Taylor [1966] cohort, on which the observations by Enterline [1974] are based, likely reflect much higher cumulative exposures than in the present cohort. The Baltimore plant built a new mill and roast department in 1950 using what were considered state of the art industrial hygiene practices. Furthermore, unlike the Taylor [1966] cohort, short term workers (<90 days employment) were included in the present cohort. The difference in average cumulative exposure between the Taylor [1966] cohort and the present cohort likely explains the difference in what Enterline [1974] describes as a short latency period vs. the relatively long mean latency in the present cohort.
Cumulative chromium (VI) exposure was not a statistically significant predictor of lung cancer (P = 0.143) in the proportional hazards model which included cumulative chromium (III) and smoking as covariates. However, cumulative chromium (VI) exposure was a statistically significant predictor in the proportional hazards model with smoking and duration of employment. Given the strong correlation between cumulative chromium (VI) and cumulative chromium (III) exposure, the lack of statistical significance of cumulative chromium (VI) in the model with smoking and chromium (III) was not surprising.
Eight clinically diagnosed signs of irritation were significantly (P > 0.05) associated with lung cancer death. The odds ratio for lung cancer death increased with frequency of irritation per individual. This was true for the four types of nasal irritation and all other forms of irritation except perforated ear. These findings may simply indicate that irritation is a marker of exposure; alternatively they may indicate that irritation is a mechanism for chromium (VI)‐induced lung cancer. Inflammation is recognized as having a role in tumor promotion in general [Coussens and Werb, 2002; Mantovani et al., 2008], and it has specifically been recognized as having a role with respect to lung cancer [Azad et al., 2008; Engels, 2008; Lee et al., 2008].
The Occupational Safety and Health Administration's (OSHA) Permissible Exposure Level (PEL) for chromium (VI) is 5 μg/m3 as an 8‐hour time weighted average [OSHA, 2006]. OSHA assumes that a working lifetime is 45 years. If one worked 45 years and was exposed to an 8‐hour time weighted average of 5 μg/m3, the cumulative exposure would be 225 μg/m3‐work years. That exposure would fall in the highest exposure quartile in the current study. The NIOSH REL for chromium (VI) is 0.2 μg/m3 as an 8‐hour time‐weighted average [NIOSH, 2013b]. Assuming a 45 year working lifetime at the REL, the cumulative exposure would fall in the 3rd exposure quartile of the current study.
Other studies have also evaluated lung cancer risk by cumulative chromium (VI) exposure [Mancuso, 1975; Gerin et al., 1993; Mancuso, 1997; Luippold et al., 2003]. These studies, however, do not have the historic and prolific exposure data, the amount of information on smoking, the number of lung cancer deaths, or the person‐years of observation of the current study. Furthermore, the present study evaluates lung cancer risk at much lower cumulative exposures than the aforementioned studies and is the only study to evaluate the relationship of irritation and lung cancer risk.
ACKNOWLEDGMENTS
The authors wish to thank Dr. Paul Pinsky of the National Cancer Institute for his expert advice on the analysis. The authors also wish to thank Ms. Emily Ryan, a student in the Environmental and Occupational Health Department of the George Washington University Milken Institute School of Public Health for her assistance in the preparation of the manuscript. Funding for this study was partially provided by the United States Environmental Protection Agency, PO EP06H000522.
Dr. Herman Gibb has served as an expert witness in tort cases involving hexavalent chromium.
Dr. Gibb prepared the manuscript and directed the analysis. Dr. Lees obtained and analyzed vital status from the National Death Index and reviewed and commented on the manuscript. Ms. Wang and Ms. O'Leary conducted statistical analyses and reviewed and commented on the manuscript. The enclosed manuscript is an original work. It has not been published previously in whole or in part and is not under consideration for publication elsewhere. All authors have read the manuscript and agree that the work is prepared for journal submission. All authors accept responsibility for the contents of the enclosed manuscript.
REFERENCES
- Akaike, H. 1973. Information theory and an extension of the maximum likelihood principle. In Proc. 2nd Int. Symp. Info. Theory, Ed. B. N. Petrov and F. Csaki, pp 267–81. Budapest: Akademia Kiado.
- Armitage P 1955. Tests for linear trends in proportions and frequencies. Biometrics 11:375–386. [Google Scholar]
- Azad N, Rojanasakul Y, Vallyathan V. 2008. Inflammation and lung cancer: Roles of reactive oxygen/nitrogen species. J Toxicol and Env Heal B 11((1)):1–15. [DOI] [PubMed] [Google Scholar]
- Baetjer AM 1950. Pulmonary carcinoma in chromate workers. II. Incidence on basis of hospital records. AMA Arch Indust Hyg and Occup Med 2:505–516. [PubMed] [Google Scholar]
- Breslow N, Lubin J, Marek P, Langholz B. 1983. Multiplicative models and cohort analyses. J Am Stat Assoc 78:1–12. [Google Scholar]
- Cochran W G 1954. Some methods of strengthening the common Х2 tests. Biometrics 10:417–451. [Google Scholar]
- Coussens LM, Werb Z. 2002. Inflammation and cancer. Nature 420:860–867. [DOI] [PMC free article] [PubMed] [Google Scholar]
- Engels EA 2008. Inflammation in the development of lung cancer: Epidemiological evidence. Expert Rev Anticancer Ther 8(4):605–615. [DOI] [PubMed] [Google Scholar]
- Enterline P 1974. Respiratory cancer among chromate workers. J Occup Med 16(8):523–526. [PubMed] [Google Scholar]
- Gerin M, Fletcher AC, Gray C, Winkelmann R, Boffetta P, Simonato L. 1993. Development and use of a welding process exposure matrix in a historical prospective study of lung cancer risk in European welders. Int J Epidemiol 22(Suppl 2):S22–S28. [DOI] [PubMed] [Google Scholar]
- Gibb HJ, Lees PSJ, Pinsky PF, Rooney BC. 2000a. Lung cancer among workers in chromium chemical production. Am J Ind Med 38(2):115–126. [DOI] [PubMed] [Google Scholar]
- Gibb HJ, Lees PSJ, Pinsky PF, Rooney BC. 2000b. Clinical findings of irritation among chromium chemical production workers. Am J Ind Med 38(2):127–131. [DOI] [PubMed] [Google Scholar]
- Hayes RB, Lilienfeld AM, Snell LM. 1979. Mortality in chromium chemical production workers: A prospective study. Int J Epidemiol 8(4):365–373. [DOI] [PubMed] [Google Scholar]
- IARC. 1990. Monographs on the evaluation of carcinogenic risks to humans: chromium, nickel, and welding. Volume 49. International Agency for Research on Cancer, Lyons, France. [PMC free article] [PubMed]
- IARC. 2012. Arsenic, metals, fibres, and dusts. Volume 100C. A review of human carcinogens. IARC monographs on the evaluation of carcinogenic risks to humans. International Agency for Research on Cancer, Lyons, France. [PMC free article] [PubMed]
- Lee JM, Yanagawa J, Peebles KA, et al. 2008. Inflammation in lung carcinogenesis: new targets for lung cancer chemoprevention and treatment. Cr Rev Oncol‐Hem 66(3):208–217. [DOI] [PMC free article] [PubMed] [Google Scholar]
- Luippold RS, Mundt KA, Austin RP, Liebig E, Crump C, Crump K, Proctor D. 2003. Lung cancer mortality among chromate production workers. Occup Environm Med 60:451–457. [DOI] [PMC free article] [PubMed] [Google Scholar]
- Mancuso, TF. 1975. Consideration of chromium as an industrial carcinogen.
- International Conference on Heavy Metals in the Environment, Toronto, Ontario, Canada, October 27–31. pp. 343–356.
- Mancuso TF 1997. Chromium as an industrial carcinogen: Part I. Am J Ind Med 31:129–139. [DOI] [PubMed] [Google Scholar]
- Machle W, Gregorius F. 1948. Cancer of the respiratory system in the U.S. chromate‐producing industry. Pub Health Rep 63:1114–1127. [PubMed] [Google Scholar]
- Mancuso TF, Hueper WC. 1951. Occupational cancer and other health hazards in a chromate plant: a medical appraisal. I. Lung cancer in chromate workers. Indust Med and Surg 20:358–363. [PubMed] [Google Scholar]
- Mantovani A, Allavena P, Sica A, Balkwill F. 2008. Cancer‐related inflammation. Nature 454:436–444. [DOI] [PubMed] [Google Scholar]
- National Center for Health Statistics. 2014. The National Death Index. Hyattsville, MD: National Center for Health Statistics; 2014. (http://www.cdc.gov/nchs/ndi.htm). (Accessed May 20, 2015).
- NIOSH. 2013a. National Institute for Occupational Safety and Health (NIOSH). Life table analysis system, LTAS.NET ver. 3.0.1. Washington, DC: NIOSH (http://www.cdc.gov/niosh/ltas/). (Accessed May 20, 2015).
- NIOSH. 2013b. National Institute for Occupational Safety and Health Criteria for a Recommended Standard: Occupational Exposure to Chromium (VI). Washington, DC: National Institute for Occupational Safety and Health (DHHS publication no. 2013–128).
- OSHA. 2006. Occupational Safety and Health Administration Final Rule. “Occupational Exposure to Chromium (VI).” Federal Register 71, no. 39 (February 28, 2006): 10099–10385. (http://www.osha.gov/pls/oshaweb/owadisp.show_document?p_id=18599&p_table=federal_register). (Accessed May 20, 2015).
- Park RM, Bena JF, Stayner LT, Smith RJ, Gibb HJ, Lees PSJ. 2004. Chromium (VI) and lung cancer in the chromate industry: A quantitative risk assessment. Risk Anal 24(5):1099–1108. [DOI] [PubMed] [Google Scholar]
- U.S. Public Health Service. 1951. Health of workers in chromate producing industry ‐ a study. Public Health Service Publication No. 192.
- Rothman KJ, Boice JD Jr. 1979. Epidemiologic Analysis with a Programmable Calculator. Washington, DC: US Government Printing Office. 142 p.
- SAS Institute Inc. 2009. SAS statistical software, version 9.2. Cary, NC: SAS Institute Inc., 2009.
- Taylor F 1966. The relationship of mortality and duration of employment as reflected by a cohort of chromate workers. Am J Public Health 56(2):218–229. [DOI] [PMC free article] [PubMed] [Google Scholar]
- WHO. 2013. Inorganic chromium (VI) compounds. Concise International Chemical Assessment Document 78. World Health Organization, Geneva.