Figure 3.
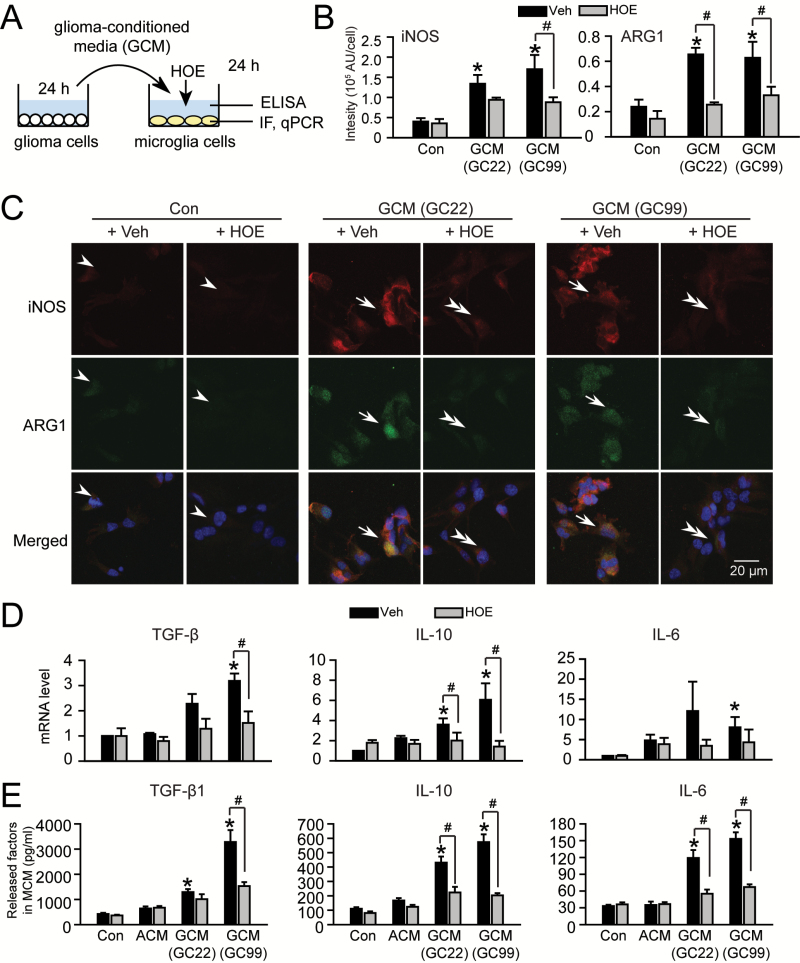
Glioma concurrently stimulates NHE1 activation and the glioma-associated activation phenotype in microglia. (A) GCM was harvested from glioma cultures (GC22 or GC99) and then added to microglia cultures for 24h either in the presence or absence of NHE1 inhibitor HOE642 (1 μM). Microglia or MCM were collected for immunofluorescence staining (IF), qPCR assays and ELISA. (B) Summary in changes of iNOS and Arg1 IF intensity under different conditions as listed in C. Data are mean ± SEM. n = 4, *P < 0.05 versus Con. (C) Representative immunofluorescence images showing expression of inducible nitric oxide synthase (iNOS, red) and arginase1 (ARG1, green) in microglia cultures under different conditions (Con ± HOE or GCM ± HOE). Scale bar: 10 μm. (D). Changes in mRNA expression of microglial activation markers under different conditions (Con ± HOE, ACM ± HOE or GCM ± HOE). Data are mean ± SEM. n = 4, *P < 0.05 versus Con. (E) Changes of released factors in MCM under different conditions evaluated by ELISA as listed in D. Data are mean ± SEM. n = 4, *P < 0.05 versus Con.

