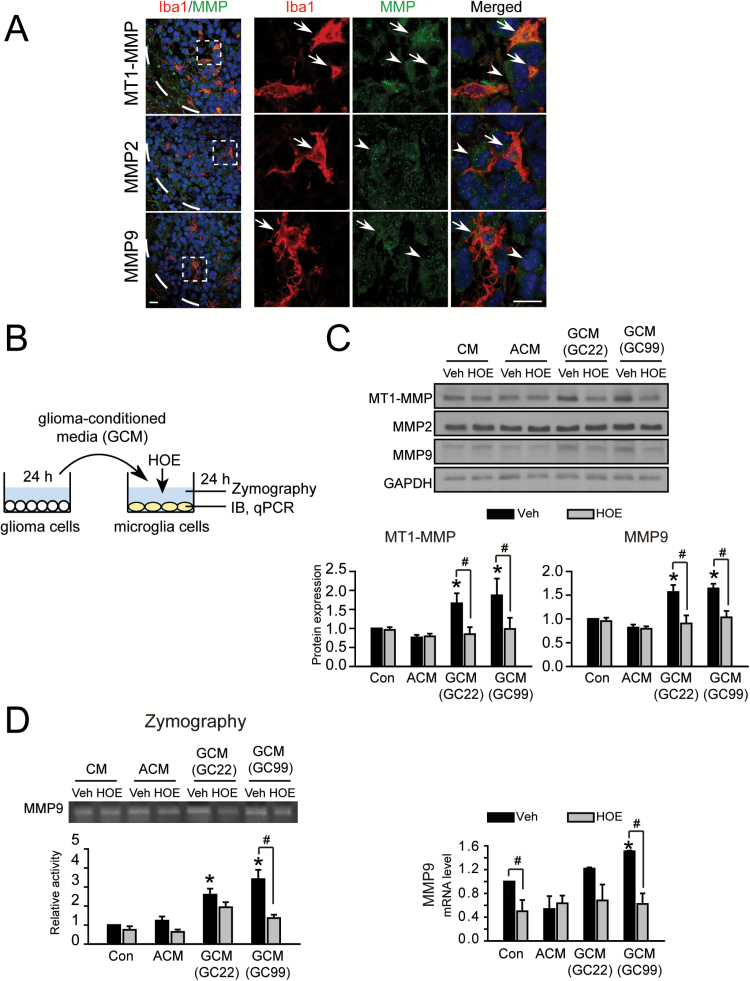
Figure 4.
Microglial NHE1 activity links to upregulation and activation of microglial MMPs. (A) Expression of different MMPs (MT1-MMP, MMP2 and MMP9) as characterized by immunofluorescences stainings in GC22 xenograft tissues. Representative immunofluorescence images show expression of microglia marker Ibal (red) and different MMPs (green). White boxes: areas were magnified in the right panels. White dash lines: tumor boarders. Arrow: expression of MMPs in Iba1+ cells. Arrowheads: expression of MMPs in Iba1− cells. Scale bar: 10 μm. (B) Protocol. GCM was harvested from glioma cultures (GC22 or GC99) and added to microglia cultures for 24h either in the presence or absence of NHE1 inhibitor HOE642 (1 μM). Microglia were subjected to qPCR assays and immunoblotting. MCM was harvested for gelatin zymography assays. (C) Representative immunoblots showing MMP expression in microglia under different conditions. Data represent mean ± SEM. n = 6, *P < 0.05 versus C/MCM + Veh; # P < 0.05 versus G/MCM + HOE. (D) Representative zymography showing activity of MMP9 in MCM in the presence or absence of HOE642. Data are mean ± SEM. n = 4, *P < 0.05 versus C/MCM + Veh; # P < 0.05 versus G/MCM + HOE. (E) Changes in mRNA expression of MMP9. Data are mean ± SEM. n = 4, *P < 0.05 versus Con.

