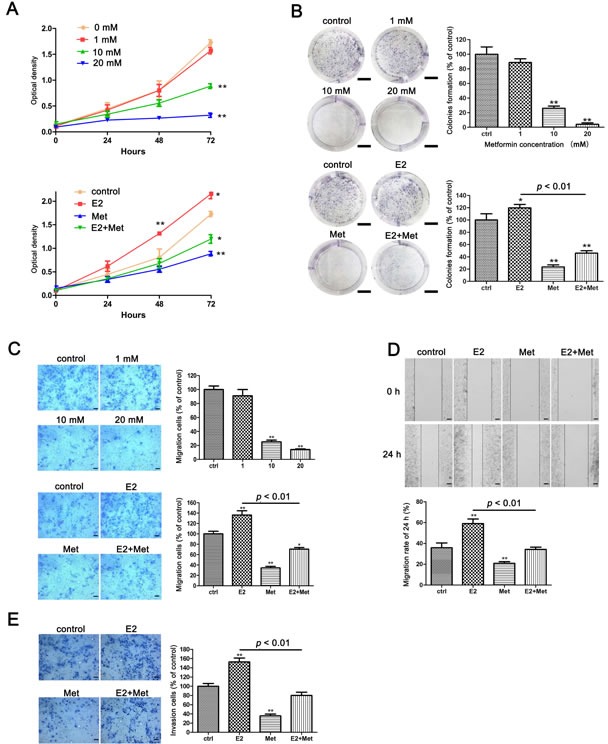
Figure 1. Metformin inhibits E2-induced proliferation, migration, and invasion in Ishikawa cells.

A. Ishikawa cells were treated with metformin (0, 1, 10, and 20 mM) (upper) and E2 with or without metformin (lower), cell numbers were measured by CCK-8 assays at indicated times. B. Colony formation assays were used to measure the colonogenicity of Ishikawa cells after E2 or/and metformin treatment. The number of untreated cells was set as 100%. Scale bar: 1 cm. C. Transwell migration assays of Ishikawa cells after E2 and metformin treatment. Representative images were obtained at 100× magnification. Graphs show the number of migration cells for each treatment group (averaged across three random images). Scale bar: 50 μm. D. Wound-healing assays of Ishikawa cells. Representative images were obtained at 40× magnification. Graphs show the relative migration distance after 24 h incubation. Scale bar: 125 μm. E. Transwell invasion assays of Ishikawa cells. Representative images were obtained at 100× magnification. Graphs show the number of invasion cells for each treatment group (averaged across three random images). Scale bar: 50 μm. Data represent the mean ± SD from one representative experiment of three independent experiments. E2: 17β-estradiol; Met: metformin. * p < 0.05, ** p < 0.01 vs. untreated cells.
