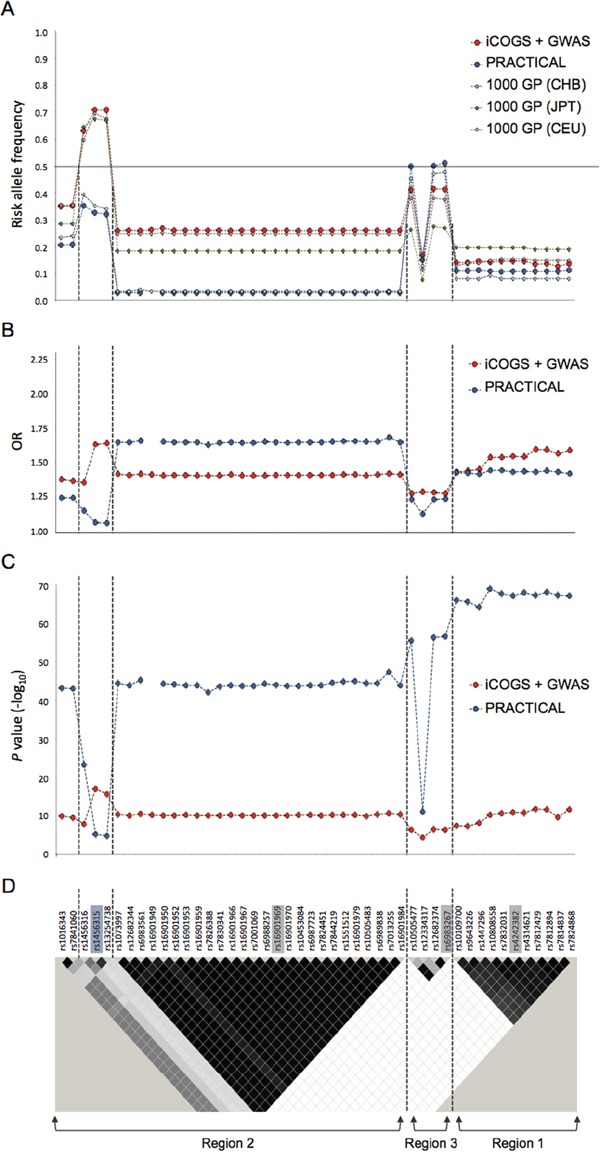
Figure 2. The risk allele frequency, OR and P value plots at the four 8q24 prostate cancer-associated loci in Chinese, Japanese and European descendants.

A. Risk allele frequency, B. OR and C. P value plots of SNPs with P<1×10⁻⁴ in meta-analysis results of Chinese data. D. LD map of 8q24 region based on r2 values computed using iCOGS Chinese genotyping data. Index SNPs are highlighted in grey on the LD plot. The independently associated SNP rs1456315 in Chinese iCOGS data is highlighted in blue. Previously reported prostate cancer-associated regions 1, 2 and 3 are indicated below the LD map. The vertical dashed lines distinguish the four 8q24 loci independently associated with Chinese prostate cancer accordingly to Chinese iCOGS data. iCOGS: iCOGS array data from Chinese ancestors; PRACTICAL: iCOGS array data from European ancestors; 1000 GP: 1000 Genome Project data; GWAS: Chinese GWAS data.
